
|
|||||
|
 | |
| |
| |
| |
| |
| |
|
Gene: ARHGEF35 |
Gene summary for ARHGEF35 |
| Gene information | Species | Human | Gene symbol | ARHGEF35 | Gene ID | 445328 |
| Gene name | Rho guanine nucleotide exchange factor 35 | |
| Gene Alias | ARHGEF5L | |
| Cytomap | 7q35 | |
| Gene Type | protein-coding | GO ID | NA | UniProtAcc | A5YM69 |
Top |
Malignant transformation analysis |
| Identification of the aberrant gene expression in precancerous and cancerous lesions by comparing the gene expression of stem-like cells in diseased tissues with normal stem cells |
| Entrez ID | Symbol | Replicates | Species | Organ | Tissue | Adj P-value | Log2FC | Malignancy |
| 445328 | ARHGEF35 | LZE4T | Human | Esophagus | ESCC | 2.04e-02 | 7.32e-02 | 0.0811 |
| 445328 | ARHGEF35 | LZE7T | Human | Esophagus | ESCC | 5.26e-05 | 4.20e-01 | 0.0667 |
| 445328 | ARHGEF35 | LZE22T | Human | Esophagus | ESCC | 3.41e-03 | 1.96e-01 | 0.068 |
| 445328 | ARHGEF35 | LZE24T | Human | Esophagus | ESCC | 6.50e-09 | 1.58e-01 | 0.0596 |
| 445328 | ARHGEF35 | P2T-E | Human | Esophagus | ESCC | 8.55e-05 | 6.40e-02 | 0.1177 |
| 445328 | ARHGEF35 | P4T-E | Human | Esophagus | ESCC | 4.52e-12 | 2.59e-01 | 0.1323 |
| 445328 | ARHGEF35 | P5T-E | Human | Esophagus | ESCC | 1.48e-04 | 6.72e-02 | 0.1327 |
| 445328 | ARHGEF35 | P8T-E | Human | Esophagus | ESCC | 7.09e-11 | 9.10e-02 | 0.0889 |
| 445328 | ARHGEF35 | P9T-E | Human | Esophagus | ESCC | 2.42e-14 | 3.98e-01 | 0.1131 |
| 445328 | ARHGEF35 | P10T-E | Human | Esophagus | ESCC | 2.28e-09 | 1.93e-01 | 0.116 |
| 445328 | ARHGEF35 | P12T-E | Human | Esophagus | ESCC | 9.81e-14 | 3.07e-01 | 0.1122 |
| 445328 | ARHGEF35 | P15T-E | Human | Esophagus | ESCC | 9.88e-14 | 1.99e-01 | 0.1149 |
| 445328 | ARHGEF35 | P21T-E | Human | Esophagus | ESCC | 1.12e-10 | 2.25e-01 | 0.1617 |
| 445328 | ARHGEF35 | P22T-E | Human | Esophagus | ESCC | 1.04e-05 | 5.00e-02 | 0.1236 |
| 445328 | ARHGEF35 | P23T-E | Human | Esophagus | ESCC | 2.36e-06 | 7.71e-02 | 0.108 |
| 445328 | ARHGEF35 | P26T-E | Human | Esophagus | ESCC | 6.84e-07 | 1.10e-01 | 0.1276 |
| 445328 | ARHGEF35 | P28T-E | Human | Esophagus | ESCC | 6.34e-50 | 7.62e-01 | 0.1149 |
| 445328 | ARHGEF35 | P30T-E | Human | Esophagus | ESCC | 8.26e-14 | 6.14e-01 | 0.137 |
| 445328 | ARHGEF35 | P31T-E | Human | Esophagus | ESCC | 9.71e-20 | 3.40e-01 | 0.1251 |
| 445328 | ARHGEF35 | P32T-E | Human | Esophagus | ESCC | 6.60e-12 | 2.57e-01 | 0.1666 |
| Page: 1 2 3 4 |
| Tissue | Expression Dynamics | Abbreviation |
| Esophagus | 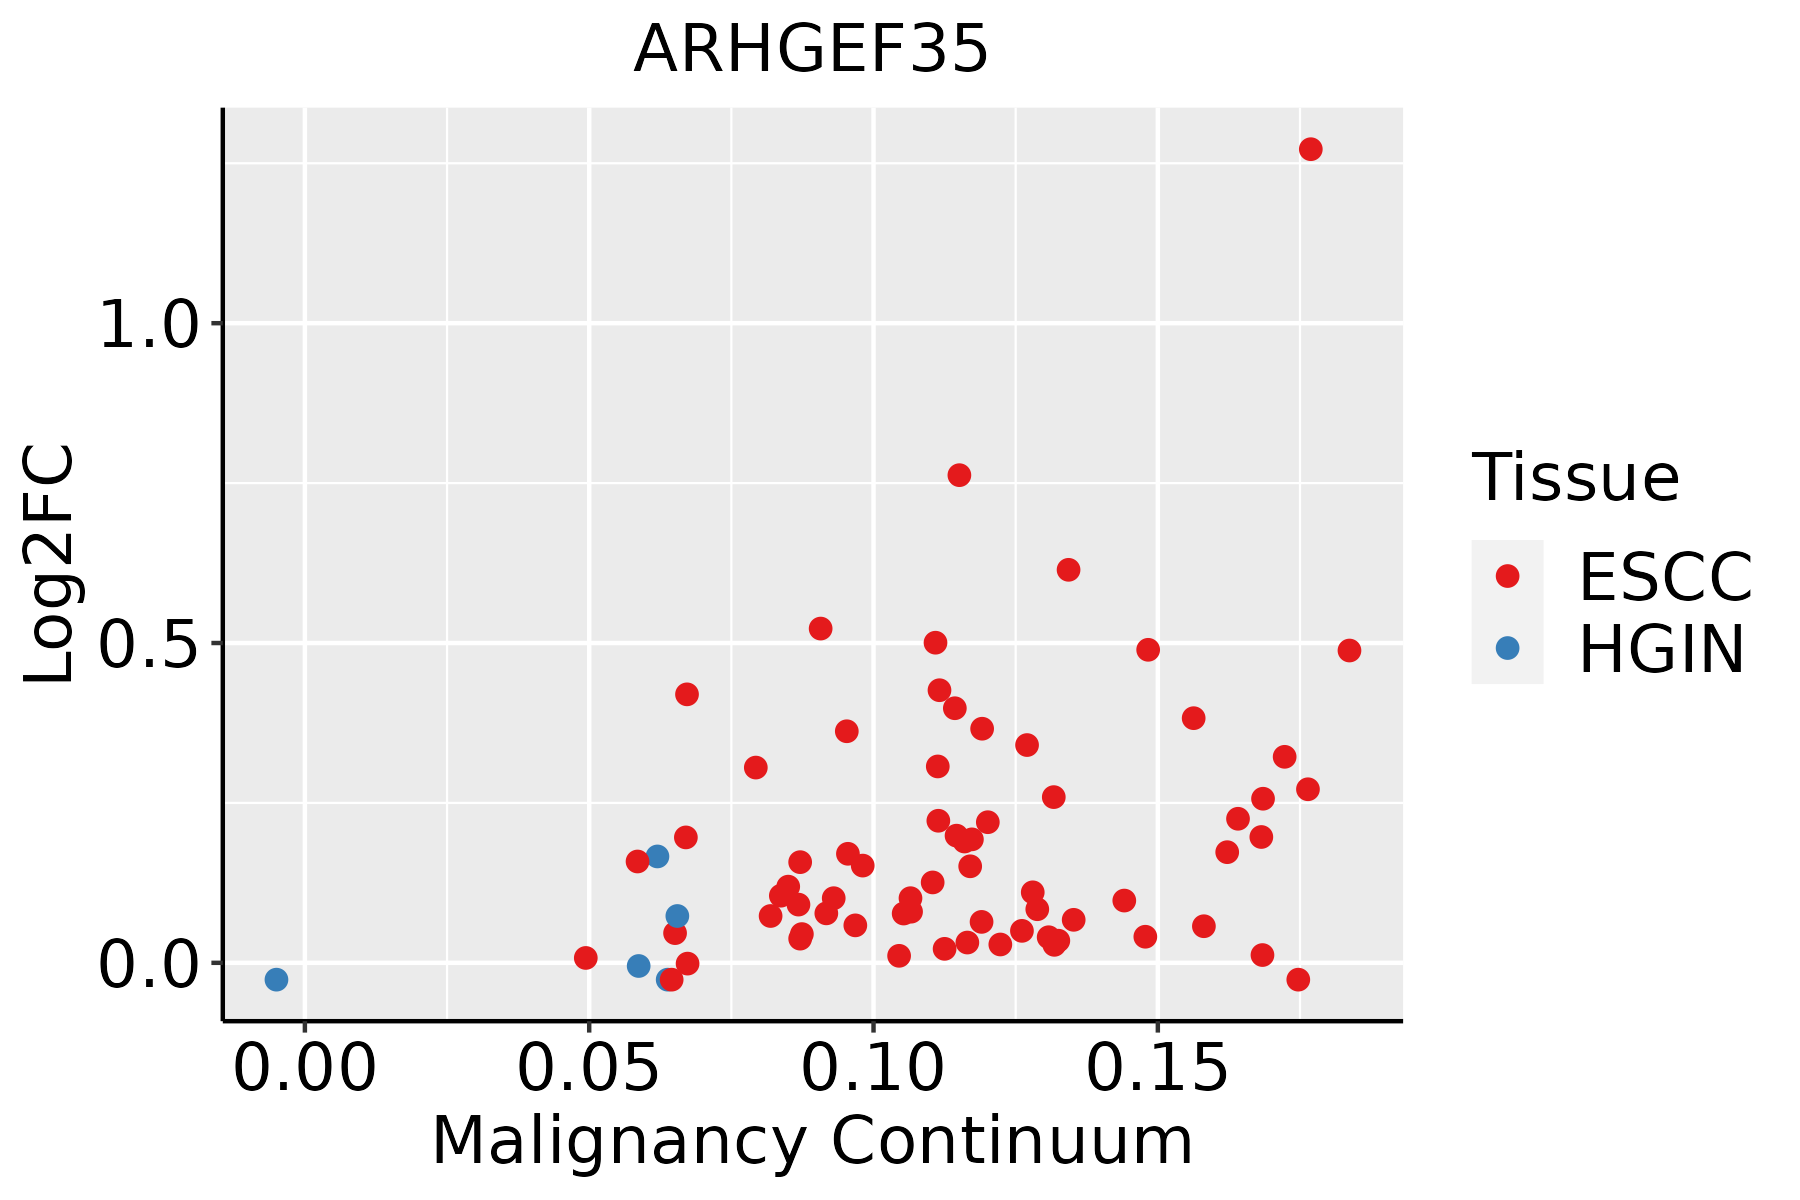 | ESCC: Esophageal squamous cell carcinoma |
| HGIN: High-grade intraepithelial neoplasias | ||
| LGIN: Low-grade intraepithelial neoplasias | ||
| Oral Cavity |  | EOLP: Erosive Oral lichen planus |
| LP: leukoplakia | ||
| NEOLP: Non-erosive oral lichen planus | ||
| OSCC: Oral squamous cell carcinoma | ||
| Skin | 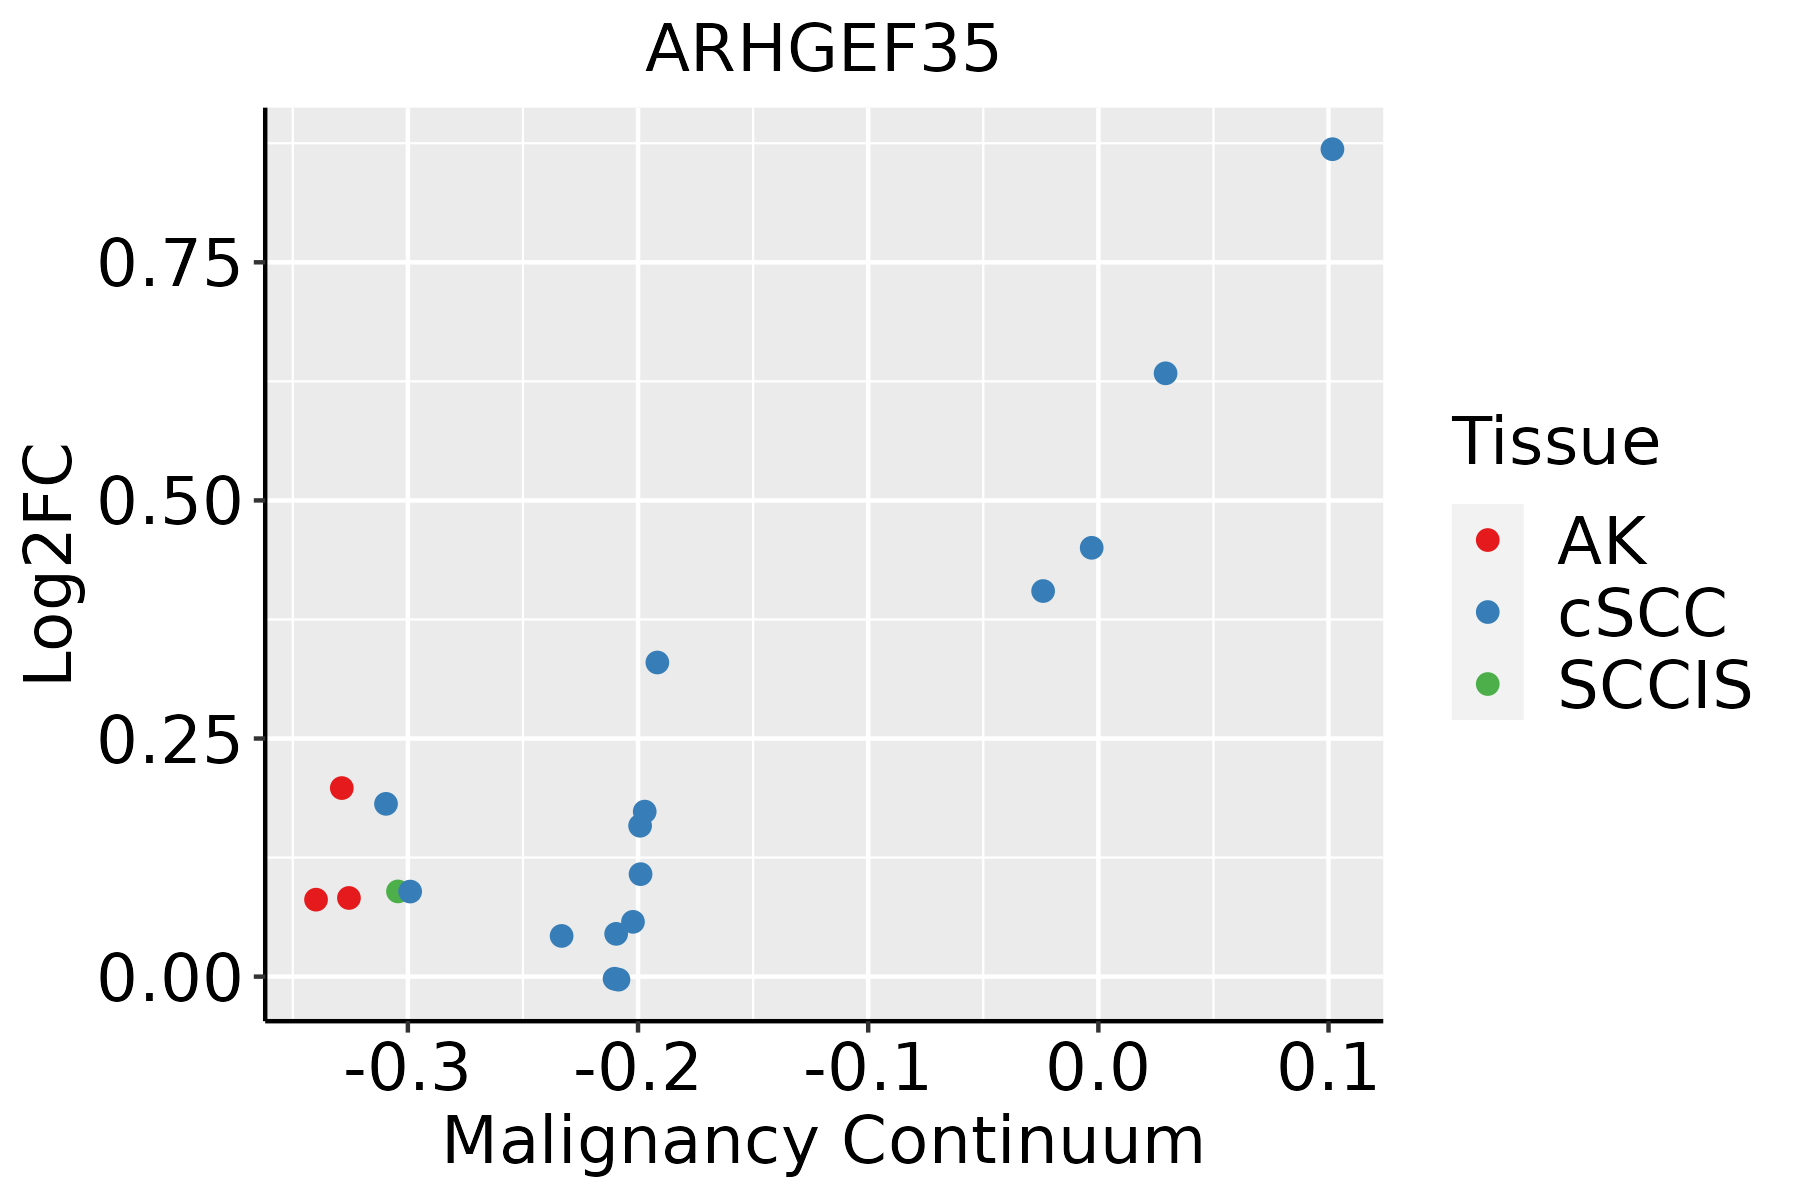 | AK: Actinic keratosis |
| cSCC: Cutaneous squamous cell carcinoma | ||
| SCCIS:squamous cell carcinoma in situ | ||
| Thyroid | 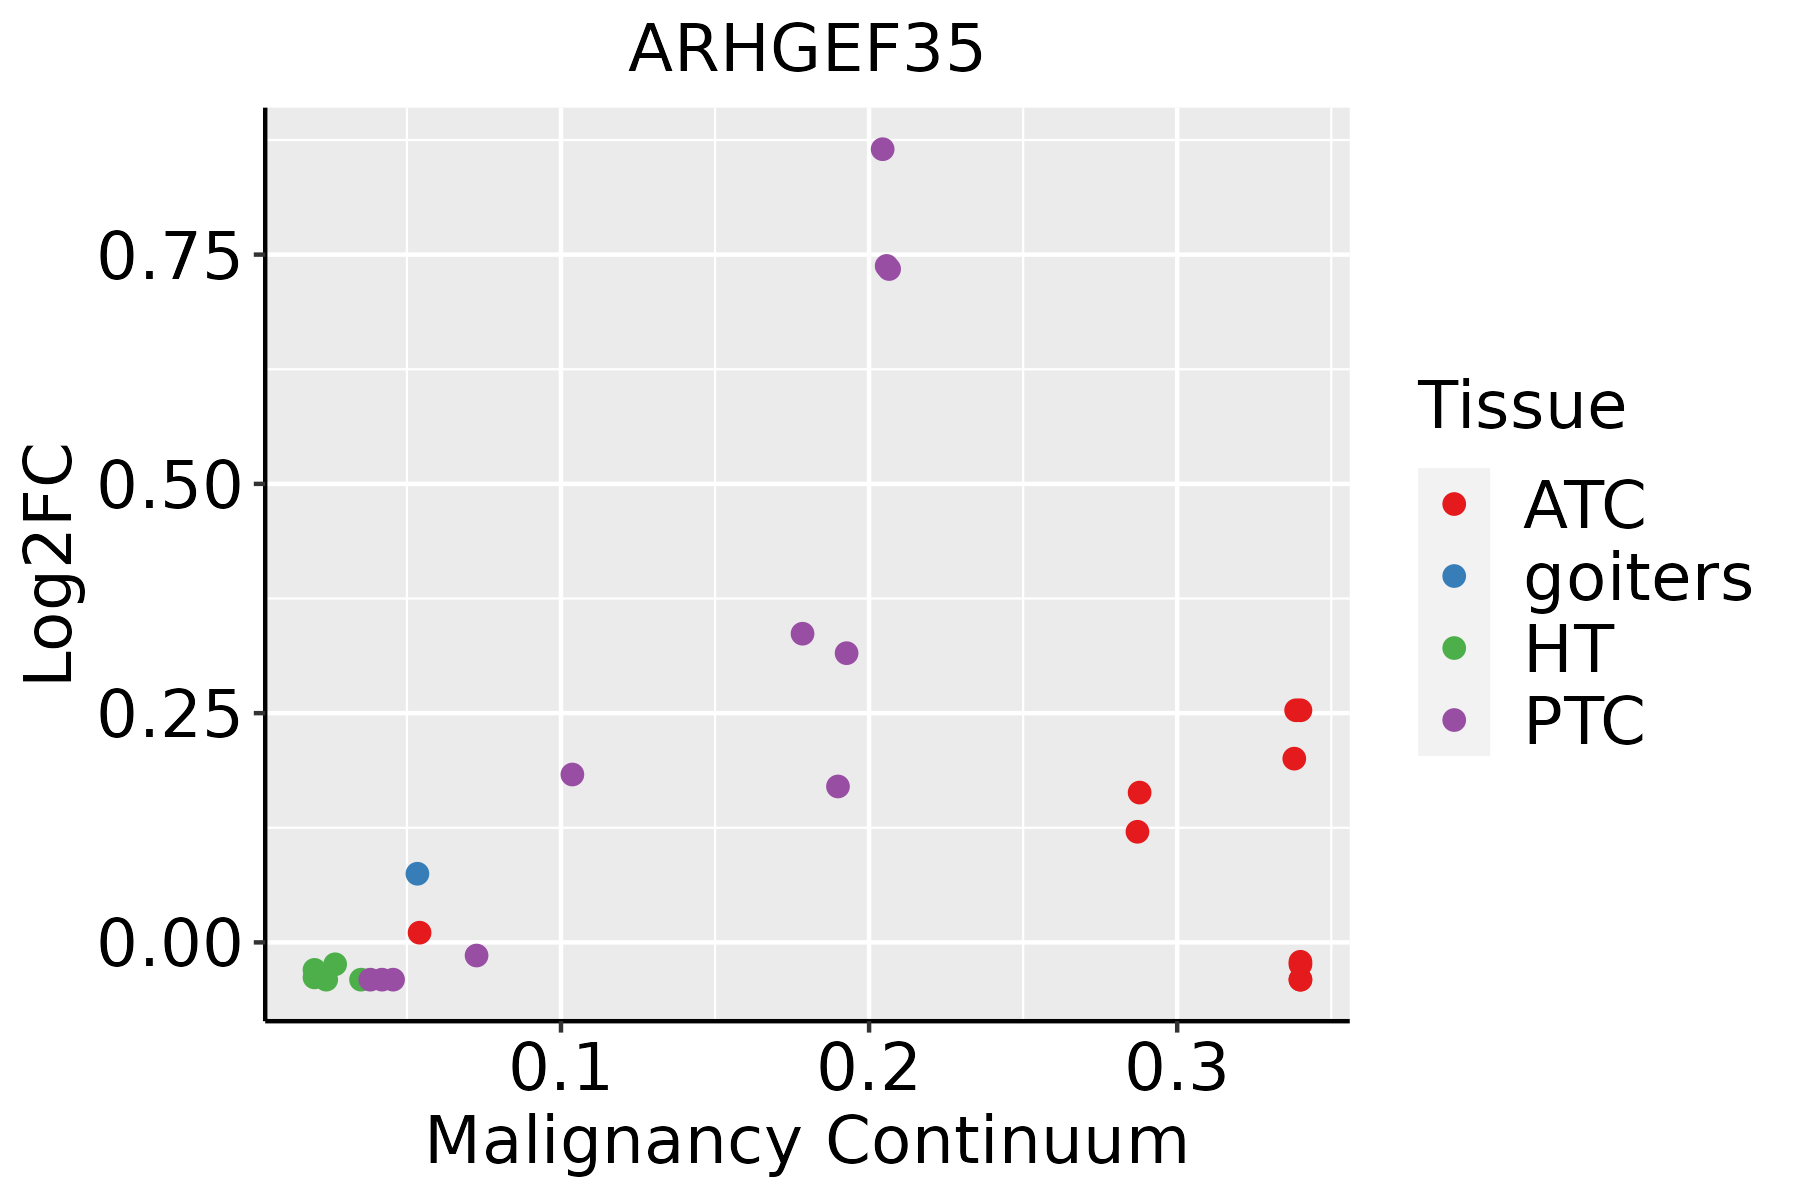 | ATC: Anaplastic thyroid cancer |
| HT: Hashimoto's thyroiditis | ||
| PTC: Papillary thyroid cancer |
| ∗log2FC in expression of this searched gene in stem-like cells from each diseased tissue sample relative to stem-like cells in normal samples in each tissue plotted against the malignancy continuum. Samples are colored based on if they are from different disease stage. |
Top |
Malignant transformation related pathway analysis |
| Find out the enriched GO biological processes and KEGG pathways involved in transition from healthy to precancer to cancer |
| Tissue | Disease Stage | Enriched GO biological Processes |
| Colorectum | AD |  |
| Colorectum | SER |  |
| Colorectum | MSS |  |
| Colorectum | MSI-H |  |
| Colorectum | FAP |  |
| ∗Top 15 enriched GO BP terms are showed in the bar plot of each disease state in each tissue. Each row represents a significant GO biological process which is colored according to the -log10(p.adjust). |
| Page: 1 2 3 4 5 6 7 8 9 |
| GO ID | Tissue | Disease Stage | Description | Gene Ratio | Bg Ratio | pvalue | p.adjust | Count |
| Page: 1 |
| Pathway ID | Tissue | Disease Stage | Description | Gene Ratio | Bg Ratio | pvalue | p.adjust | qvalue | Count |
| Page: 1 |
Top |
Cell-cell communication analysis |
| Identification of potential cell-cell interactions between two cell types and their ligand-receptor pairs for different disease states |
| Ligand | Receptor | LRpair | Pathway | Tissue | Disease Stage |
| Page: 1 |
Top |
Single-cell gene regulatory network inference analysis |
| Find out the significant the regulons (TFs) and the target genes of each regulon across cell types for different disease states |
| TF | Cell Type | Tissue | Disease Stage | Target Gene | RSS | Regulon Activity |
| ∗The dot plots of a searched regulon are shown for all cell subpopulations in each disease state of each tissue based on the regulon specific score inferred using pySCENIC and by calculating the average expression. |
| Page: 1 |
Top |
Somatic mutation of malignant transformation related genes |
| Annotation of somatic variants for genes involved in malignant transformation |
| Hugo Symbol | Variant Class | Variant Classification | dbSNP RS | HGVSc | HGVSp | HGVSp Short | SWISSPROT | BIOTYPE | SIFT | PolyPhen | Tumor Sample Barcode | Tissue | Histology | Sex | Age | Stage | Therapy Types | Drugs | Outcome |
| ARHGEF35 | SNV | Missense_Mutation | novel | c.241N>C | p.Glu81Gln | p.E81Q | A5YM69 | protein_coding | deleterious(0.02) | possibly_damaging(0.515) | TCGA-AC-A5XS-01 | Breast | breast invasive carcinoma | Female | >=65 | I/II | Hormone Therapy | femara | SD |
| ARHGEF35 | SNV | Missense_Mutation | novel | c.671N>T | p.Pro224Leu | p.P224L | A5YM69 | protein_coding | tolerated(0.71) | benign(0.006) | TCGA-BH-A0C1-01 | Breast | breast invasive carcinoma | Female | <65 | III/IV | Chemotherapy | adriamycin | PD |
| ARHGEF35 | SNV | Missense_Mutation | c.1391C>A | p.Ser464Tyr | p.S464Y | A5YM69 | protein_coding | deleterious(0) | probably_damaging(0.959) | TCGA-D8-A1JL-01 | Breast | breast invasive carcinoma | Female | >=65 | I/II | Unknown | Unknown | SD | |
| ARHGEF35 | SNV | Missense_Mutation | rs553072768 | c.1285N>A | p.Val429Met | p.V429M | A5YM69 | protein_coding | tolerated(1) | benign(0.01) | TCGA-DS-A1OD-01 | Cervix | cervical & endocervical cancer | Female | <65 | I/II | Chemotherapy | cisplatin | SD |
| ARHGEF35 | SNV | Missense_Mutation | novel | c.1019C>T | p.Ser340Phe | p.S340F | A5YM69 | protein_coding | deleterious(0.01) | benign(0.358) | TCGA-AG-A002-01 | Colorectum | rectum adenocarcinoma | Male | <65 | I/II | Unknown | Unknown | SD |
| ARHGEF35 | SNV | Missense_Mutation | novel | c.1273G>A | p.Ala425Thr | p.A425T | A5YM69 | protein_coding | tolerated(0.44) | benign(0.006) | TCGA-F5-6814-01 | Colorectum | rectum adenocarcinoma | Male | <65 | I/II | Unknown | Unknown | SD |
| ARHGEF35 | SNV | Missense_Mutation | novel | c.841N>T | p.Asp281Tyr | p.D281Y | A5YM69 | protein_coding | deleterious(0) | possibly_damaging(0.629) | TCGA-AP-A0LM-01 | Endometrium | uterine corpus endometrioid carcinoma | Female | <65 | III/IV | Chemotherapy | cisplatin | SD |
| ARHGEF35 | SNV | Missense_Mutation | c.1098G>T | p.Glu366Asp | p.E366D | A5YM69 | protein_coding | tolerated(0.15) | benign(0.041) | TCGA-AX-A05Z-01 | Endometrium | uterine corpus endometrioid carcinoma | Female | <65 | III/IV | Chemotherapy | adriamycin | SD | |
| ARHGEF35 | SNV | Missense_Mutation | rs553072768 | c.1285N>A | p.Val429Met | p.V429M | A5YM69 | protein_coding | tolerated(1) | benign(0.01) | TCGA-AX-A2HD-01 | Endometrium | uterine corpus endometrioid carcinoma | Female | >=65 | III/IV | Unknown | Unknown | SD |
| ARHGEF35 | SNV | Missense_Mutation | c.1259A>G | p.Asp420Gly | p.D420G | A5YM69 | protein_coding | deleterious(0.01) | possibly_damaging(0.59) | TCGA-B5-A11E-01 | Endometrium | uterine corpus endometrioid carcinoma | Female | <65 | I/II | Unknown | Unknown | SD |
| Page: 1 2 3 4 |
Top |
Related drugs of malignant transformation related genes |
| Identification of chemicals and drugs interact with genes involved in malignant transfromation |
| (DGIdb 4.0) |
| Entrez ID | Symbol | Category | Interaction Types | Drug Claim Name | Drug Name | PMIDs |
| Page: 1 |

Copyright 2023-Present -The University of Texas Health Science Center at Houston |