
|
|||||
|
 | |
| |
| |
| |
| |
| |
|
Gene: ARHGEF3 |
Gene summary for ARHGEF3 |
| Gene information | Species | Human | Gene symbol | ARHGEF3 | Gene ID | 50650 |
| Gene name | Rho guanine nucleotide exchange factor 3 | |
| Gene Alias | GEF3 | |
| Cytomap | 3p14.3 | |
| Gene Type | protein-coding | GO ID | GO:0007154 | UniProtAcc | Q9NR81 |
Top |
Malignant transformation analysis |
| Identification of the aberrant gene expression in precancerous and cancerous lesions by comparing the gene expression of stem-like cells in diseased tissues with normal stem cells |
| Entrez ID | Symbol | Replicates | Species | Organ | Tissue | Adj P-value | Log2FC | Malignancy |
| 50650 | ARHGEF3 | CCI_1 | Human | Cervix | CC | 1.17e-06 | 7.96e-01 | 0.528 |
| 50650 | ARHGEF3 | CCI_2 | Human | Cervix | CC | 2.33e-12 | 1.38e+00 | 0.5249 |
| 50650 | ARHGEF3 | CCI_3 | Human | Cervix | CC | 7.63e-16 | 1.09e+00 | 0.516 |
| 50650 | ARHGEF3 | HTA11_3410_2000001011 | Human | Colorectum | AD | 3.00e-02 | -2.09e-01 | 0.0155 |
| 50650 | ARHGEF3 | HTA11_1391_2000001011 | Human | Colorectum | AD | 1.04e-05 | 5.47e-01 | -0.059 |
| 50650 | ARHGEF3 | A015-C-203 | Human | Colorectum | FAP | 5.08e-18 | -4.67e-01 | -0.1294 |
| 50650 | ARHGEF3 | A002-C-201 | Human | Colorectum | FAP | 1.85e-04 | -2.25e-01 | 0.0324 |
| 50650 | ARHGEF3 | A001-C-108 | Human | Colorectum | FAP | 4.16e-02 | -6.91e-02 | -0.0272 |
| 50650 | ARHGEF3 | A002-C-021 | Human | Colorectum | FAP | 2.91e-02 | 2.92e-01 | 0.1171 |
| 50650 | ARHGEF3 | A002-C-205 | Human | Colorectum | FAP | 3.72e-13 | -4.26e-01 | -0.1236 |
| 50650 | ARHGEF3 | A015-C-006 | Human | Colorectum | FAP | 1.20e-05 | -3.20e-01 | -0.0994 |
| 50650 | ARHGEF3 | A015-C-106 | Human | Colorectum | FAP | 3.53e-02 | -1.06e-01 | -0.0511 |
| 50650 | ARHGEF3 | A002-C-114 | Human | Colorectum | FAP | 6.11e-09 | -3.80e-01 | -0.1561 |
| 50650 | ARHGEF3 | A015-C-104 | Human | Colorectum | FAP | 1.36e-16 | -4.76e-01 | -0.1899 |
| 50650 | ARHGEF3 | A015-C-202 | Human | Colorectum | FAP | 4.19e-02 | -4.01e-01 | -0.0849 |
| 50650 | ARHGEF3 | A001-C-014 | Human | Colorectum | FAP | 1.24e-02 | -5.66e-02 | 0.0135 |
| 50650 | ARHGEF3 | A002-C-016 | Human | Colorectum | FAP | 1.42e-10 | -2.87e-01 | 0.0521 |
| 50650 | ARHGEF3 | A015-C-002 | Human | Colorectum | FAP | 2.71e-03 | -2.23e-01 | -0.0763 |
| 50650 | ARHGEF3 | A001-C-203 | Human | Colorectum | FAP | 9.52e-04 | -1.09e-01 | -0.0481 |
| 50650 | ARHGEF3 | A002-C-116 | Human | Colorectum | FAP | 1.28e-17 | -2.90e-01 | -0.0452 |
| Page: 1 2 3 4 5 6 |
| Tissue | Expression Dynamics | Abbreviation |
| Cervix |  | CC: Cervix cancer |
| HSIL_HPV: HPV-infected high-grade squamous intraepithelial lesions | ||
| N_HPV: HPV-infected normal cervix | ||
| Colorectum (GSE201348) |  | FAP: Familial adenomatous polyposis |
| CRC: Colorectal cancer | ||
| Colorectum (HTA11) |  | AD: Adenomas |
| SER: Sessile serrated lesions | ||
| MSI-H: Microsatellite-high colorectal cancer | ||
| MSS: Microsatellite stable colorectal cancer | ||
| Endometrium | 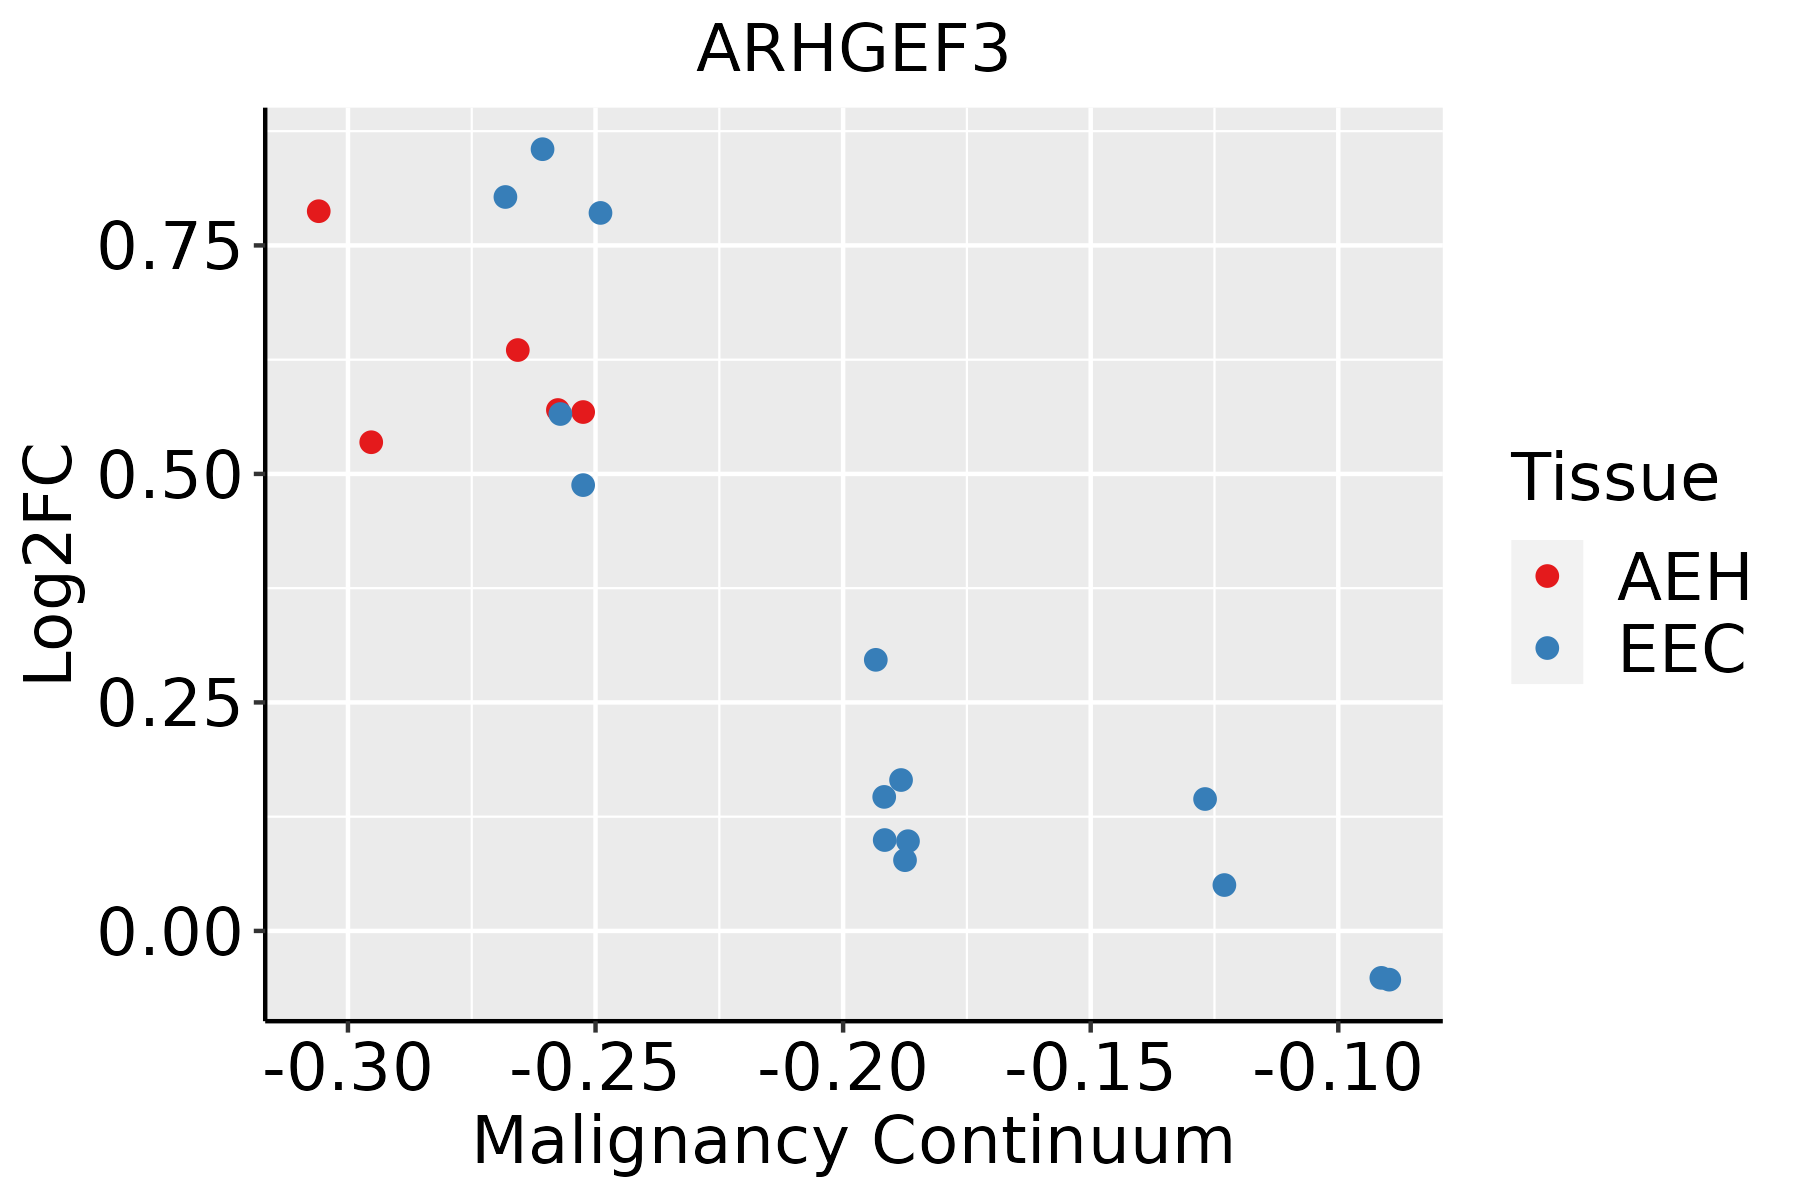 | AEH: Atypical endometrial hyperplasia |
| EEC: Endometrioid Cancer | ||
| Esophagus | 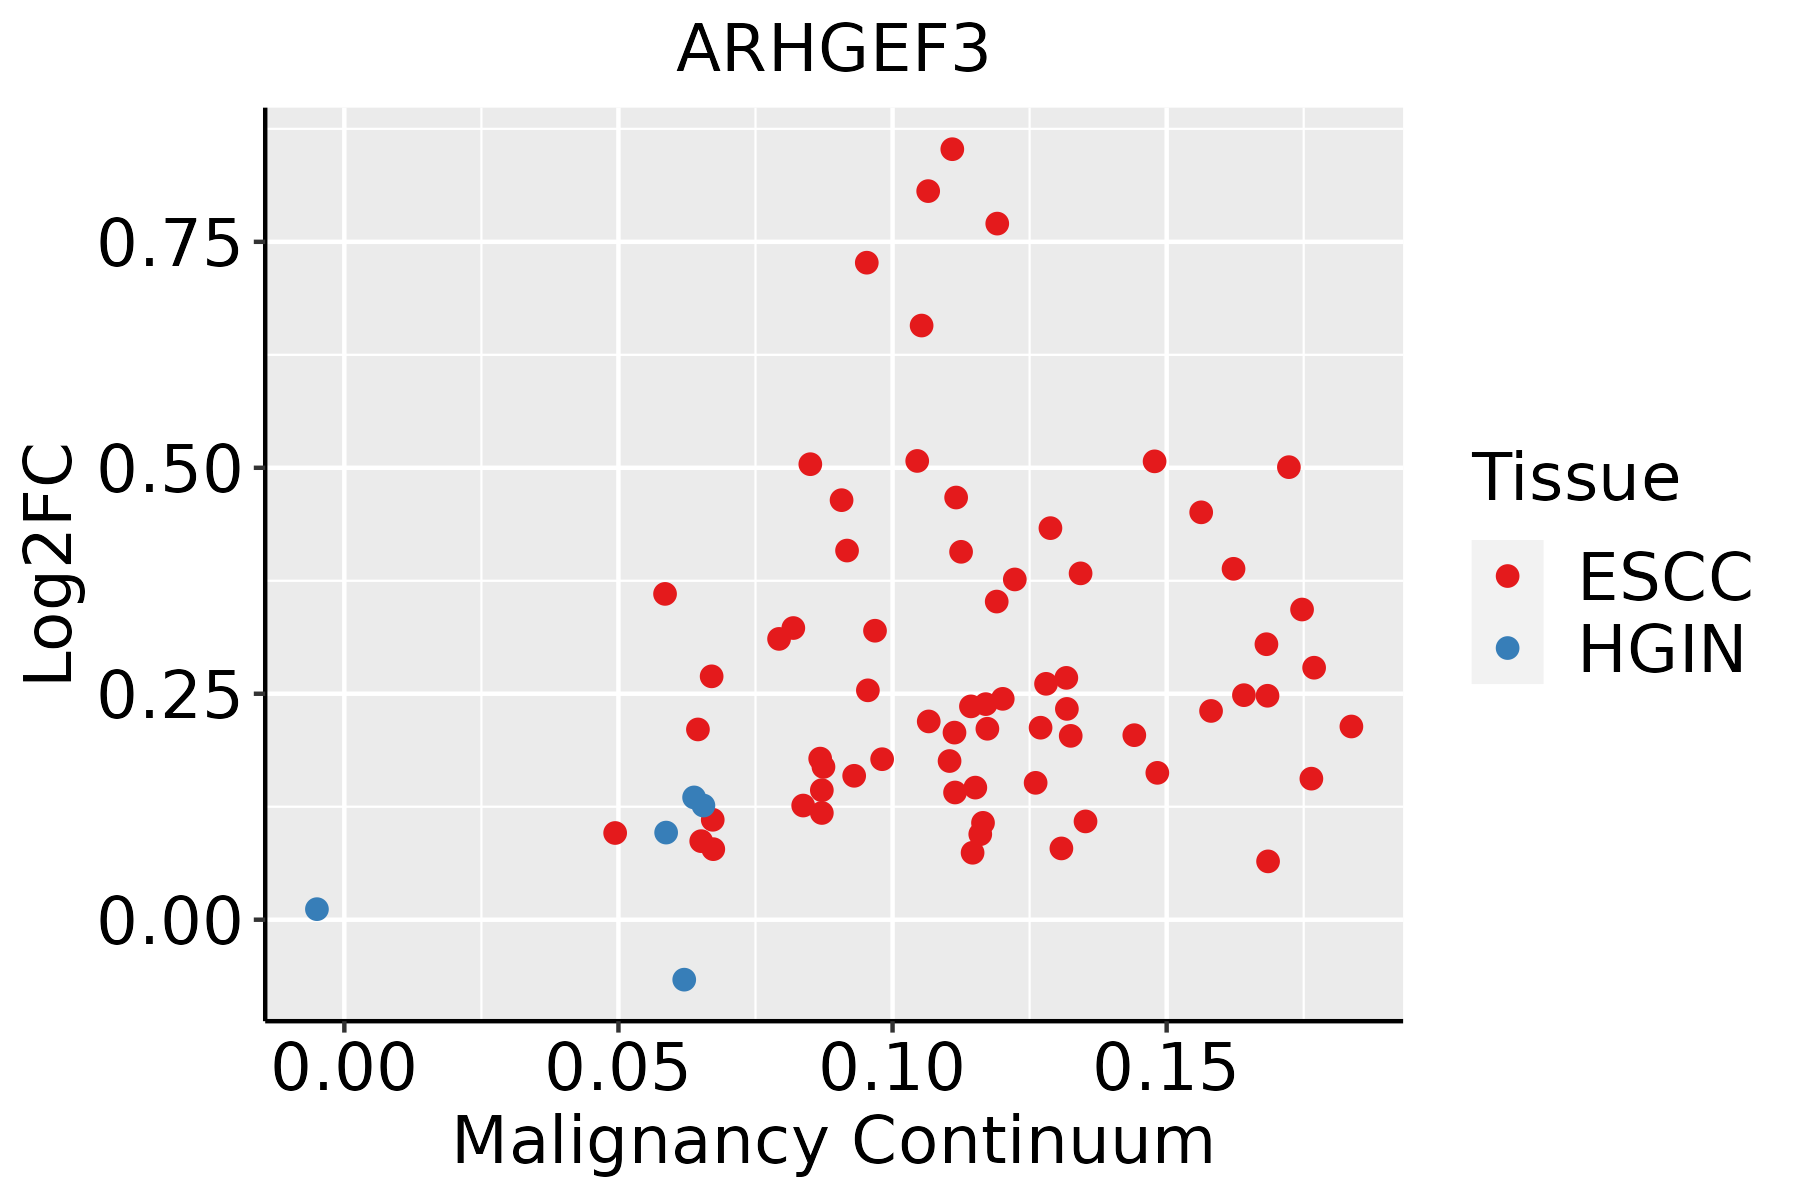 | ESCC: Esophageal squamous cell carcinoma |
| HGIN: High-grade intraepithelial neoplasias | ||
| LGIN: Low-grade intraepithelial neoplasias | ||
| Lung |  | AAH: Atypical adenomatous hyperplasia |
| AIS: Adenocarcinoma in situ | ||
| IAC: Invasive lung adenocarcinoma | ||
| MIA: Minimally invasive adenocarcinoma |
| ∗log2FC in expression of this searched gene in stem-like cells from each diseased tissue sample relative to stem-like cells in normal samples in each tissue plotted against the malignancy continuum. Samples are colored based on if they are from different disease stage. |
Top |
Malignant transformation related pathway analysis |
| Find out the enriched GO biological processes and KEGG pathways involved in transition from healthy to precancer to cancer |
| Tissue | Disease Stage | Enriched GO biological Processes |
| Colorectum | AD |  |
| Colorectum | SER |  |
| Colorectum | MSS |  |
| Colorectum | MSI-H |  |
| Colorectum | FAP |  |
| ∗Top 15 enriched GO BP terms are showed in the bar plot of each disease state in each tissue. Each row represents a significant GO biological process which is colored according to the -log10(p.adjust). |
| Page: 1 2 3 4 5 6 7 8 9 |
| GO ID | Tissue | Disease Stage | Description | Gene Ratio | Bg Ratio | pvalue | p.adjust | Count |
| GO:00510566 | Cervix | CC | regulation of small GTPase mediated signal transduction | 75/2311 | 302/18723 | 1.54e-09 | 1.74e-07 | 75 |
| GO:00072656 | Cervix | CC | Ras protein signal transduction | 79/2311 | 337/18723 | 9.49e-09 | 7.77e-07 | 79 |
| GO:00072666 | Cervix | CC | Rho protein signal transduction | 35/2311 | 137/18723 | 1.77e-05 | 3.33e-04 | 35 |
| GO:00465785 | Cervix | CC | regulation of Ras protein signal transduction | 44/2311 | 189/18723 | 2.05e-05 | 3.73e-04 | 44 |
| GO:00350235 | Cervix | CC | regulation of Rho protein signal transduction | 22/2311 | 86/18723 | 5.93e-04 | 5.60e-03 | 22 |
| GO:0007265 | Colorectum | AD | Ras protein signal transduction | 104/3918 | 337/18723 | 1.01e-05 | 2.35e-04 | 104 |
| GO:0051056 | Colorectum | AD | regulation of small GTPase mediated signal transduction | 94/3918 | 302/18723 | 1.81e-05 | 3.76e-04 | 94 |
| GO:0046578 | Colorectum | AD | regulation of Ras protein signal transduction | 56/3918 | 189/18723 | 2.85e-03 | 2.14e-02 | 56 |
| GO:0007266 | Colorectum | AD | Rho protein signal transduction | 42/3918 | 137/18723 | 4.64e-03 | 3.16e-02 | 42 |
| GO:00510562 | Colorectum | FAP | regulation of small GTPase mediated signal transduction | 78/2622 | 302/18723 | 3.25e-08 | 2.85e-06 | 78 |
| GO:00072652 | Colorectum | FAP | Ras protein signal transduction | 80/2622 | 337/18723 | 9.61e-07 | 4.33e-05 | 80 |
| GO:00465781 | Colorectum | FAP | regulation of Ras protein signal transduction | 47/2622 | 189/18723 | 4.67e-05 | 9.60e-04 | 47 |
| GO:00072661 | Colorectum | FAP | Rho protein signal transduction | 34/2622 | 137/18723 | 5.11e-04 | 5.82e-03 | 34 |
| GO:0035023 | Colorectum | FAP | regulation of Rho protein signal transduction | 22/2622 | 86/18723 | 3.11e-03 | 2.33e-02 | 22 |
| GO:00510567 | Endometrium | AEH | regulation of small GTPase mediated signal transduction | 59/2100 | 302/18723 | 1.43e-05 | 3.03e-04 | 59 |
| GO:00072657 | Endometrium | AEH | Ras protein signal transduction | 63/2100 | 337/18723 | 3.09e-05 | 5.66e-04 | 63 |
| GO:00465786 | Endometrium | AEH | regulation of Ras protein signal transduction | 36/2100 | 189/18723 | 1.01e-03 | 8.97e-03 | 36 |
| GO:00072667 | Endometrium | AEH | Rho protein signal transduction | 28/2100 | 137/18723 | 1.17e-03 | 1.01e-02 | 28 |
| GO:00350236 | Endometrium | AEH | regulation of Rho protein signal transduction | 18/2100 | 86/18723 | 6.39e-03 | 3.79e-02 | 18 |
| GO:005105612 | Endometrium | EEC | regulation of small GTPase mediated signal transduction | 61/2168 | 302/18723 | 9.42e-06 | 2.08e-04 | 61 |
| Page: 1 2 |
| Pathway ID | Tissue | Disease Stage | Description | Gene Ratio | Bg Ratio | pvalue | p.adjust | qvalue | Count |
| Page: 1 |
Top |
Cell-cell communication analysis |
| Identification of potential cell-cell interactions between two cell types and their ligand-receptor pairs for different disease states |
| Ligand | Receptor | LRpair | Pathway | Tissue | Disease Stage |
| Page: 1 |
Top |
Single-cell gene regulatory network inference analysis |
| Find out the significant the regulons (TFs) and the target genes of each regulon across cell types for different disease states |
| TF | Cell Type | Tissue | Disease Stage | Target Gene | RSS | Regulon Activity |
| ∗The dot plots of a searched regulon are shown for all cell subpopulations in each disease state of each tissue based on the regulon specific score inferred using pySCENIC and by calculating the average expression. |
| Page: 1 |
Top |
Somatic mutation of malignant transformation related genes |
| Annotation of somatic variants for genes involved in malignant transformation |
| Hugo Symbol | Variant Class | Variant Classification | dbSNP RS | HGVSc | HGVSp | HGVSp Short | SWISSPROT | BIOTYPE | SIFT | PolyPhen | Tumor Sample Barcode | Tissue | Histology | Sex | Age | Stage | Therapy Types | Drugs | Outcome |
| ARHGEF3 | SNV | Missense_Mutation | c.999N>G | p.Ile333Met | p.I333M | Q9NR81 | protein_coding | deleterious(0.02) | possibly_damaging(0.537) | TCGA-AC-A23H-01 | Breast | breast invasive carcinoma | Female | >=65 | I/II | Unknown | Unknown | PD | |
| ARHGEF3 | SNV | Missense_Mutation | rs372602142 | c.794N>A | p.Arg265Gln | p.R265Q | Q9NR81 | protein_coding | tolerated(0.07) | possibly_damaging(0.552) | TCGA-AR-A1AI-01 | Breast | breast invasive carcinoma | Female | <65 | I/II | Chemotherapy | cytoxan | PD |
| ARHGEF3 | insertion | Nonsense_Mutation | novel | c.154_155insTATAGAAGATAAATCTACCCCATTACCACCAACATGGCCGATCCC | p.Asp52delinsValTerLysIleAsnLeuProHisTyrHisGlnHisGlyArgSerHis | p.D52delinsV*KINLPHYHQHGRSH | Q9NR81 | protein_coding | TCGA-A8-A07R-01 | Breast | breast invasive carcinoma | Female | >=65 | III/IV | Ancillary | zoledronic | SD | ||
| ARHGEF3 | SNV | Missense_Mutation | rs768543223 | c.370G>A | p.Ala124Thr | p.A124T | Q9NR81 | protein_coding | tolerated(0.27) | benign(0.092) | TCGA-A6-6653-01 | Colorectum | colon adenocarcinoma | Male | >=65 | I/II | Unknown | Unknown | SD |
| ARHGEF3 | SNV | Missense_Mutation | c.1421N>G | p.Asn474Ser | p.N474S | Q9NR81 | protein_coding | tolerated(0.17) | benign(0.054) | TCGA-AA-3663-01 | Colorectum | colon adenocarcinoma | Male | <65 | I/II | Unknown | Unknown | SD | |
| ARHGEF3 | SNV | Missense_Mutation | c.1387G>A | p.Ala463Thr | p.A463T | Q9NR81 | protein_coding | deleterious(0.03) | possibly_damaging(0.905) | TCGA-AA-3976-01 | Colorectum | colon adenocarcinoma | Male | >=65 | III/IV | Chemotherapy | folinic | CR | |
| ARHGEF3 | SNV | Missense_Mutation | novel | c.1525N>A | p.Leu509Ile | p.L509I | Q9NR81 | protein_coding | tolerated_low_confidence(0.39) | benign(0.075) | TCGA-AA-3977-01 | Colorectum | colon adenocarcinoma | Male | >=65 | I/II | Unknown | Unknown | SD |
| ARHGEF3 | SNV | Missense_Mutation | rs776506559 | c.1129N>T | p.Arg377Trp | p.R377W | Q9NR81 | protein_coding | deleterious(0) | probably_damaging(0.988) | TCGA-AA-3977-01 | Colorectum | colon adenocarcinoma | Male | >=65 | I/II | Unknown | Unknown | SD |
| ARHGEF3 | SNV | Missense_Mutation | c.931A>C | p.Asn311His | p.N311H | Q9NR81 | protein_coding | tolerated(0.09) | possibly_damaging(0.872) | TCGA-AA-A010-01 | Colorectum | colon adenocarcinoma | Female | <65 | I/II | Chemotherapy | folinic | CR | |
| ARHGEF3 | SNV | Missense_Mutation | rs764132102 | c.317N>A | p.Arg106His | p.R106H | Q9NR81 | protein_coding | deleterious(0.01) | probably_damaging(0.983) | TCGA-AZ-4315-01 | Colorectum | colon adenocarcinoma | Male | <65 | I/II | Unknown | Unknown | SD |
| Page: 1 2 3 4 5 |
Top |
Related drugs of malignant transformation related genes |
| Identification of chemicals and drugs interact with genes involved in malignant transfromation |
| (DGIdb 4.0) |
| Entrez ID | Symbol | Category | Interaction Types | Drug Claim Name | Drug Name | PMIDs |
| Page: 1 |

Copyright 2023-Present -The University of Texas Health Science Center at Houston |