
|
|||||
|
 | |
| |
| |
| |
| |
| |
|
Gene: ARHGEF28 |
Gene summary for ARHGEF28 |
| Gene information | Species | Human | Gene symbol | ARHGEF28 | Gene ID | 64283 |
| Gene name | Rho guanine nucleotide exchange factor 28 | |
| Gene Alias | RGNEF | |
| Cytomap | 5q13.2 | |
| Gene Type | protein-coding | GO ID | GO:0000902 | UniProtAcc | Q8N1W1 |
Top |
Malignant transformation analysis |
| Identification of the aberrant gene expression in precancerous and cancerous lesions by comparing the gene expression of stem-like cells in diseased tissues with normal stem cells |
| Entrez ID | Symbol | Replicates | Species | Organ | Tissue | Adj P-value | Log2FC | Malignancy |
| 64283 | ARHGEF28 | CA_HPV_3 | Human | Cervix | CC | 2.64e-03 | 7.86e-02 | 0.0414 |
| 64283 | ARHGEF28 | HSIL_HPV_2 | Human | Cervix | HSIL_HPV | 2.25e-02 | 1.37e-01 | 0.0208 |
| 64283 | ARHGEF28 | CCI_1 | Human | Cervix | CC | 8.05e-03 | 8.18e-01 | 0.528 |
| 64283 | ARHGEF28 | CCI_2 | Human | Cervix | CC | 2.93e-14 | 1.42e+00 | 0.5249 |
| 64283 | ARHGEF28 | CCI_3 | Human | Cervix | CC | 5.27e-27 | 1.29e+00 | 0.516 |
| 64283 | ARHGEF28 | LZE24T | Human | Esophagus | ESCC | 1.63e-11 | 4.21e-01 | 0.0596 |
| 64283 | ARHGEF28 | P1T-E | Human | Esophagus | ESCC | 3.68e-05 | 3.74e-01 | 0.0875 |
| 64283 | ARHGEF28 | P2T-E | Human | Esophagus | ESCC | 2.35e-24 | 5.02e-01 | 0.1177 |
| 64283 | ARHGEF28 | P4T-E | Human | Esophagus | ESCC | 1.38e-04 | 1.13e-01 | 0.1323 |
| 64283 | ARHGEF28 | P8T-E | Human | Esophagus | ESCC | 1.47e-06 | 1.28e-01 | 0.0889 |
| 64283 | ARHGEF28 | P9T-E | Human | Esophagus | ESCC | 2.31e-03 | 7.82e-02 | 0.1131 |
| 64283 | ARHGEF28 | P10T-E | Human | Esophagus | ESCC | 8.67e-07 | 1.55e-01 | 0.116 |
| 64283 | ARHGEF28 | P12T-E | Human | Esophagus | ESCC | 2.75e-20 | 3.73e-01 | 0.1122 |
| 64283 | ARHGEF28 | P15T-E | Human | Esophagus | ESCC | 6.37e-20 | 4.24e-01 | 0.1149 |
| 64283 | ARHGEF28 | P16T-E | Human | Esophagus | ESCC | 4.84e-08 | 1.29e-01 | 0.1153 |
| 64283 | ARHGEF28 | P20T-E | Human | Esophagus | ESCC | 4.15e-09 | 3.49e-01 | 0.1124 |
| 64283 | ARHGEF28 | P21T-E | Human | Esophagus | ESCC | 4.51e-15 | 2.53e-01 | 0.1617 |
| 64283 | ARHGEF28 | P22T-E | Human | Esophagus | ESCC | 5.73e-06 | 5.78e-02 | 0.1236 |
| 64283 | ARHGEF28 | P23T-E | Human | Esophagus | ESCC | 3.67e-12 | 2.33e-01 | 0.108 |
| 64283 | ARHGEF28 | P26T-E | Human | Esophagus | ESCC | 3.63e-17 | 3.55e-01 | 0.1276 |
| Page: 1 2 3 4 5 |
| Tissue | Expression Dynamics | Abbreviation |
| Cervix | 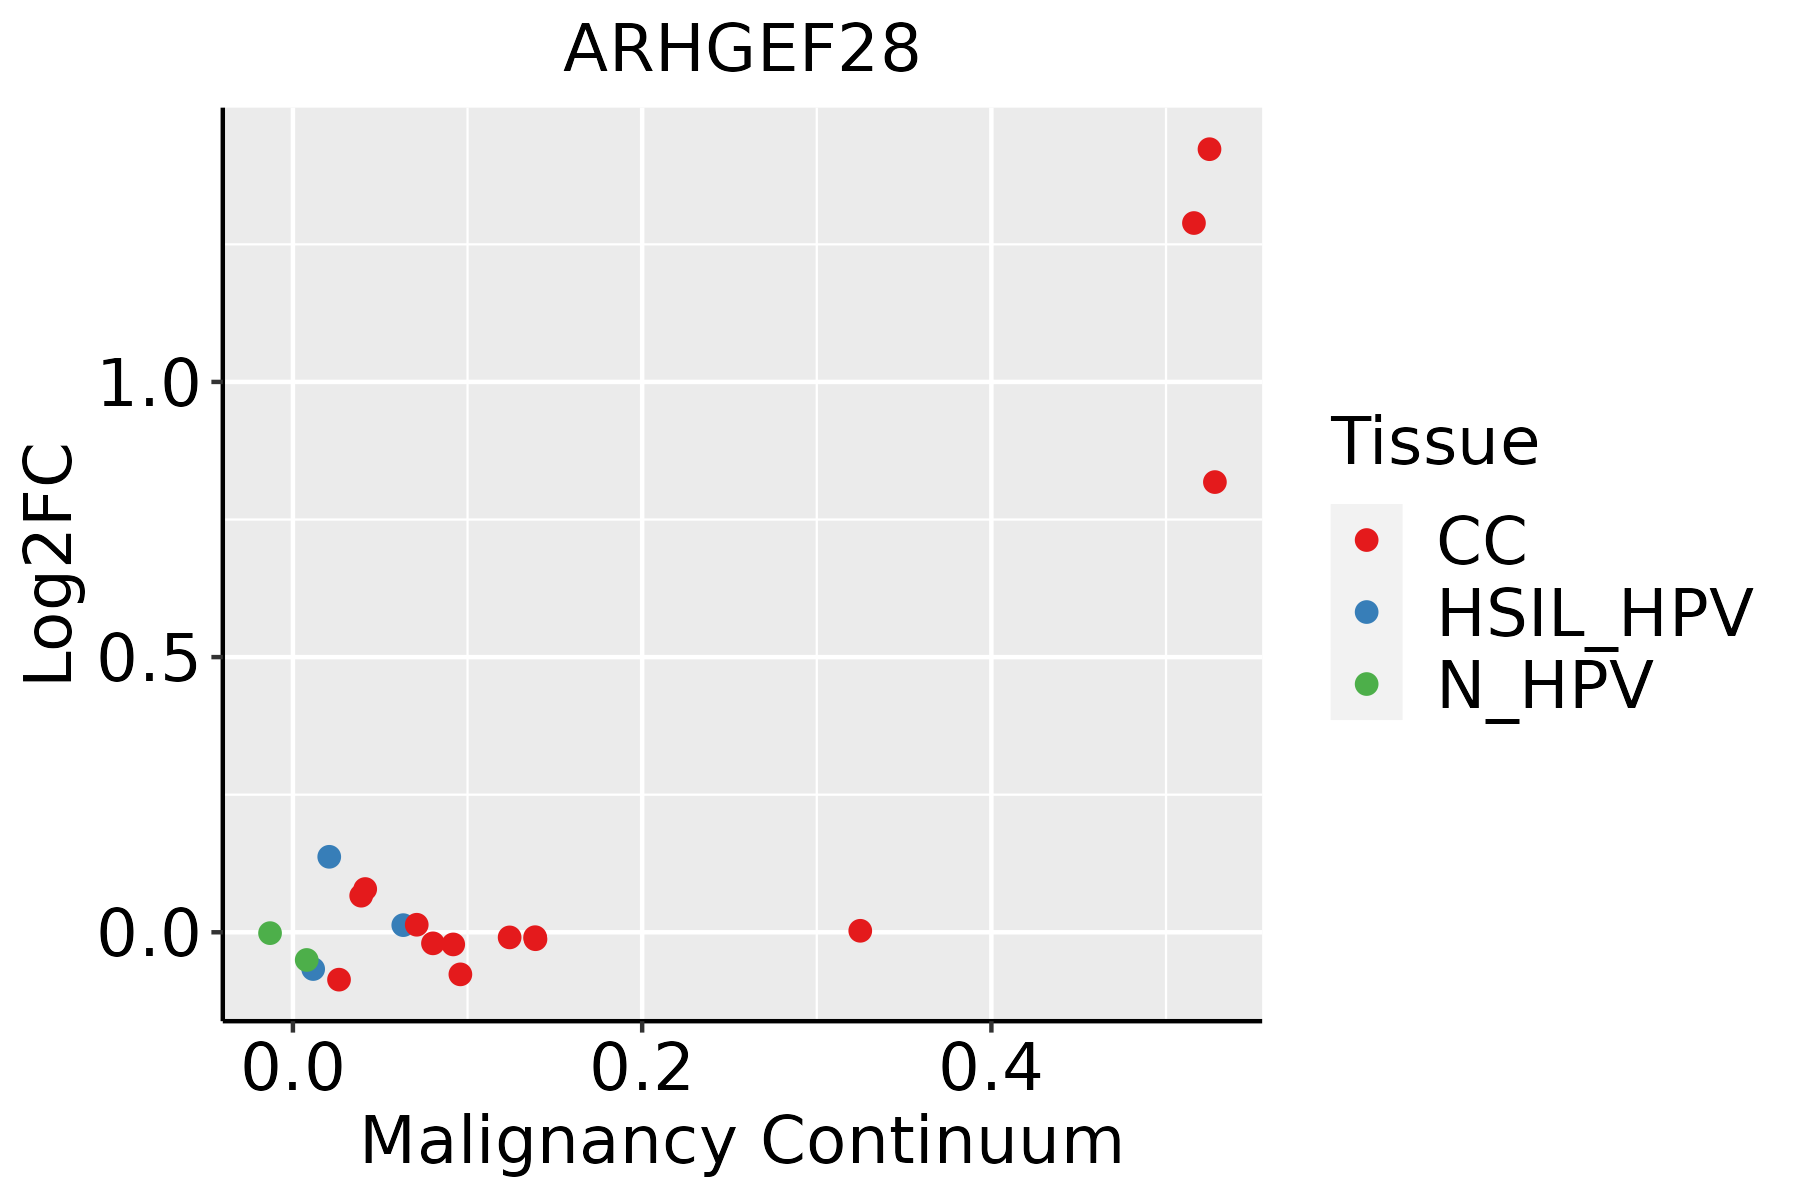 | CC: Cervix cancer |
| HSIL_HPV: HPV-infected high-grade squamous intraepithelial lesions | ||
| N_HPV: HPV-infected normal cervix | ||
| Esophagus | 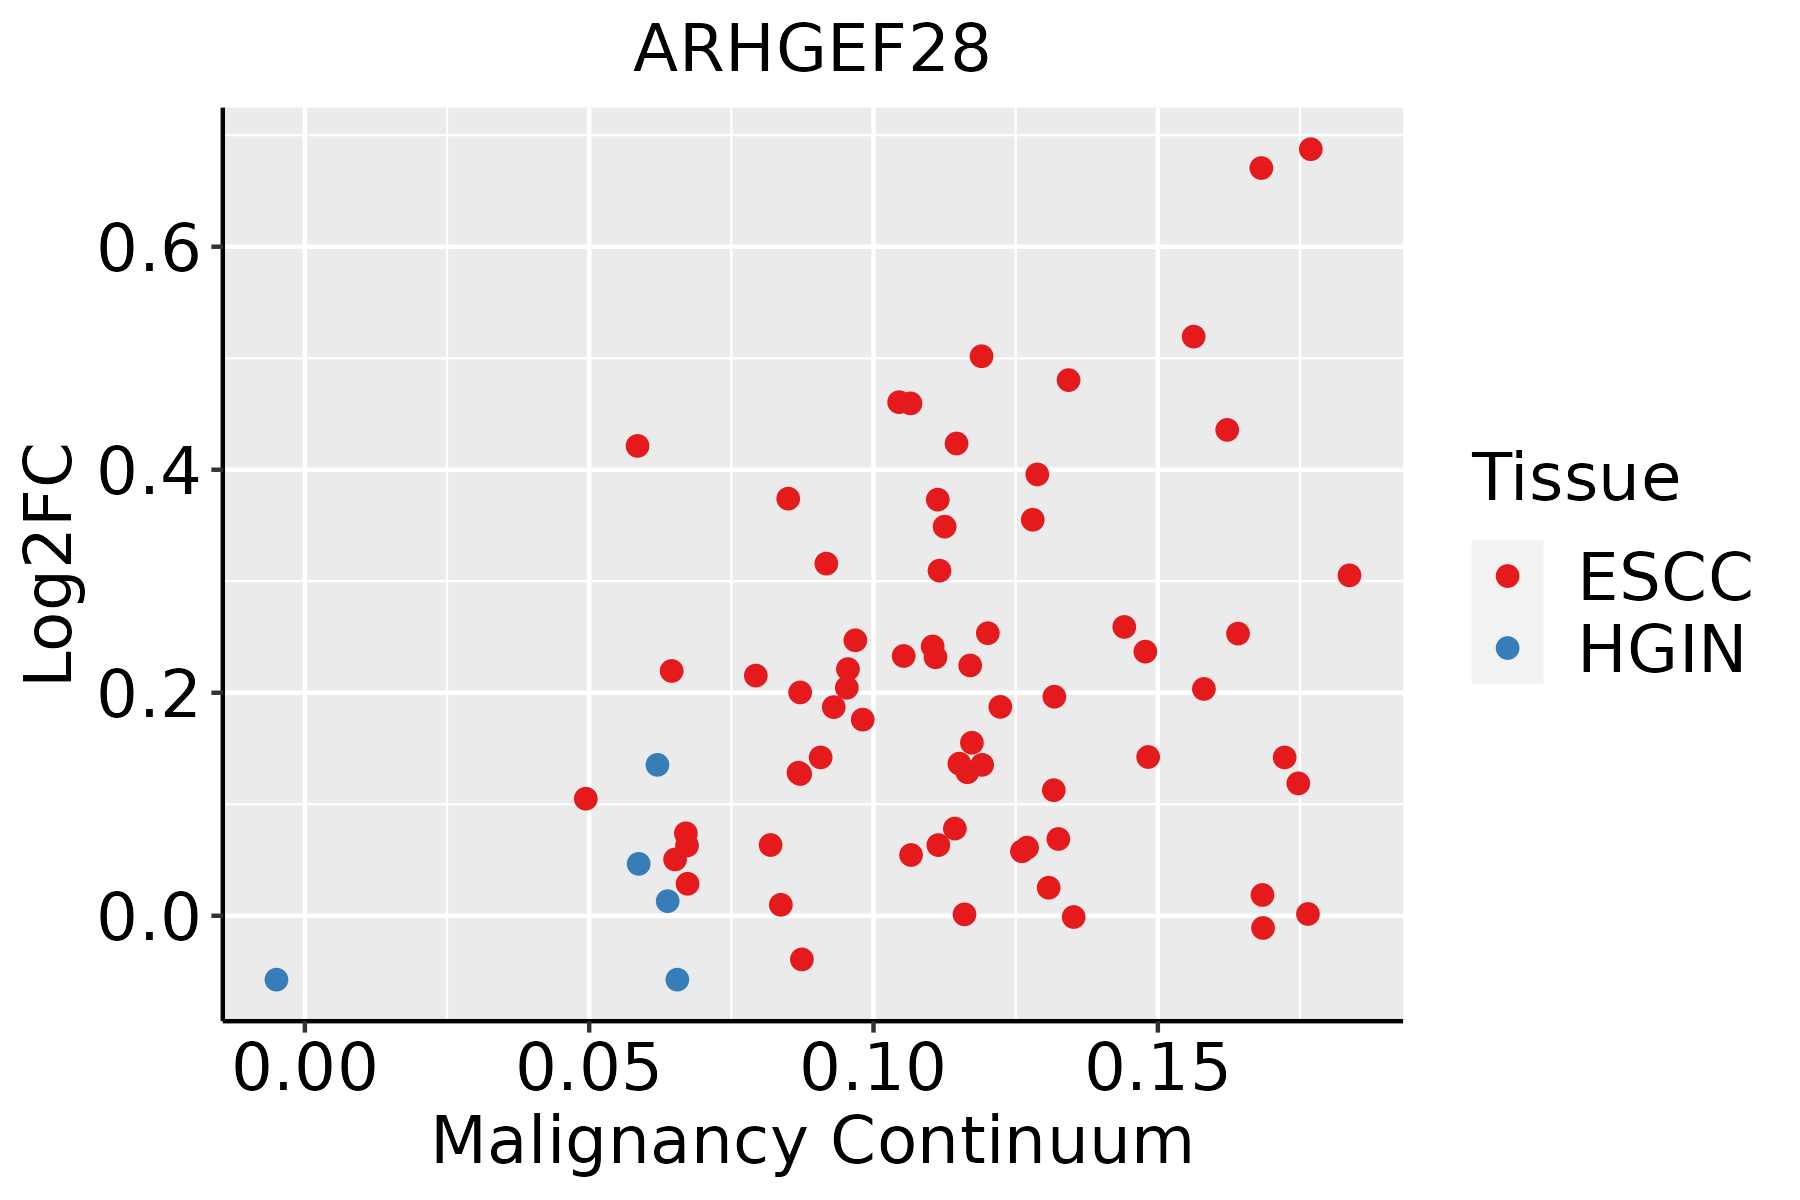 | ESCC: Esophageal squamous cell carcinoma |
| HGIN: High-grade intraepithelial neoplasias | ||
| LGIN: Low-grade intraepithelial neoplasias | ||
| GC | 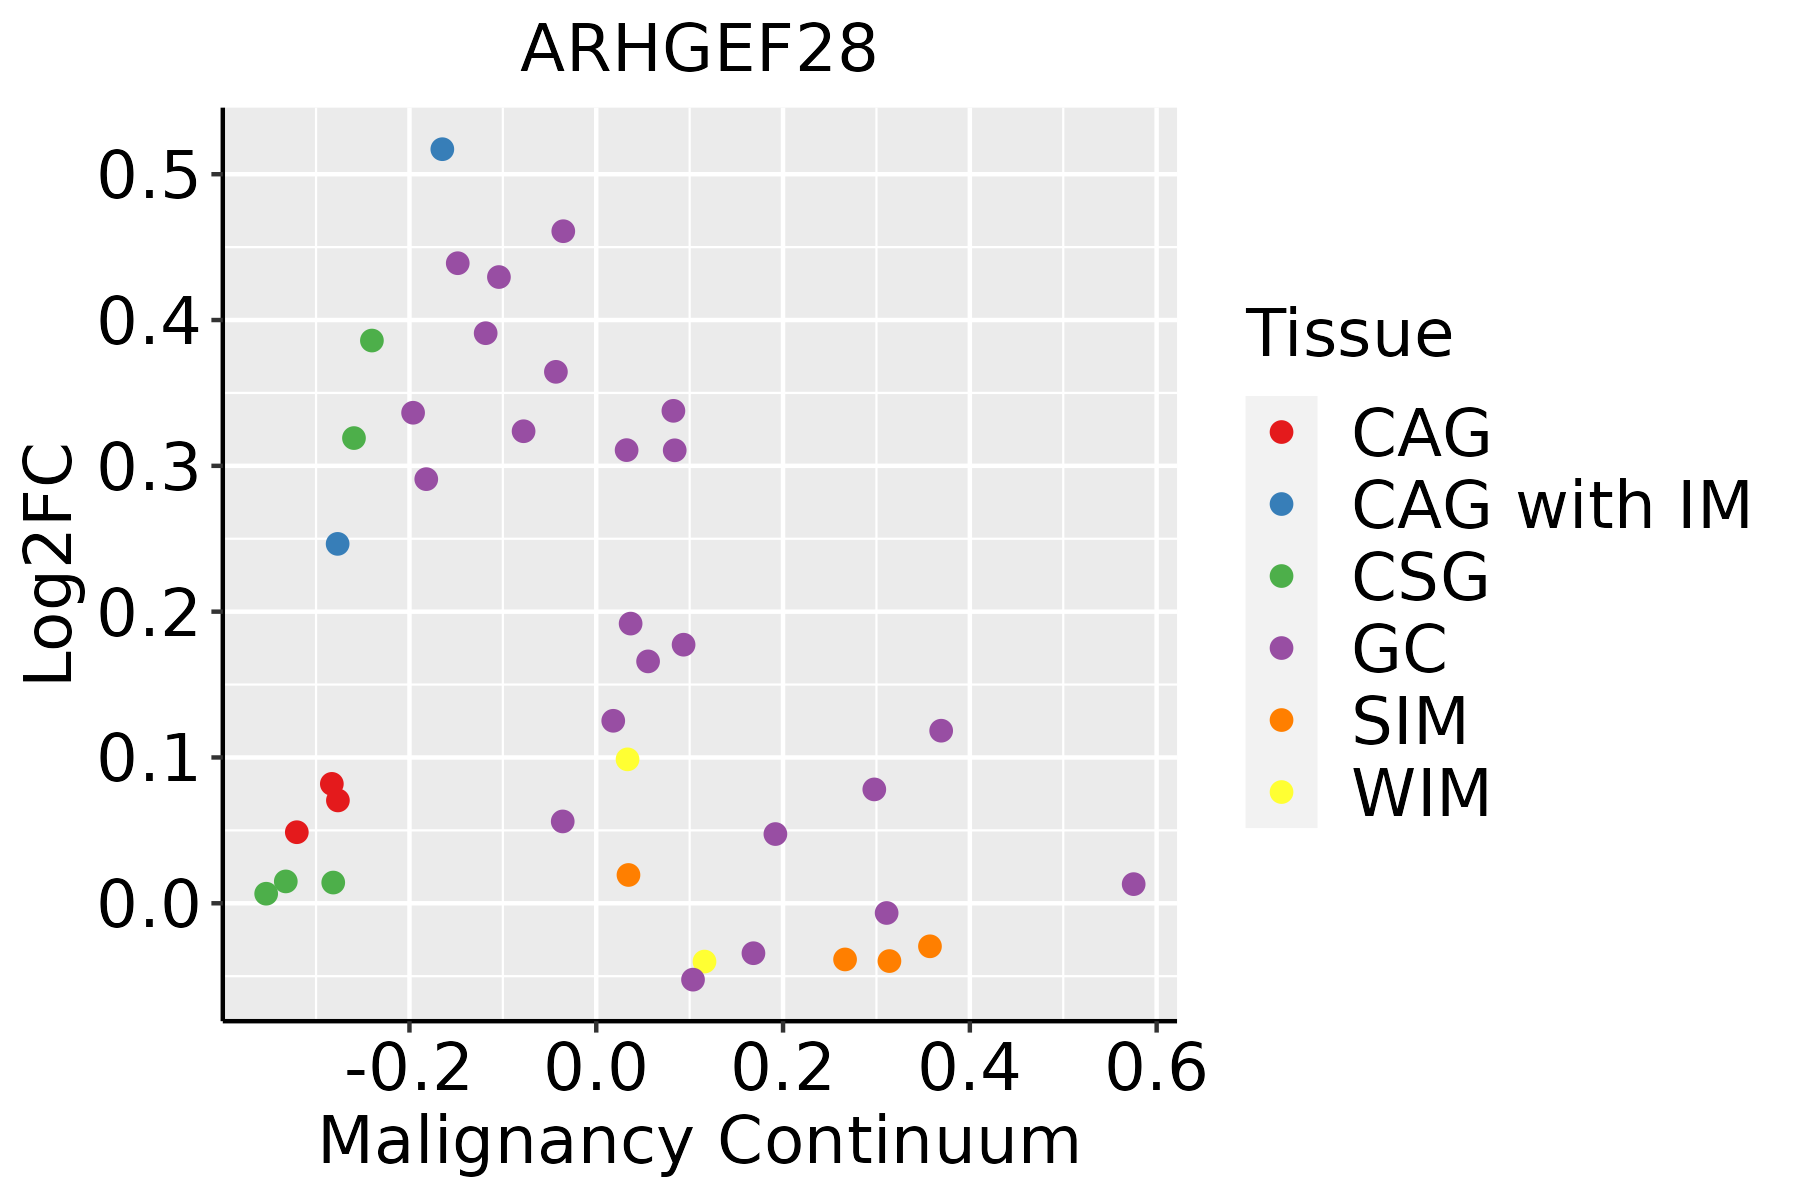 | CAG: Chronic atrophic gastritis |
| CAG with IM: Chronic atrophic gastritis with intestinal metaplasia | ||
| CSG: Chronic superficial gastritis | ||
| GC: Gastric cancer | ||
| SIM: Severe intestinal metaplasia | ||
| WIM: Wild intestinal metaplasia | ||
| Lung | 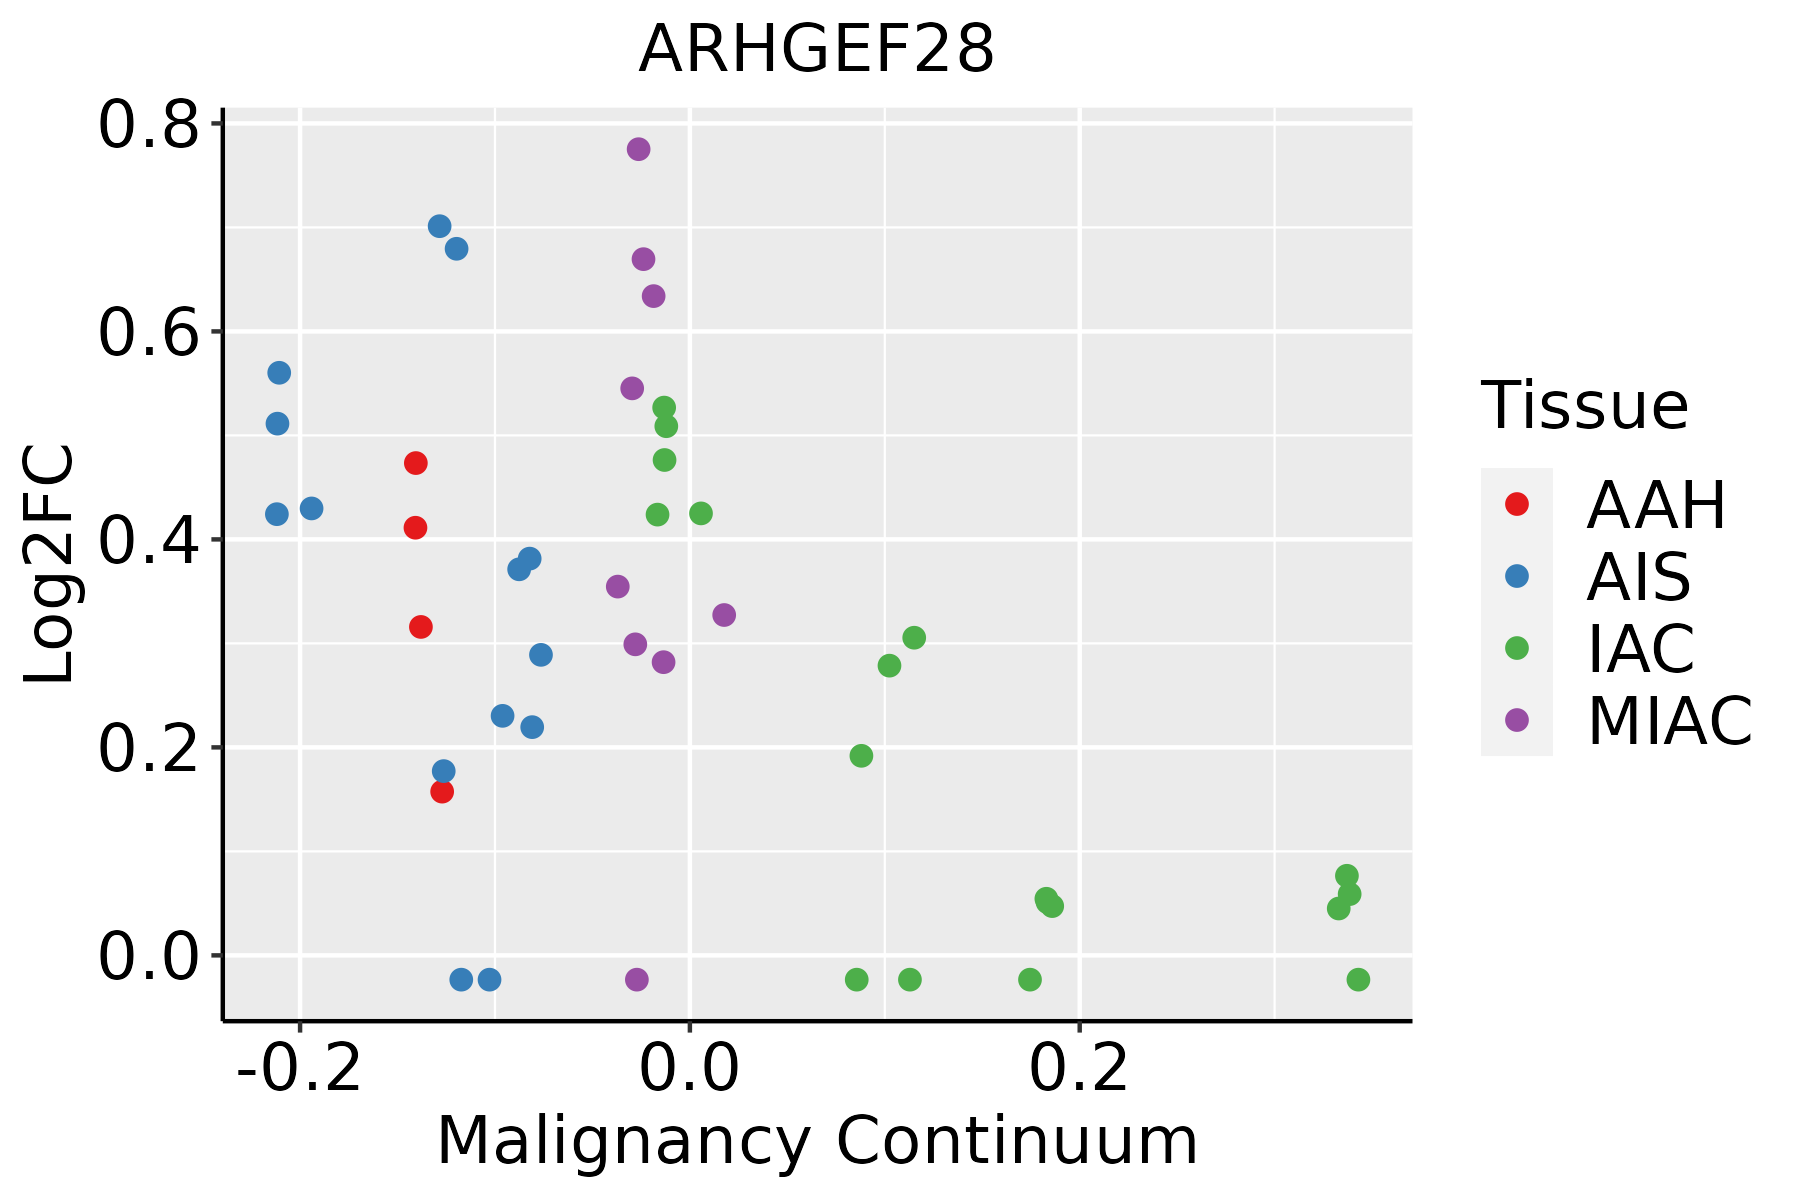 | AAH: Atypical adenomatous hyperplasia |
| AIS: Adenocarcinoma in situ | ||
| IAC: Invasive lung adenocarcinoma | ||
| MIA: Minimally invasive adenocarcinoma | ||
| Oral Cavity | 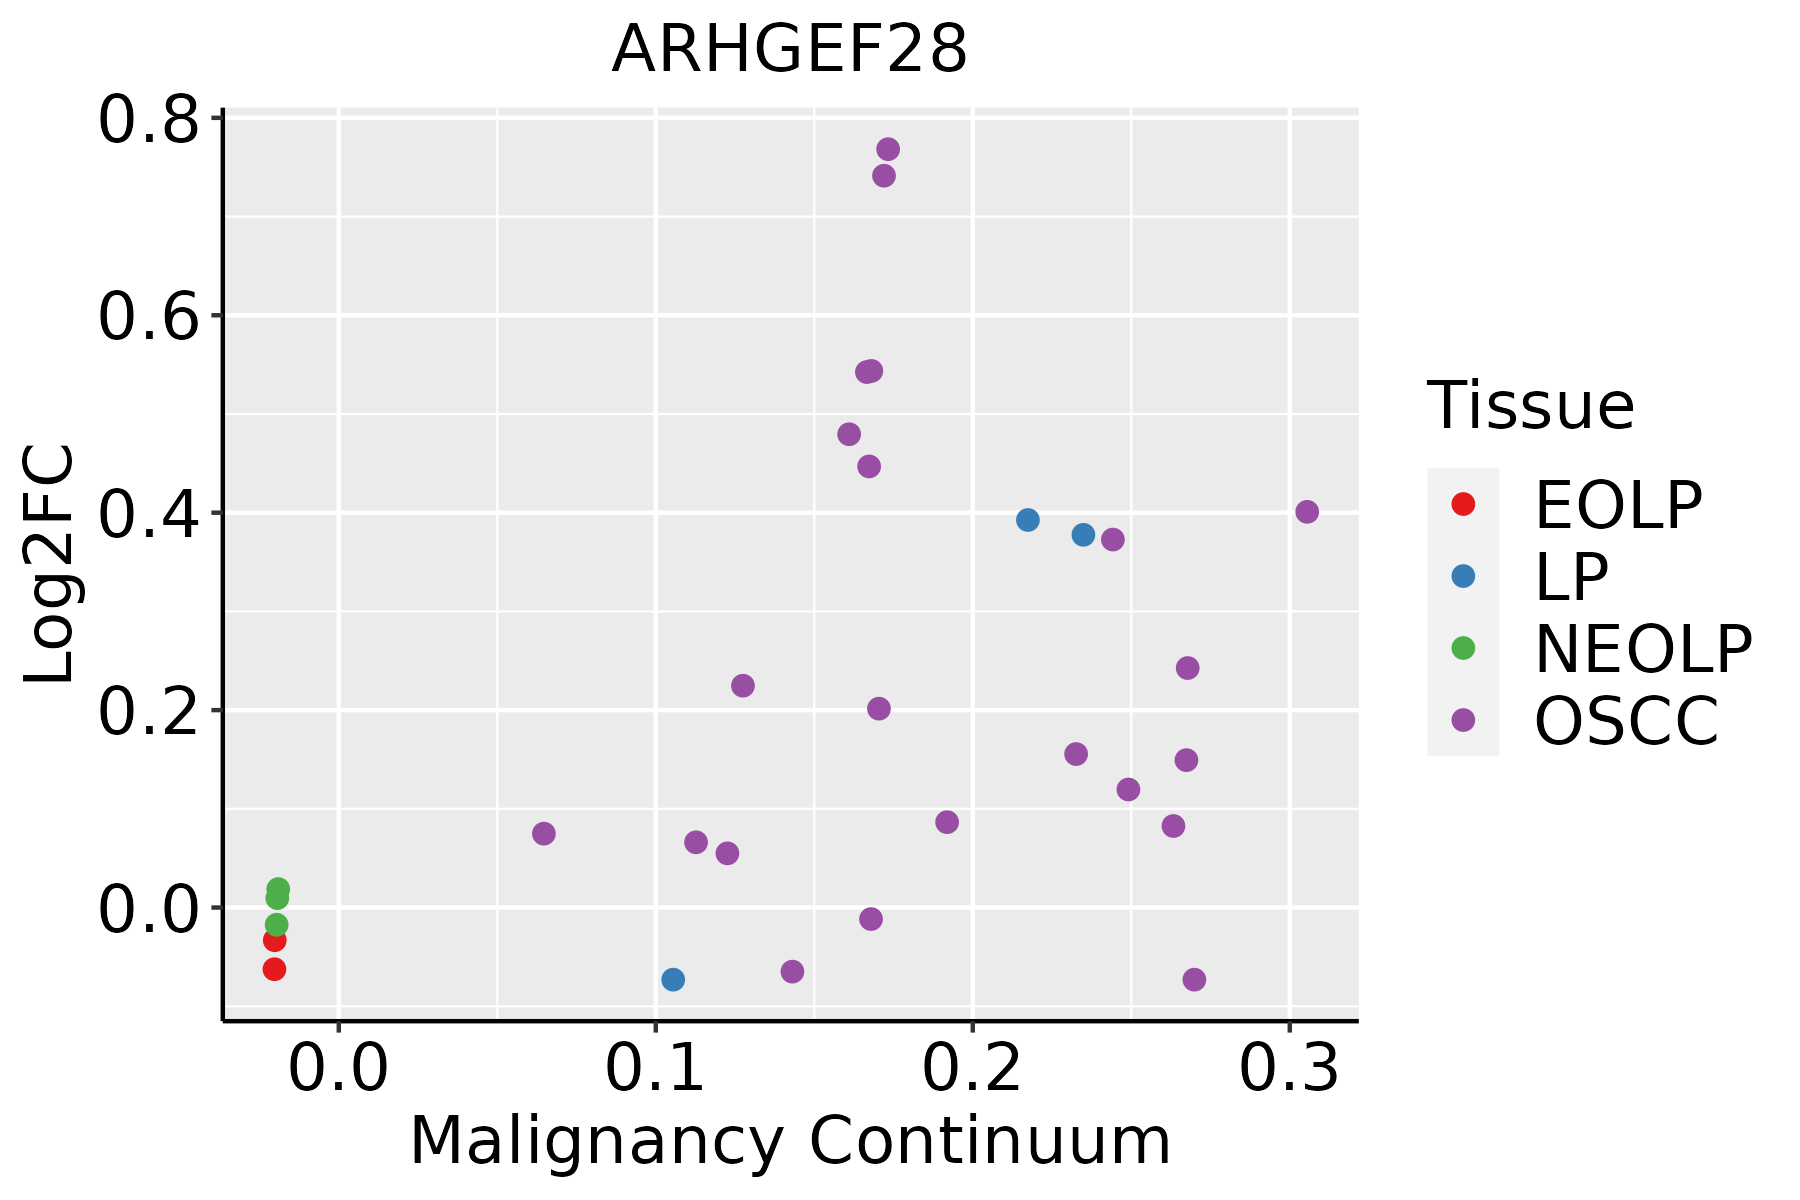 | EOLP: Erosive Oral lichen planus |
| LP: leukoplakia | ||
| NEOLP: Non-erosive oral lichen planus | ||
| OSCC: Oral squamous cell carcinoma | ||
| Prostate |  | BPH: Benign Prostatic Hyperplasia |
| ∗log2FC in expression of this searched gene in stem-like cells from each diseased tissue sample relative to stem-like cells in normal samples in each tissue plotted against the malignancy continuum. Samples are colored based on if they are from different disease stage. |
Top |
Malignant transformation related pathway analysis |
| Find out the enriched GO biological processes and KEGG pathways involved in transition from healthy to precancer to cancer |
| Tissue | Disease Stage | Enriched GO biological Processes |
| Colorectum | AD |  |
| Colorectum | SER |  |
| Colorectum | MSS |  |
| Colorectum | MSI-H |  |
| Colorectum | FAP |  |
| ∗Top 15 enriched GO BP terms are showed in the bar plot of each disease state in each tissue. Each row represents a significant GO biological process which is colored according to the -log10(p.adjust). |
| Page: 1 2 3 4 5 6 7 8 9 |
| GO ID | Tissue | Disease Stage | Description | Gene Ratio | Bg Ratio | pvalue | p.adjust | Count |
| GO:00510566 | Cervix | CC | regulation of small GTPase mediated signal transduction | 75/2311 | 302/18723 | 1.54e-09 | 1.74e-07 | 75 |
| GO:00072656 | Cervix | CC | Ras protein signal transduction | 79/2311 | 337/18723 | 9.49e-09 | 7.77e-07 | 79 |
| GO:00072666 | Cervix | CC | Rho protein signal transduction | 35/2311 | 137/18723 | 1.77e-05 | 3.33e-04 | 35 |
| GO:00465785 | Cervix | CC | regulation of Ras protein signal transduction | 44/2311 | 189/18723 | 2.05e-05 | 3.73e-04 | 44 |
| GO:00350235 | Cervix | CC | regulation of Rho protein signal transduction | 22/2311 | 86/18723 | 5.93e-04 | 5.60e-03 | 22 |
| GO:00480131 | Cervix | CC | ephrin receptor signaling pathway | 14/2311 | 51/18723 | 2.78e-03 | 1.87e-02 | 14 |
| GO:000726510 | Esophagus | ESCC | Ras protein signal transduction | 201/8552 | 337/18723 | 1.44e-07 | 2.30e-06 | 201 |
| GO:000726610 | Esophagus | ESCC | Rho protein signal transduction | 81/8552 | 137/18723 | 1.03e-03 | 5.20e-03 | 81 |
| GO:00465789 | Esophagus | ESCC | regulation of Ras protein signal transduction | 106/8552 | 189/18723 | 2.49e-03 | 1.08e-02 | 106 |
| GO:00480133 | Esophagus | ESCC | ephrin receptor signaling pathway | 33/8552 | 51/18723 | 4.77e-03 | 1.85e-02 | 33 |
| GO:005105610 | Esophagus | ESCC | regulation of small GTPase mediated signal transduction | 157/8552 | 302/18723 | 1.55e-02 | 4.98e-02 | 157 |
| GO:00510565 | Lung | IAC | regulation of small GTPase mediated signal transduction | 70/2061 | 302/18723 | 9.44e-10 | 1.87e-07 | 70 |
| GO:00072655 | Lung | IAC | Ras protein signal transduction | 65/2061 | 337/18723 | 4.48e-06 | 1.81e-04 | 65 |
| GO:00072665 | Lung | IAC | Rho protein signal transduction | 32/2061 | 137/18723 | 2.75e-05 | 7.26e-04 | 32 |
| GO:00465784 | Lung | IAC | regulation of Ras protein signal transduction | 40/2061 | 189/18723 | 3.50e-05 | 8.65e-04 | 40 |
| GO:00350234 | Lung | IAC | regulation of Rho protein signal transduction | 20/2061 | 86/18723 | 8.82e-04 | 1.11e-02 | 20 |
| GO:005105611 | Lung | AIS | regulation of small GTPase mediated signal transduction | 66/1849 | 302/18723 | 4.26e-10 | 9.53e-08 | 66 |
| GO:000726512 | Lung | AIS | Ras protein signal transduction | 60/1849 | 337/18723 | 4.68e-06 | 2.31e-04 | 60 |
| GO:004657812 | Lung | AIS | regulation of Ras protein signal transduction | 39/1849 | 189/18723 | 6.68e-06 | 2.95e-04 | 39 |
| GO:000726612 | Lung | AIS | Rho protein signal transduction | 28/1849 | 137/18723 | 1.51e-04 | 3.22e-03 | 28 |
| Page: 1 2 |
| Pathway ID | Tissue | Disease Stage | Description | Gene Ratio | Bg Ratio | pvalue | p.adjust | qvalue | Count |
| hsa0513516 | Cervix | CC | Yersinia infection | 39/1267 | 137/8465 | 3.27e-05 | 2.41e-04 | 1.42e-04 | 39 |
| hsa0513517 | Cervix | CC | Yersinia infection | 39/1267 | 137/8465 | 3.27e-05 | 2.41e-04 | 1.42e-04 | 39 |
| hsa0513526 | Esophagus | ESCC | Yersinia infection | 100/4205 | 137/8465 | 1.80e-08 | 1.59e-07 | 8.12e-08 | 100 |
| hsa05135111 | Esophagus | ESCC | Yersinia infection | 100/4205 | 137/8465 | 1.80e-08 | 1.59e-07 | 8.12e-08 | 100 |
| hsa0513514 | Lung | IAC | Yersinia infection | 32/1053 | 137/8465 | 2.63e-04 | 2.76e-03 | 1.83e-03 | 32 |
| hsa0513515 | Lung | IAC | Yersinia infection | 32/1053 | 137/8465 | 2.63e-04 | 2.76e-03 | 1.83e-03 | 32 |
| hsa0513523 | Lung | AIS | Yersinia infection | 30/961 | 137/8465 | 2.70e-04 | 2.92e-03 | 1.87e-03 | 30 |
| hsa0513533 | Lung | AIS | Yersinia infection | 30/961 | 137/8465 | 2.70e-04 | 2.92e-03 | 1.87e-03 | 30 |
| hsa0513543 | Lung | MIAC | Yersinia infection | 17/507 | 137/8465 | 3.27e-03 | 2.72e-02 | 1.96e-02 | 17 |
| hsa0513553 | Lung | MIAC | Yersinia infection | 17/507 | 137/8465 | 3.27e-03 | 2.72e-02 | 1.96e-02 | 17 |
| hsa0513520 | Oral cavity | OSCC | Yersinia infection | 94/3704 | 137/8465 | 2.85e-09 | 3.08e-08 | 1.57e-08 | 94 |
| hsa05135110 | Oral cavity | OSCC | Yersinia infection | 94/3704 | 137/8465 | 2.85e-09 | 3.08e-08 | 1.57e-08 | 94 |
| hsa0513525 | Oral cavity | LP | Yersinia infection | 59/2418 | 137/8465 | 1.81e-04 | 1.04e-03 | 6.71e-04 | 59 |
| hsa0513535 | Oral cavity | LP | Yersinia infection | 59/2418 | 137/8465 | 1.81e-04 | 1.04e-03 | 6.71e-04 | 59 |
| hsa0513518 | Prostate | BPH | Yersinia infection | 49/1718 | 137/8465 | 1.65e-05 | 1.27e-04 | 7.86e-05 | 49 |
| hsa0513519 | Prostate | BPH | Yersinia infection | 49/1718 | 137/8465 | 1.65e-05 | 1.27e-04 | 7.86e-05 | 49 |
| hsa0513524 | Prostate | Tumor | Yersinia infection | 48/1791 | 137/8465 | 1.11e-04 | 7.25e-04 | 4.49e-04 | 48 |
| hsa0513534 | Prostate | Tumor | Yersinia infection | 48/1791 | 137/8465 | 1.11e-04 | 7.25e-04 | 4.49e-04 | 48 |
| hsa0513521 | Stomach | CAG with IM | Yersinia infection | 20/640 | 137/8465 | 3.22e-03 | 1.93e-02 | 1.36e-02 | 20 |
| hsa0513531 | Stomach | CAG with IM | Yersinia infection | 20/640 | 137/8465 | 3.22e-03 | 1.93e-02 | 1.36e-02 | 20 |
| Page: 1 2 |
Top |
Cell-cell communication analysis |
| Identification of potential cell-cell interactions between two cell types and their ligand-receptor pairs for different disease states |
| Ligand | Receptor | LRpair | Pathway | Tissue | Disease Stage |
| Page: 1 |
Top |
Single-cell gene regulatory network inference analysis |
| Find out the significant the regulons (TFs) and the target genes of each regulon across cell types for different disease states |
| TF | Cell Type | Tissue | Disease Stage | Target Gene | RSS | Regulon Activity |
| ∗The dot plots of a searched regulon are shown for all cell subpopulations in each disease state of each tissue based on the regulon specific score inferred using pySCENIC and by calculating the average expression. |
| Page: 1 |
Top |
Somatic mutation of malignant transformation related genes |
| Annotation of somatic variants for genes involved in malignant transformation |
| Hugo Symbol | Variant Class | Variant Classification | dbSNP RS | HGVSc | HGVSp | HGVSp Short | SWISSPROT | BIOTYPE | SIFT | PolyPhen | Tumor Sample Barcode | Tissue | Histology | Sex | Age | Stage | Therapy Types | Drugs | Outcome |
| ARHGEF28 | SNV | Missense_Mutation | novel | c.3787N>A | p.Asp1263Asn | p.D1263N | Q8N1W1 | protein_coding | deleterious(0.01) | possibly_damaging(0.572) | TCGA-A2-A4S1-01 | Breast | breast invasive carcinoma | Female | >=65 | I/II | Unknown | Unknown | SD |
| ARHGEF28 | SNV | Missense_Mutation | c.3965C>A | p.Pro1322Gln | p.P1322Q | Q8N1W1 | protein_coding | tolerated(0.12) | benign(0.007) | TCGA-A7-A6VY-01 | Breast | breast invasive carcinoma | Female | <65 | I/II | Chemotherapy | cyclophosphamide | CR | |
| ARHGEF28 | SNV | Missense_Mutation | c.1883N>G | p.Asn628Ser | p.N628S | Q8N1W1 | protein_coding | tolerated(0.39) | benign(0.178) | TCGA-AN-A0XN-01 | Breast | breast invasive carcinoma | Female | >=65 | III/IV | Unknown | Unknown | SD | |
| ARHGEF28 | SNV | Missense_Mutation | c.1372N>T | p.Leu458Phe | p.L458F | Q8N1W1 | protein_coding | tolerated(0.11) | possibly_damaging(0.823) | TCGA-BH-A0HF-01 | Breast | breast invasive carcinoma | Female | >=65 | I/II | Hormone Therapy | arimidex | SD | |
| ARHGEF28 | SNV | Missense_Mutation | c.2914N>G | p.Lys972Glu | p.K972E | Q8N1W1 | protein_coding | deleterious(0) | probably_damaging(0.996) | TCGA-D8-A140-01 | Breast | breast invasive carcinoma | Female | <65 | I/II | Chemotherapy | doxorubicin+cyclophosphamid | SD | |
| ARHGEF28 | SNV | Missense_Mutation | novel | c.3783N>C | p.Lys1261Asn | p.K1261N | Q8N1W1 | protein_coding | deleterious(0.03) | benign(0.322) | TCGA-D8-A1JI-01 | Breast | breast invasive carcinoma | Female | <65 | I/II | Chemotherapy | doxorubicine | SD |
| ARHGEF28 | SNV | Missense_Mutation | c.2841N>C | p.Met947Ile | p.M947I | Q8N1W1 | protein_coding | deleterious(0.01) | probably_damaging(0.949) | TCGA-D8-A27G-01 | Breast | breast invasive carcinoma | Female | >=65 | I/II | Unknown | Unknown | SD | |
| ARHGEF28 | SNV | Missense_Mutation | c.4141N>A | p.Arg1381Ser | p.R1381S | Q8N1W1 | protein_coding | deleterious(0) | possibly_damaging(0.737) | TCGA-EW-A1IZ-01 | Breast | breast invasive carcinoma | Female | <65 | III/IV | Chemotherapy | taxotere | SD | |
| ARHGEF28 | SNV | Missense_Mutation | novel | c.4207N>T | p.Val1403Phe | p.V1403F | Q8N1W1 | protein_coding | tolerated(0.06) | benign(0.003) | TCGA-S3-AA11-01 | Breast | breast invasive carcinoma | Female | >=65 | I/II | Hormone Therapy | letrozole | CR |
| ARHGEF28 | insertion | Nonsense_Mutation | novel | c.3791_3792insCTTTATGCTGAAATTTTCTCCTTTATGAATAAATCT | p.Pro1264_Gly1265insPheMetLeuLysPheSerProLeuTerIleAsnLeu | p.P1264_G1265insFMLKFSPL*INL | Q8N1W1 | protein_coding | TCGA-AN-A0AM-01 | Breast | breast invasive carcinoma | Female | <65 | I/II | Unknown | Unknown | SD |
| Page: 1 2 3 4 5 6 7 8 9 10 11 12 13 14 |
Top |
Related drugs of malignant transformation related genes |
| Identification of chemicals and drugs interact with genes involved in malignant transfromation |
| (DGIdb 4.0) |
| Entrez ID | Symbol | Category | Interaction Types | Drug Claim Name | Drug Name | PMIDs |
| 64283 | ARHGEF28 | NA | methylphenidate | METHYLPHENIDATE | 29382897 |
| Page: 1 |

Copyright 2023-Present -The University of Texas Health Science Center at Houston |