
|
|||||
|
 | |
| |
| |
| |
| |
| |
|
Gene: ARHGEF26 |
Gene summary for ARHGEF26 |
| Gene information | Species | Human | Gene symbol | ARHGEF26 | Gene ID | 26084 |
| Gene name | Rho guanine nucleotide exchange factor 26 | |
| Gene Alias | CSGEF | |
| Cytomap | 3q25.2 | |
| Gene Type | protein-coding | GO ID | GO:0000902 | UniProtAcc | A0A140VJU4 |
Top |
Malignant transformation analysis |
| Identification of the aberrant gene expression in precancerous and cancerous lesions by comparing the gene expression of stem-like cells in diseased tissues with normal stem cells |
| Entrez ID | Symbol | Replicates | Species | Organ | Tissue | Adj P-value | Log2FC | Malignancy |
| 26084 | ARHGEF26 | LZE2T | Human | Esophagus | ESCC | 6.37e-03 | 4.73e-01 | 0.082 |
| 26084 | ARHGEF26 | LZE4T | Human | Esophagus | ESCC | 7.60e-05 | 2.76e-01 | 0.0811 |
| 26084 | ARHGEF26 | LZE7T | Human | Esophagus | ESCC | 4.42e-10 | 6.57e-01 | 0.0667 |
| 26084 | ARHGEF26 | LZE21D1 | Human | Esophagus | HGIN | 6.38e-05 | 7.84e-01 | 0.0632 |
| 26084 | ARHGEF26 | LZE24T | Human | Esophagus | ESCC | 4.27e-09 | 4.71e-01 | 0.0596 |
| 26084 | ARHGEF26 | LZE21T | Human | Esophagus | ESCC | 6.21e-11 | 7.18e-01 | 0.0655 |
| 26084 | ARHGEF26 | P1T-E | Human | Esophagus | ESCC | 3.36e-02 | 1.24e-01 | 0.0875 |
| 26084 | ARHGEF26 | P2T-E | Human | Esophagus | ESCC | 7.36e-20 | 4.35e-01 | 0.1177 |
| 26084 | ARHGEF26 | P4T-E | Human | Esophagus | ESCC | 1.15e-12 | 4.72e-01 | 0.1323 |
| 26084 | ARHGEF26 | P9T-E | Human | Esophagus | ESCC | 2.01e-10 | 3.09e-01 | 0.1131 |
| 26084 | ARHGEF26 | P10T-E | Human | Esophagus | ESCC | 4.12e-36 | 6.11e-01 | 0.116 |
| 26084 | ARHGEF26 | P11T-E | Human | Esophagus | ESCC | 1.18e-02 | 2.24e-01 | 0.1426 |
| 26084 | ARHGEF26 | P12T-E | Human | Esophagus | ESCC | 5.04e-31 | 6.20e-01 | 0.1122 |
| 26084 | ARHGEF26 | P15T-E | Human | Esophagus | ESCC | 4.44e-18 | 4.80e-01 | 0.1149 |
| 26084 | ARHGEF26 | P16T-E | Human | Esophagus | ESCC | 9.04e-20 | 3.16e-01 | 0.1153 |
| 26084 | ARHGEF26 | P19T-E | Human | Esophagus | ESCC | 7.39e-04 | 2.41e-01 | 0.1662 |
| 26084 | ARHGEF26 | P20T-E | Human | Esophagus | ESCC | 1.31e-05 | 2.72e-01 | 0.1124 |
| 26084 | ARHGEF26 | P23T-E | Human | Esophagus | ESCC | 3.13e-06 | 1.29e-01 | 0.108 |
| 26084 | ARHGEF26 | P26T-E | Human | Esophagus | ESCC | 1.83e-22 | 4.79e-01 | 0.1276 |
| 26084 | ARHGEF26 | P27T-E | Human | Esophagus | ESCC | 3.41e-26 | 5.47e-01 | 0.1055 |
| Page: 1 2 3 |
| Tissue | Expression Dynamics | Abbreviation |
| Esophagus |  | ESCC: Esophageal squamous cell carcinoma |
| HGIN: High-grade intraepithelial neoplasias | ||
| LGIN: Low-grade intraepithelial neoplasias | ||
| Lung | 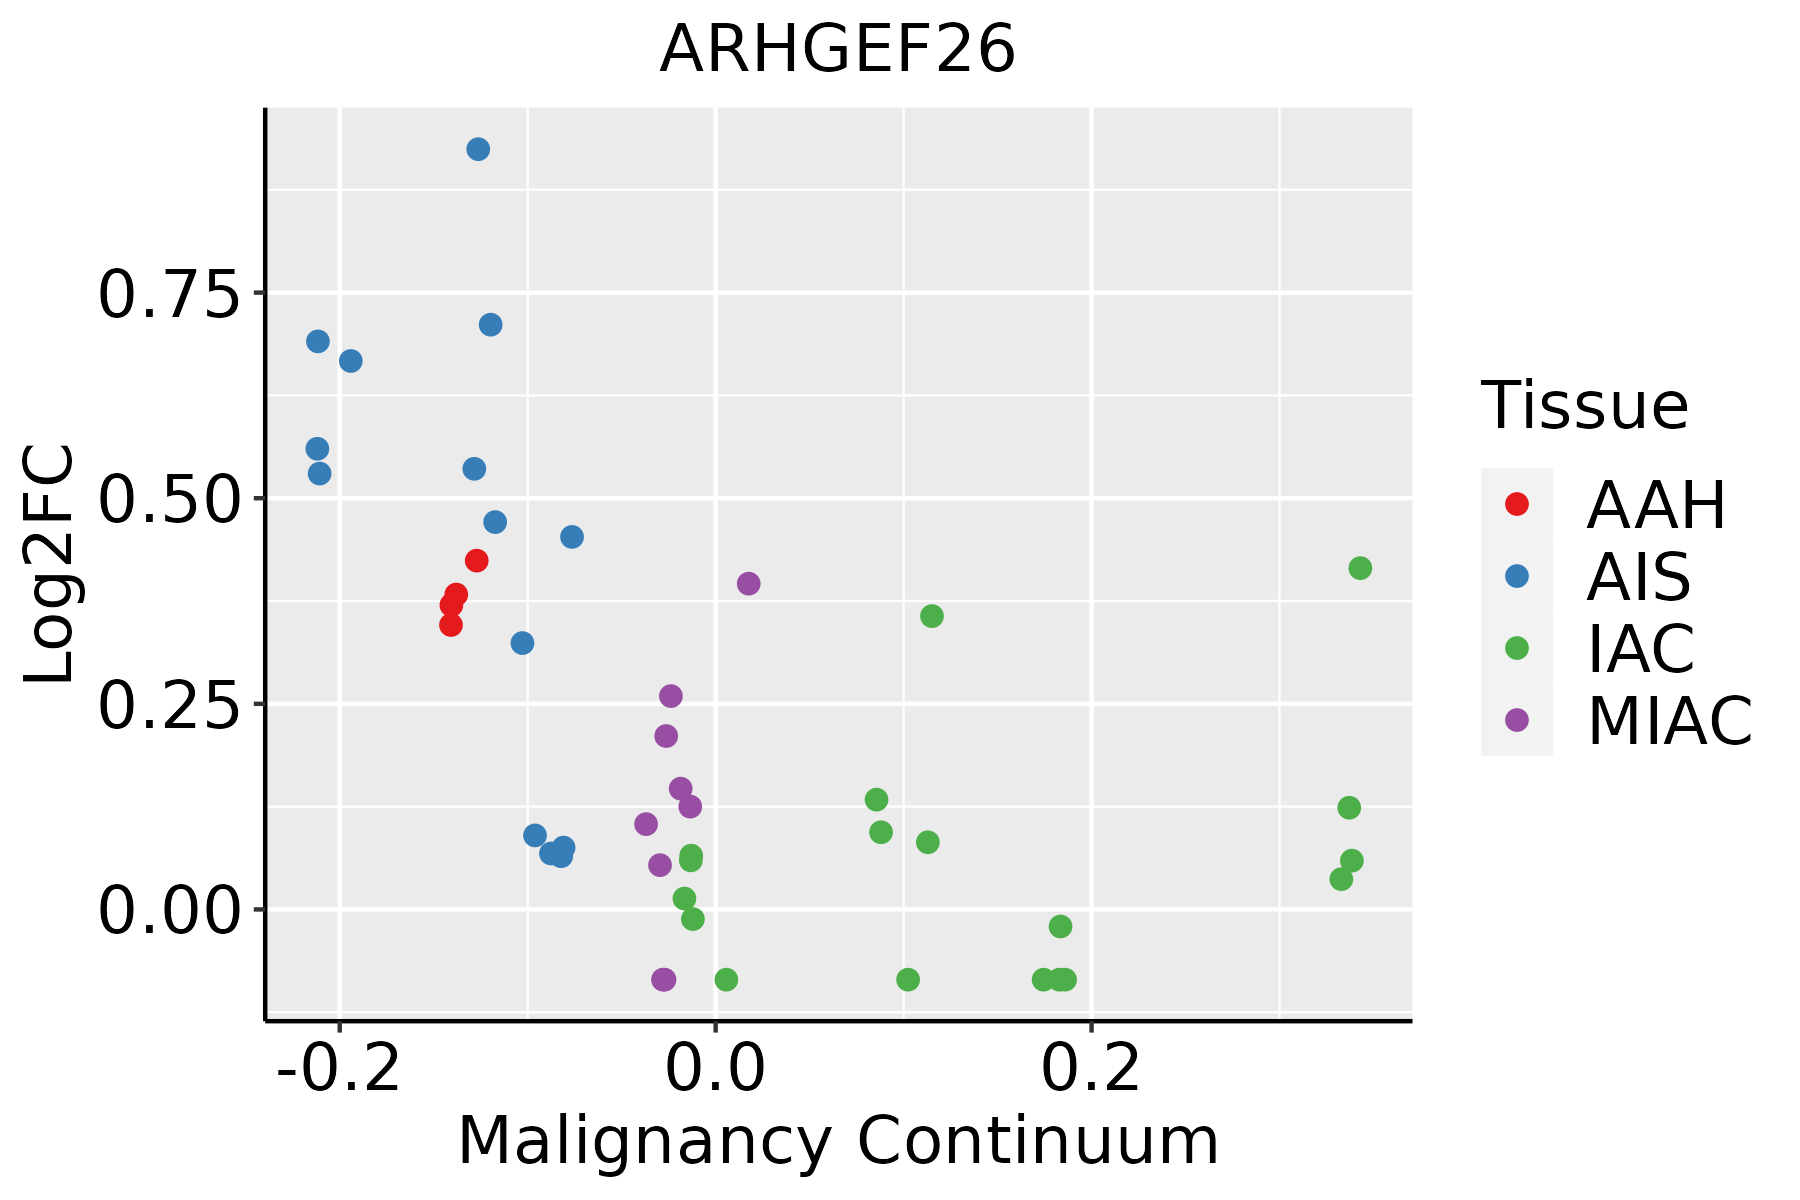 | AAH: Atypical adenomatous hyperplasia |
| AIS: Adenocarcinoma in situ | ||
| IAC: Invasive lung adenocarcinoma | ||
| MIA: Minimally invasive adenocarcinoma | ||
| Prostate | 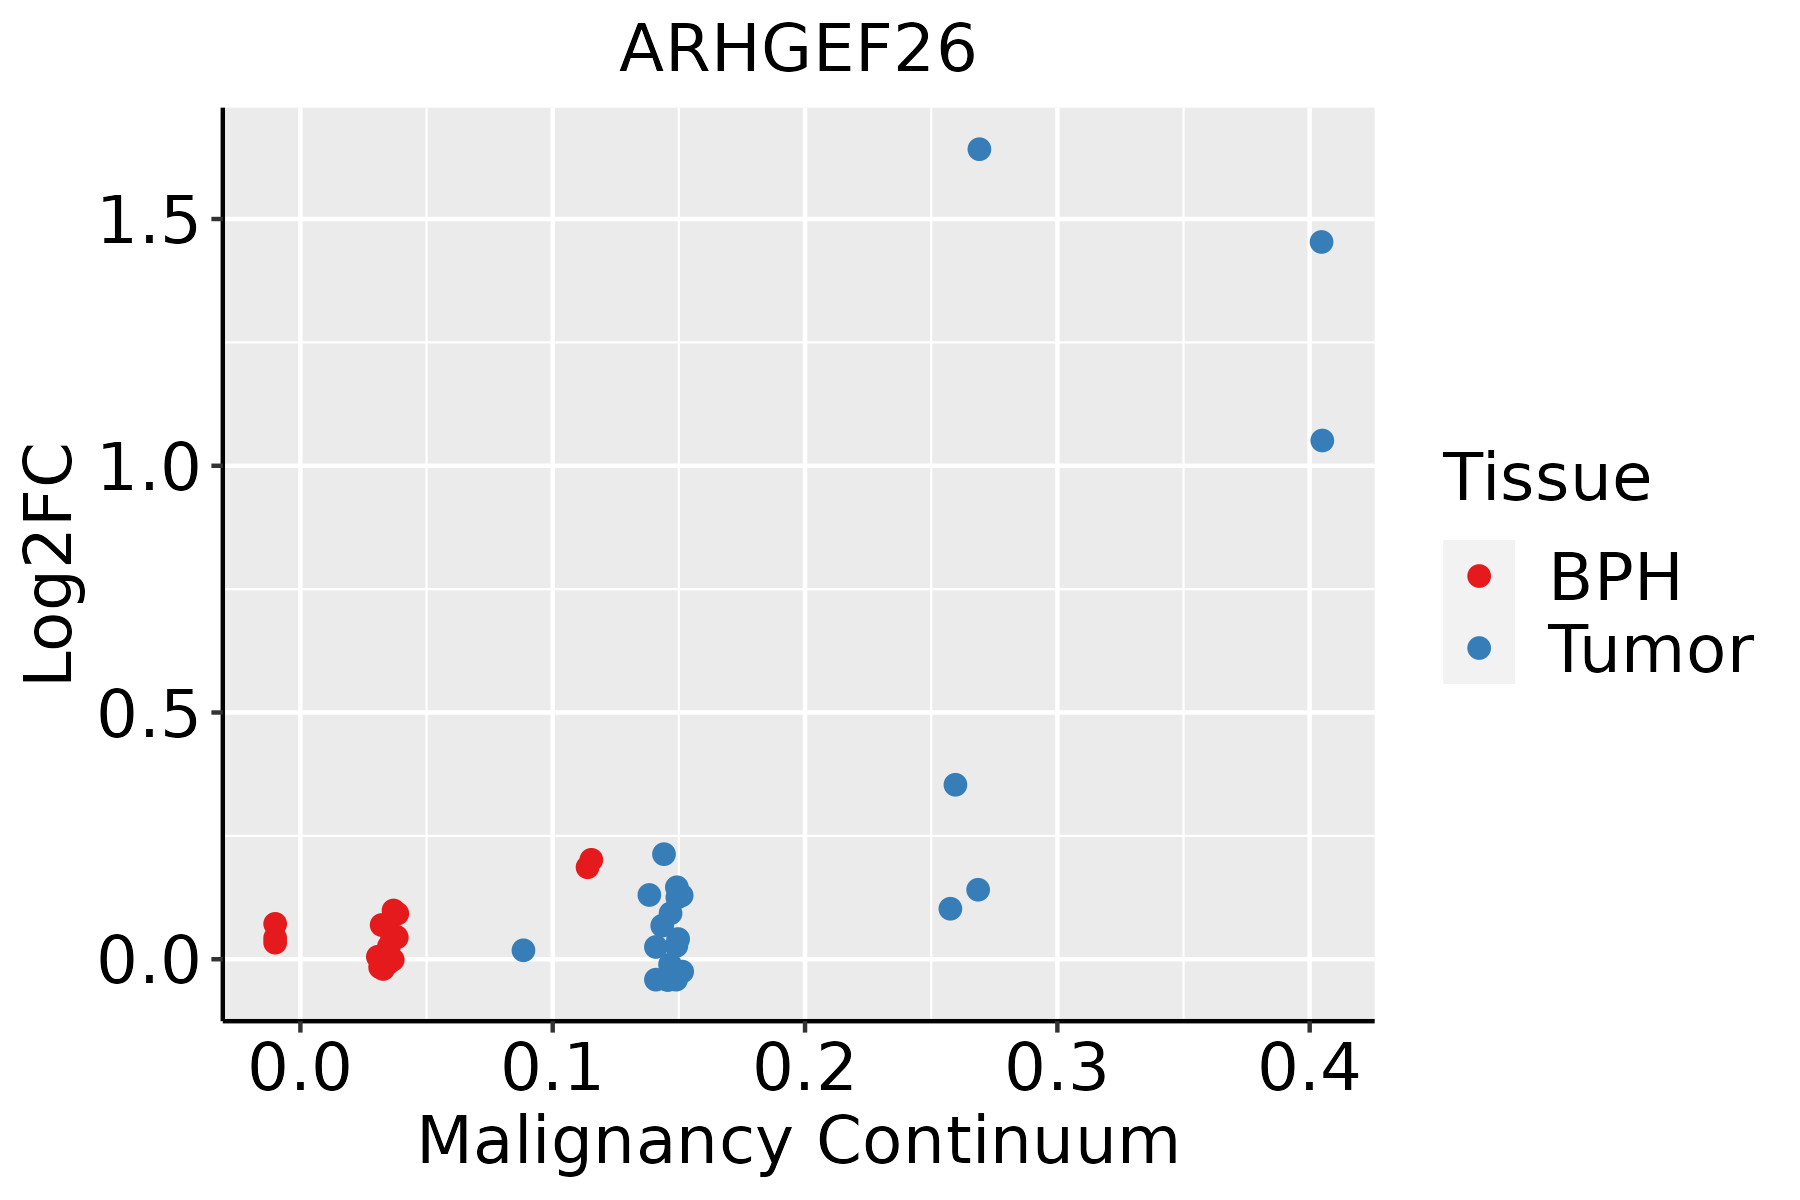 | BPH: Benign Prostatic Hyperplasia |
| ∗log2FC in expression of this searched gene in stem-like cells from each diseased tissue sample relative to stem-like cells in normal samples in each tissue plotted against the malignancy continuum. Samples are colored based on if they are from different disease stage. |
Top |
Malignant transformation related pathway analysis |
| Find out the enriched GO biological processes and KEGG pathways involved in transition from healthy to precancer to cancer |
| Tissue | Disease Stage | Enriched GO biological Processes |
| Colorectum | AD |  |
| Colorectum | SER |  |
| Colorectum | MSS |  |
| Colorectum | MSI-H |  |
| Colorectum | FAP |  |
| ∗Top 15 enriched GO BP terms are showed in the bar plot of each disease state in each tissue. Each row represents a significant GO biological process which is colored according to the -log10(p.adjust). |
| Page: 1 2 3 4 5 6 7 8 9 |
| GO ID | Tissue | Disease Stage | Description | Gene Ratio | Bg Ratio | pvalue | p.adjust | Count |
| GO:000206420 | Esophagus | ESCC | epithelial cell development | 136/8552 | 220/18723 | 9.50e-07 | 1.21e-05 | 136 |
| GO:000188510 | Esophagus | ESCC | endothelial cell development | 44/8552 | 64/18723 | 1.59e-04 | 1.05e-03 | 44 |
| GO:00315299 | Esophagus | ESCC | ruffle organization | 39/8552 | 56/18723 | 2.44e-04 | 1.51e-03 | 39 |
| GO:00971789 | Esophagus | ESCC | ruffle assembly | 32/8552 | 44/18723 | 2.50e-04 | 1.54e-03 | 32 |
| GO:004308715 | Esophagus | ESCC | regulation of GTPase activity | 183/8552 | 348/18723 | 5.34e-03 | 2.00e-02 | 183 |
| GO:004544610 | Esophagus | ESCC | endothelial cell differentiation | 67/8552 | 118/18723 | 9.86e-03 | 3.40e-02 | 67 |
| GO:000315818 | Esophagus | ESCC | endothelium development | 76/8552 | 136/18723 | 1.05e-02 | 3.59e-02 | 76 |
| GO:00033824 | Esophagus | ESCC | epithelial cell morphogenesis | 22/8552 | 33/18723 | 1.22e-02 | 4.08e-02 | 22 |
| GO:000206413 | Lung | AIS | epithelial cell development | 48/1849 | 220/18723 | 1.06e-07 | 1.18e-05 | 48 |
| GO:004308711 | Lung | AIS | regulation of GTPase activity | 65/1849 | 348/18723 | 3.35e-07 | 2.83e-05 | 65 |
| GO:004354711 | Lung | AIS | positive regulation of GTPase activity | 44/1849 | 255/18723 | 1.74e-04 | 3.64e-03 | 44 |
| GO:000188513 | Lung | AIS | endothelial cell development | 16/1849 | 64/18723 | 3.78e-04 | 6.61e-03 | 16 |
| GO:003152912 | Lung | AIS | ruffle organization | 14/1849 | 56/18723 | 8.61e-04 | 1.17e-02 | 14 |
| GO:000315812 | Lung | AIS | endothelium development | 25/1849 | 136/18723 | 1.67e-03 | 1.90e-02 | 25 |
| GO:009717811 | Lung | AIS | ruffle assembly | 11/1849 | 44/18723 | 3.01e-03 | 2.97e-02 | 11 |
| GO:009063011 | Lung | AIS | activation of GTPase activity | 21/1849 | 115/18723 | 4.07e-03 | 3.65e-02 | 21 |
| GO:004544612 | Lung | AIS | endothelial cell differentiation | 21/1849 | 118/18723 | 5.54e-03 | 4.71e-02 | 21 |
| GO:000206417 | Prostate | BPH | epithelial cell development | 85/3107 | 220/18723 | 3.16e-15 | 4.55e-13 | 85 |
| GO:000315814 | Prostate | BPH | endothelium development | 49/3107 | 136/18723 | 3.17e-08 | 9.07e-07 | 49 |
| GO:00454468 | Prostate | BPH | endothelial cell differentiation | 43/3107 | 118/18723 | 1.49e-07 | 3.46e-06 | 43 |
| Page: 1 2 |
| Pathway ID | Tissue | Disease Stage | Description | Gene Ratio | Bg Ratio | pvalue | p.adjust | qvalue | Count |
| hsa0510039 | Esophagus | HGIN | Bacterial invasion of epithelial cells | 30/1383 | 77/8465 | 1.49e-06 | 2.31e-05 | 1.84e-05 | 30 |
| hsa0513239 | Esophagus | HGIN | Salmonella infection | 69/1383 | 249/8465 | 3.02e-06 | 4.47e-05 | 3.55e-05 | 69 |
| hsa05100114 | Esophagus | HGIN | Bacterial invasion of epithelial cells | 30/1383 | 77/8465 | 1.49e-06 | 2.31e-05 | 1.84e-05 | 30 |
| hsa05132115 | Esophagus | HGIN | Salmonella infection | 69/1383 | 249/8465 | 3.02e-06 | 4.47e-05 | 3.55e-05 | 69 |
| hsa05132211 | Esophagus | ESCC | Salmonella infection | 191/4205 | 249/8465 | 6.51e-19 | 5.45e-17 | 2.79e-17 | 191 |
| hsa05100211 | Esophagus | ESCC | Bacterial invasion of epithelial cells | 59/4205 | 77/8465 | 1.05e-06 | 6.76e-06 | 3.46e-06 | 59 |
| hsa05132310 | Esophagus | ESCC | Salmonella infection | 191/4205 | 249/8465 | 6.51e-19 | 5.45e-17 | 2.79e-17 | 191 |
| hsa05100310 | Esophagus | ESCC | Bacterial invasion of epithelial cells | 59/4205 | 77/8465 | 1.05e-06 | 6.76e-06 | 3.46e-06 | 59 |
| hsa0510023 | Lung | AIS | Bacterial invasion of epithelial cells | 25/961 | 77/8465 | 6.03e-07 | 2.44e-05 | 1.56e-05 | 25 |
| hsa0513223 | Lung | AIS | Salmonella infection | 50/961 | 249/8465 | 3.47e-05 | 5.62e-04 | 3.59e-04 | 50 |
| hsa0510033 | Lung | AIS | Bacterial invasion of epithelial cells | 25/961 | 77/8465 | 6.03e-07 | 2.44e-05 | 1.56e-05 | 25 |
| hsa0513233 | Lung | AIS | Salmonella infection | 50/961 | 249/8465 | 3.47e-05 | 5.62e-04 | 3.59e-04 | 50 |
| hsa0513228 | Prostate | BPH | Salmonella infection | 99/1718 | 249/8465 | 7.26e-13 | 1.50e-11 | 9.27e-12 | 99 |
| hsa05132113 | Prostate | BPH | Salmonella infection | 99/1718 | 249/8465 | 7.26e-13 | 1.50e-11 | 9.27e-12 | 99 |
| hsa0513229 | Prostate | Tumor | Salmonella infection | 98/1791 | 249/8465 | 2.55e-11 | 5.28e-10 | 3.27e-10 | 98 |
| hsa0510029 | Prostate | Tumor | Bacterial invasion of epithelial cells | 36/1791 | 77/8465 | 4.38e-07 | 4.53e-06 | 2.81e-06 | 36 |
| hsa0513237 | Prostate | Tumor | Salmonella infection | 98/1791 | 249/8465 | 2.55e-11 | 5.28e-10 | 3.27e-10 | 98 |
| hsa0510037 | Prostate | Tumor | Bacterial invasion of epithelial cells | 36/1791 | 77/8465 | 4.38e-07 | 4.53e-06 | 2.81e-06 | 36 |
| Page: 1 |
Top |
Cell-cell communication analysis |
| Identification of potential cell-cell interactions between two cell types and their ligand-receptor pairs for different disease states |
| Ligand | Receptor | LRpair | Pathway | Tissue | Disease Stage |
| Page: 1 |
Top |
Single-cell gene regulatory network inference analysis |
| Find out the significant the regulons (TFs) and the target genes of each regulon across cell types for different disease states |
| TF | Cell Type | Tissue | Disease Stage | Target Gene | RSS | Regulon Activity |
| ∗The dot plots of a searched regulon are shown for all cell subpopulations in each disease state of each tissue based on the regulon specific score inferred using pySCENIC and by calculating the average expression. |
| Page: 1 |
Top |
Somatic mutation of malignant transformation related genes |
| Annotation of somatic variants for genes involved in malignant transformation |
| Hugo Symbol | Variant Class | Variant Classification | dbSNP RS | HGVSc | HGVSp | HGVSp Short | SWISSPROT | BIOTYPE | SIFT | PolyPhen | Tumor Sample Barcode | Tissue | Histology | Sex | Age | Stage | Therapy Types | Drugs | Outcome |
| ARHGEF26 | SNV | Missense_Mutation | novel | c.598N>T | p.Arg200Trp | p.R200W | Q96DR7 | protein_coding | deleterious_low_confidence(0.01) | benign(0.333) | TCGA-AC-A2QH-01 | Breast | breast invasive carcinoma | Female | <65 | I/II | Chemotherapy | cytoxan | CR |
| ARHGEF26 | SNV | Missense_Mutation | novel | c.1955N>T | p.Ser652Phe | p.S652F | Q96DR7 | protein_coding | deleterious(0.02) | probably_damaging(0.998) | TCGA-AC-A62X-01 | Breast | breast invasive carcinoma | Female | >=65 | I/II | Unknown | Unknown | SD |
| ARHGEF26 | SNV | Missense_Mutation | rs766480661 | c.2492N>A | p.Arg831Gln | p.R831Q | Q96DR7 | protein_coding | deleterious(0) | probably_damaging(0.998) | TCGA-AN-A046-01 | Breast | breast invasive carcinoma | Female | >=65 | I/II | Unknown | Unknown | SD |
| ARHGEF26 | SNV | Missense_Mutation | c.1942C>T | p.Pro648Ser | p.P648S | Q96DR7 | protein_coding | deleterious(0) | benign(0.352) | TCGA-AN-A0FT-01 | Breast | breast invasive carcinoma | Female | <65 | I/II | Unknown | Unknown | SD | |
| ARHGEF26 | SNV | Missense_Mutation | rs142649978 | c.2389G>A | p.Val797Ile | p.V797I | Q96DR7 | protein_coding | tolerated(1) | benign(0) | TCGA-AO-A1KT-01 | Breast | breast invasive carcinoma | Female | >=65 | I/II | Chemotherapy | fluorouracil | SD |
| ARHGEF26 | insertion | Frame_Shift_Ins | novel | c.2539_2540insGGCGC | p.Glu847GlyfsTer4 | p.E847Gfs*4 | Q96DR7 | protein_coding | TCGA-B6-A0IK-01 | Breast | breast invasive carcinoma | Female | <65 | III/IV | Unknown | Unknown | PD | ||
| ARHGEF26 | insertion | Nonsense_Mutation | novel | c.2541_2542insTGAAGGGGGGTGTTGTATGCCT | p.Ile848Ter | p.I848* | Q96DR7 | protein_coding | TCGA-B6-A0IK-01 | Breast | breast invasive carcinoma | Female | <65 | III/IV | Unknown | Unknown | PD | ||
| ARHGEF26 | deletion | Frame_Shift_Del | novel | c.2242delN | p.Thr748GlnfsTer15 | p.T748Qfs*15 | Q96DR7 | protein_coding | TCGA-D8-A27V-01 | Breast | breast invasive carcinoma | Female | <65 | I/II | Hormone Therapy | tamoxiphen | SD | ||
| ARHGEF26 | SNV | Missense_Mutation | novel | c.530G>A | p.Gly177Asp | p.G177D | Q96DR7 | protein_coding | tolerated_low_confidence(0.13) | benign(0.229) | TCGA-2W-A8YY-01 | Cervix | cervical & endocervical cancer | Female | <65 | I/II | Chemotherapy | cisplatin | CR |
| ARHGEF26 | SNV | Missense_Mutation | rs765346404 | c.904G>A | p.Val302Met | p.V302M | Q96DR7 | protein_coding | tolerated(0.18) | benign(0.003) | TCGA-2W-A8YY-01 | Cervix | cervical & endocervical cancer | Female | <65 | I/II | Chemotherapy | cisplatin | CR |
| Page: 1 2 3 4 5 6 7 8 9 10 11 12 13 14 |
Top |
Related drugs of malignant transformation related genes |
| Identification of chemicals and drugs interact with genes involved in malignant transfromation |
| (DGIdb 4.0) |
| Entrez ID | Symbol | Category | Interaction Types | Drug Claim Name | Drug Name | PMIDs |
| Page: 1 |

Copyright 2023-Present -The University of Texas Health Science Center at Houston |