
|
|||||
|
 | |
| |
| |
| |
| |
| |
|
Gene: ARHGEF19 |
Gene summary for ARHGEF19 |
| Gene information | Species | Human | Gene symbol | ARHGEF19 | Gene ID | 128272 |
| Gene name | Rho guanine nucleotide exchange factor 19 | |
| Gene Alias | WGEF | |
| Cytomap | 1p36.13 | |
| Gene Type | protein-coding | GO ID | GO:0001736 | UniProtAcc | B4DN02 |
Top |
Malignant transformation analysis |
| Identification of the aberrant gene expression in precancerous and cancerous lesions by comparing the gene expression of stem-like cells in diseased tissues with normal stem cells |
| Entrez ID | Symbol | Replicates | Species | Organ | Tissue | Adj P-value | Log2FC | Malignancy |
| 128272 | ARHGEF19 | LZE21D1 | Human | Esophagus | HGIN | 1.80e-02 | 1.72e-01 | 0.0632 |
| 128272 | ARHGEF19 | LZE24T | Human | Esophagus | ESCC | 4.95e-17 | 1.96e-01 | 0.0596 |
| 128272 | ARHGEF19 | P1T-E | Human | Esophagus | ESCC | 3.48e-04 | 2.74e-01 | 0.0875 |
| 128272 | ARHGEF19 | P2T-E | Human | Esophagus | ESCC | 1.05e-30 | 5.14e-01 | 0.1177 |
| 128272 | ARHGEF19 | P4T-E | Human | Esophagus | ESCC | 7.38e-09 | 1.91e-01 | 0.1323 |
| 128272 | ARHGEF19 | P5T-E | Human | Esophagus | ESCC | 2.09e-02 | 2.35e-02 | 0.1327 |
| 128272 | ARHGEF19 | P8T-E | Human | Esophagus | ESCC | 2.04e-10 | 1.29e-01 | 0.0889 |
| 128272 | ARHGEF19 | P9T-E | Human | Esophagus | ESCC | 3.91e-10 | 1.06e-01 | 0.1131 |
| 128272 | ARHGEF19 | P10T-E | Human | Esophagus | ESCC | 1.13e-17 | 3.23e-01 | 0.116 |
| 128272 | ARHGEF19 | P11T-E | Human | Esophagus | ESCC | 1.51e-05 | 1.81e-01 | 0.1426 |
| 128272 | ARHGEF19 | P12T-E | Human | Esophagus | ESCC | 3.49e-18 | 2.71e-01 | 0.1122 |
| 128272 | ARHGEF19 | P15T-E | Human | Esophagus | ESCC | 2.76e-20 | 1.69e-01 | 0.1149 |
| 128272 | ARHGEF19 | P16T-E | Human | Esophagus | ESCC | 3.53e-17 | 1.06e-01 | 0.1153 |
| 128272 | ARHGEF19 | P19T-E | Human | Esophagus | ESCC | 6.47e-05 | 2.26e-01 | 0.1662 |
| 128272 | ARHGEF19 | P20T-E | Human | Esophagus | ESCC | 5.99e-10 | 1.46e-01 | 0.1124 |
| 128272 | ARHGEF19 | P21T-E | Human | Esophagus | ESCC | 1.94e-18 | 2.65e-01 | 0.1617 |
| 128272 | ARHGEF19 | P22T-E | Human | Esophagus | ESCC | 6.11e-10 | 7.97e-02 | 0.1236 |
| 128272 | ARHGEF19 | P23T-E | Human | Esophagus | ESCC | 1.99e-17 | 2.40e-01 | 0.108 |
| 128272 | ARHGEF19 | P24T-E | Human | Esophagus | ESCC | 1.28e-08 | 8.30e-02 | 0.1287 |
| 128272 | ARHGEF19 | P26T-E | Human | Esophagus | ESCC | 1.96e-14 | 1.98e-01 | 0.1276 |
| Page: 1 2 3 4 |
| Tissue | Expression Dynamics | Abbreviation |
| Esophagus |  | ESCC: Esophageal squamous cell carcinoma |
| HGIN: High-grade intraepithelial neoplasias | ||
| LGIN: Low-grade intraepithelial neoplasias | ||
| Oral Cavity | 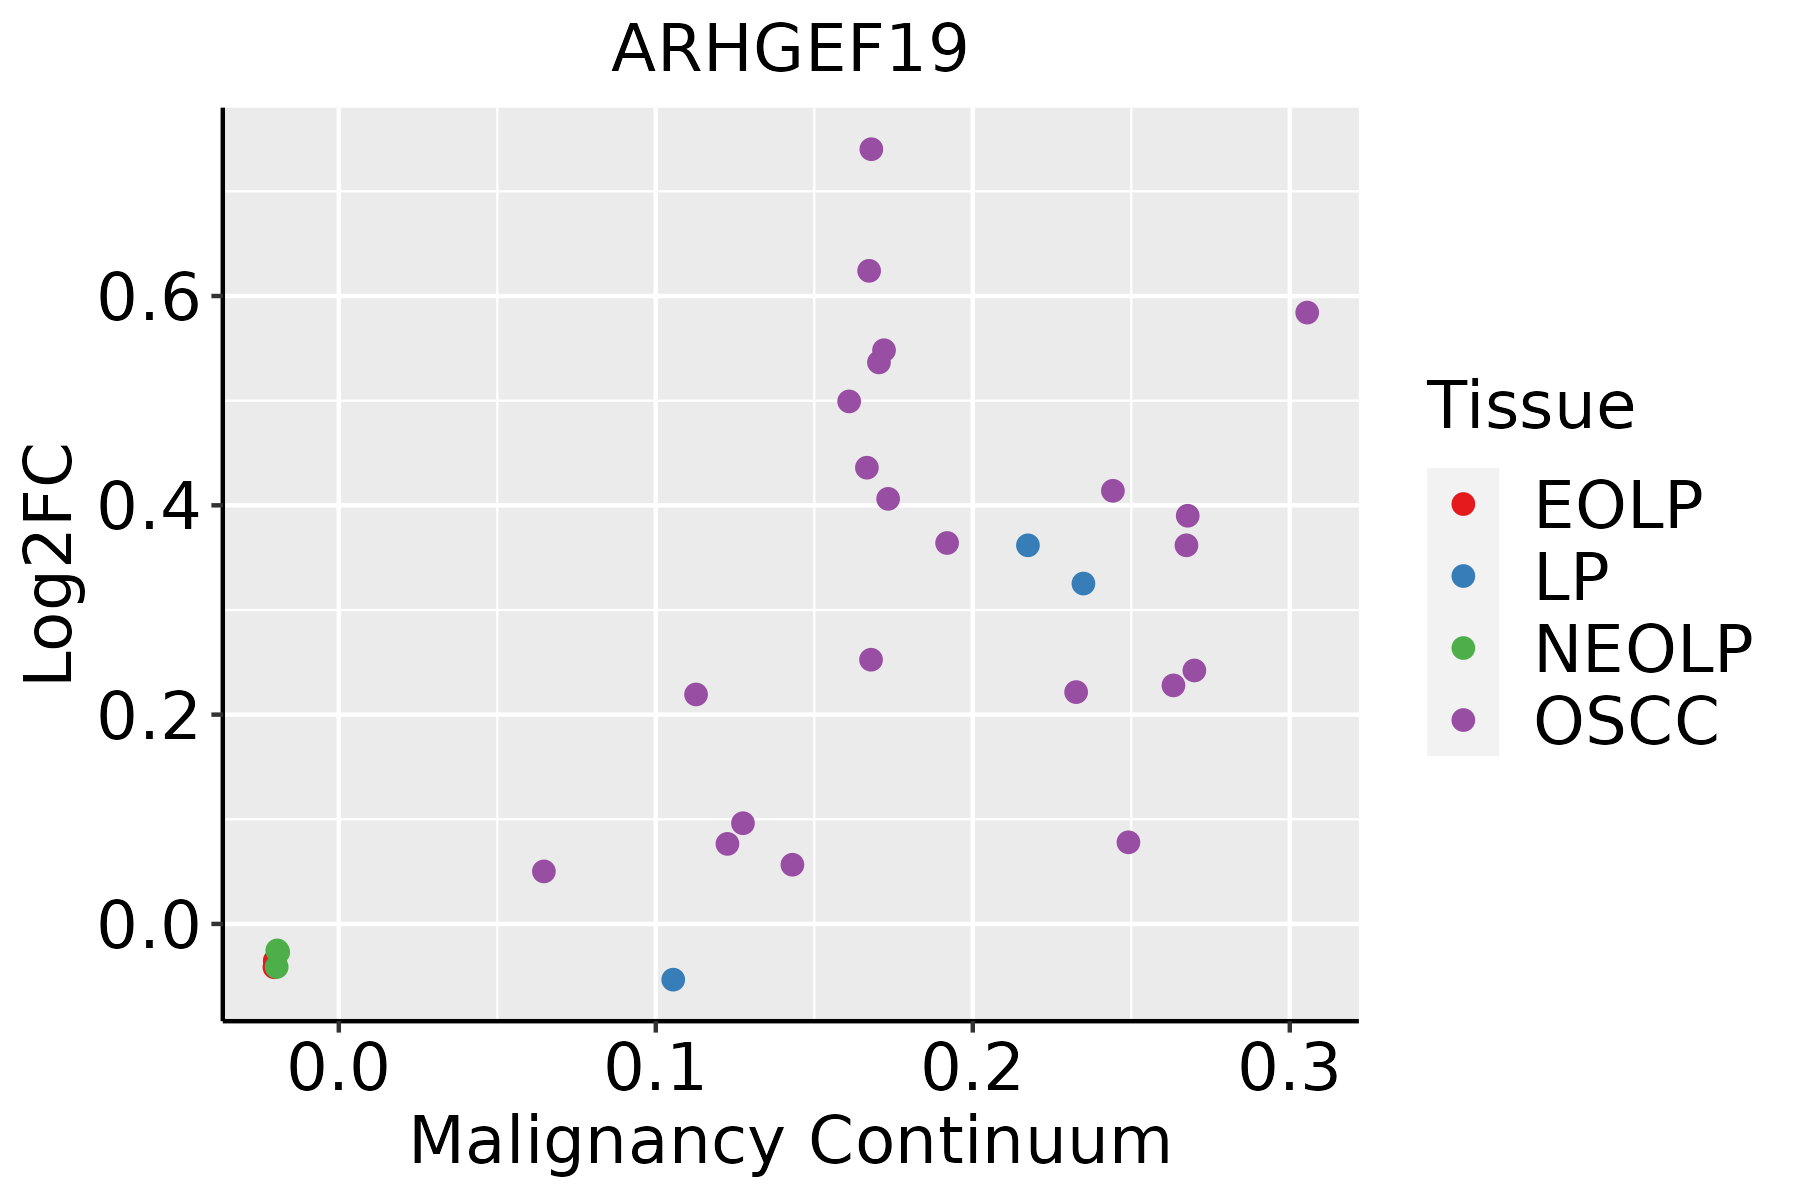 | EOLP: Erosive Oral lichen planus |
| LP: leukoplakia | ||
| NEOLP: Non-erosive oral lichen planus | ||
| OSCC: Oral squamous cell carcinoma | ||
| Skin |  | AK: Actinic keratosis |
| cSCC: Cutaneous squamous cell carcinoma | ||
| SCCIS:squamous cell carcinoma in situ |
| ∗log2FC in expression of this searched gene in stem-like cells from each diseased tissue sample relative to stem-like cells in normal samples in each tissue plotted against the malignancy continuum. Samples are colored based on if they are from different disease stage. |
Top |
Malignant transformation related pathway analysis |
| Find out the enriched GO biological processes and KEGG pathways involved in transition from healthy to precancer to cancer |
| Tissue | Disease Stage | Enriched GO biological Processes |
| Colorectum | AD |  |
| Colorectum | SER |  |
| Colorectum | MSS |  |
| Colorectum | MSI-H |  |
| Colorectum | FAP |  |
| ∗Top 15 enriched GO BP terms are showed in the bar plot of each disease state in each tissue. Each row represents a significant GO biological process which is colored according to the -log10(p.adjust). |
| Page: 1 2 3 4 5 6 7 8 9 |
| GO ID | Tissue | Disease Stage | Description | Gene Ratio | Bg Ratio | pvalue | p.adjust | Count |
| GO:003297027 | Esophagus | HGIN | regulation of actin filament-based process | 77/2587 | 397/18723 | 1.14e-03 | 1.39e-02 | 77 |
| GO:001605516 | Esophagus | HGIN | Wnt signaling pathway | 83/2587 | 444/18723 | 2.27e-03 | 2.33e-02 | 83 |
| GO:003295627 | Esophagus | HGIN | regulation of actin cytoskeleton organization | 69/2587 | 358/18723 | 2.35e-03 | 2.39e-02 | 69 |
| GO:019873816 | Esophagus | HGIN | cell-cell signaling by wnt | 83/2587 | 446/18723 | 2.58e-03 | 2.55e-02 | 83 |
| GO:001605517 | Esophagus | ESCC | Wnt signaling pathway | 268/8552 | 444/18723 | 2.32e-10 | 6.58e-09 | 268 |
| GO:019873817 | Esophagus | ESCC | cell-cell signaling by wnt | 269/8552 | 446/18723 | 2.41e-10 | 6.79e-09 | 269 |
| GO:0032970111 | Esophagus | ESCC | regulation of actin filament-based process | 231/8552 | 397/18723 | 2.91e-07 | 4.20e-06 | 231 |
| GO:0032956111 | Esophagus | ESCC | regulation of actin cytoskeleton organization | 210/8552 | 358/18723 | 4.40e-07 | 6.00e-06 | 210 |
| GO:004206027 | Esophagus | ESCC | wound healing | 243/8552 | 422/18723 | 4.62e-07 | 6.25e-06 | 243 |
| GO:00017387 | Esophagus | ESCC | morphogenesis of a polarized epithelium | 63/8552 | 94/18723 | 2.34e-05 | 2.00e-04 | 63 |
| GO:00600714 | Esophagus | ESCC | Wnt signaling pathway, planar cell polarity pathway | 36/8552 | 52/18723 | 5.05e-04 | 2.79e-03 | 36 |
| GO:00901753 | Esophagus | ESCC | regulation of establishment of planar polarity | 37/8552 | 56/18723 | 1.65e-03 | 7.65e-03 | 37 |
| GO:00017361 | Esophagus | ESCC | establishment of planar polarity | 45/8552 | 72/18723 | 2.97e-03 | 1.24e-02 | 45 |
| GO:00071641 | Esophagus | ESCC | establishment of tissue polarity | 45/8552 | 72/18723 | 2.97e-03 | 1.24e-02 | 45 |
| GO:00355671 | Esophagus | ESCC | non-canonical Wnt signaling pathway | 45/8552 | 72/18723 | 2.97e-03 | 1.24e-02 | 45 |
| GO:004308715 | Esophagus | ESCC | regulation of GTPase activity | 183/8552 | 348/18723 | 5.34e-03 | 2.00e-02 | 183 |
| GO:20000274 | Esophagus | ESCC | regulation of animal organ morphogenesis | 71/8552 | 125/18723 | 7.97e-03 | 2.84e-02 | 71 |
| GO:005105610 | Esophagus | ESCC | regulation of small GTPase mediated signal transduction | 157/8552 | 302/18723 | 1.55e-02 | 4.98e-02 | 157 |
| GO:004206020 | Oral cavity | OSCC | wound healing | 237/7305 | 422/18723 | 4.51e-13 | 2.18e-11 | 237 |
| GO:003297020 | Oral cavity | OSCC | regulation of actin filament-based process | 209/7305 | 397/18723 | 1.89e-08 | 3.72e-07 | 209 |
| Page: 1 2 |
| Pathway ID | Tissue | Disease Stage | Description | Gene Ratio | Bg Ratio | pvalue | p.adjust | qvalue | Count |
| Page: 1 |
Top |
Cell-cell communication analysis |
| Identification of potential cell-cell interactions between two cell types and their ligand-receptor pairs for different disease states |
| Ligand | Receptor | LRpair | Pathway | Tissue | Disease Stage |
| Page: 1 |
Top |
Single-cell gene regulatory network inference analysis |
| Find out the significant the regulons (TFs) and the target genes of each regulon across cell types for different disease states |
| TF | Cell Type | Tissue | Disease Stage | Target Gene | RSS | Regulon Activity |
| ∗The dot plots of a searched regulon are shown for all cell subpopulations in each disease state of each tissue based on the regulon specific score inferred using pySCENIC and by calculating the average expression. |
| Page: 1 |
Top |
Somatic mutation of malignant transformation related genes |
| Annotation of somatic variants for genes involved in malignant transformation |
| Hugo Symbol | Variant Class | Variant Classification | dbSNP RS | HGVSc | HGVSp | HGVSp Short | SWISSPROT | BIOTYPE | SIFT | PolyPhen | Tumor Sample Barcode | Tissue | Histology | Sex | Age | Stage | Therapy Types | Drugs | Outcome |
| ARHGEF19 | SNV | Missense_Mutation | c.2317N>C | p.Glu773Gln | p.E773Q | Q8IW93 | protein_coding | deleterious(0.02) | possibly_damaging(0.885) | TCGA-A8-A0A7-01 | Breast | breast invasive carcinoma | Female | <65 | I/II | Unknown | Unknown | SD | |
| ARHGEF19 | SNV | Missense_Mutation | c.2228N>T | p.Ser743Leu | p.S743L | Q8IW93 | protein_coding | tolerated(0.75) | benign(0) | TCGA-E2-A159-01 | Breast | breast invasive carcinoma | Female | <65 | I/II | Chemotherapy | cyclophosphamide | SD | |
| ARHGEF19 | insertion | Frame_Shift_Ins | novel | c.14_15insGGGAGGG | p.Pro6GlyfsTer144 | p.P6Gfs*144 | Q8IW93 | protein_coding | TCGA-AN-A0FY-01 | Breast | breast invasive carcinoma | Female | <65 | I/II | Unknown | Unknown | SD | ||
| ARHGEF19 | insertion | Frame_Shift_Ins | novel | c.1787_1788insGAATCAAGGGCTAGACTGTATGCCGAGGACT | p.His596GlnfsTer42 | p.H596Qfs*42 | Q8IW93 | protein_coding | TCGA-AQ-A04J-01 | Breast | breast invasive carcinoma | Female | <65 | I/II | Chemotherapy | cytoxan | SD | ||
| ARHGEF19 | SNV | Missense_Mutation | novel | c.1164G>T | p.Glu388Asp | p.E388D | Q8IW93 | protein_coding | deleterious(0) | probably_damaging(0.943) | TCGA-2W-A8YY-01 | Cervix | cervical & endocervical cancer | Female | <65 | I/II | Chemotherapy | cisplatin | CR |
| ARHGEF19 | SNV | Missense_Mutation | c.620N>G | p.Ser207Cys | p.S207C | Q8IW93 | protein_coding | tolerated_low_confidence(0.12) | benign(0.319) | TCGA-C5-A1BL-01 | Cervix | cervical & endocervical cancer | Female | <65 | I/II | Unknown | Unknown | SD | |
| ARHGEF19 | SNV | Missense_Mutation | novel | c.2356N>A | p.Glu786Lys | p.E786K | Q8IW93 | protein_coding | deleterious(0) | probably_damaging(0.99) | TCGA-C5-A1MH-01 | Cervix | cervical & endocervical cancer | Female | >=65 | III/IV | Chemotherapy | cisplatin | PD |
| ARHGEF19 | SNV | Missense_Mutation | novel | c.2345G>A | p.Arg782Gln | p.R782Q | Q8IW93 | protein_coding | tolerated(0.21) | possibly_damaging(0.611) | TCGA-DS-A1OB-01 | Cervix | cervical & endocervical cancer | Female | <65 | I/II | Chemotherapy | carboplatin | PD |
| ARHGEF19 | SNV | Missense_Mutation | rs781061684 | c.1772N>A | p.Arg591His | p.R591H | Q8IW93 | protein_coding | deleterious(0) | probably_damaging(0.993) | TCGA-A6-6780-01 | Colorectum | colon adenocarcinoma | Male | >=65 | I/II | Unknown | Unknown | SD |
| ARHGEF19 | SNV | Missense_Mutation | c.1357N>A | p.Asp453Asn | p.D453N | Q8IW93 | protein_coding | deleterious(0.02) | probably_damaging(0.969) | TCGA-A6-6780-01 | Colorectum | colon adenocarcinoma | Male | >=65 | I/II | Unknown | Unknown | SD |
| Page: 1 2 3 4 5 6 7 |
Top |
Related drugs of malignant transformation related genes |
| Identification of chemicals and drugs interact with genes involved in malignant transfromation |
| (DGIdb 4.0) |
| Entrez ID | Symbol | Category | Interaction Types | Drug Claim Name | Drug Name | PMIDs |
| Page: 1 |

Copyright 2023-Present -The University of Texas Health Science Center at Houston |