
|
|||||
|
 | |
| |
| |
| |
| |
| |
|
Gene: ARHGEF18 |
Gene summary for ARHGEF18 |
| Gene information | Species | Human | Gene symbol | ARHGEF18 | Gene ID | 23370 |
| Gene name | Rho/Rac guanine nucleotide exchange factor 18 | |
| Gene Alias | P114-RhoGEF | |
| Cytomap | 19p13.2 | |
| Gene Type | protein-coding | GO ID | GO:0000902 | UniProtAcc | Q6ZSZ5 |
Top |
Malignant transformation analysis |
| Identification of the aberrant gene expression in precancerous and cancerous lesions by comparing the gene expression of stem-like cells in diseased tissues with normal stem cells |
| Entrez ID | Symbol | Replicates | Species | Organ | Tissue | Adj P-value | Log2FC | Malignancy |
| 23370 | ARHGEF18 | RNA-P17T-P17T-4 | Human | Lung | IAC | 1.48e-03 | 4.85e-01 | 0.343 |
| 23370 | ARHGEF18 | RNA-P17T-P17T-6 | Human | Lung | IAC | 4.71e-02 | 4.21e-01 | 0.3385 |
| 23370 | ARHGEF18 | RNA-P18T-P18T-2 | Human | Lung | IAC | 1.16e-02 | 8.22e-01 | 0.1129 |
| 23370 | ARHGEF18 | RNA-P18T-P18T-6 | Human | Lung | IAC | 1.73e-02 | 8.27e-01 | 0.0856 |
| 23370 | ARHGEF18 | RNA-P25T1-P25T1-1 | Human | Lung | AIS | 1.03e-03 | 2.68e-01 | -0.2116 |
| 23370 | ARHGEF18 | RNA-P25T1-P25T1-2 | Human | Lung | AIS | 1.36e-03 | 4.61e-01 | -0.1941 |
| 23370 | ARHGEF18 | RNA-P25T1-P25T1-4 | Human | Lung | AIS | 3.15e-03 | 2.55e-01 | -0.2119 |
| 23370 | ARHGEF18 | RNA-P6T1-P6T1-1 | Human | Lung | MIAC | 2.66e-09 | 1.18e+00 | -0.0238 |
| 23370 | ARHGEF18 | RNA-P6T1-P6T1-2 | Human | Lung | MIAC | 1.77e-07 | 1.03e+00 | -0.0186 |
| 23370 | ARHGEF18 | RNA-P6T1-P6T1-3 | Human | Lung | MIAC | 2.21e-10 | 1.18e+00 | -0.0296 |
| 23370 | ARHGEF18 | RNA-P6T1-P6T1-4 | Human | Lung | MIAC | 2.95e-10 | 1.10e+00 | -0.0263 |
| 23370 | ARHGEF18 | RNA-P6T2-P6T2-1 | Human | Lung | IAC | 2.10e-09 | 3.46e-01 | -0.0166 |
| 23370 | ARHGEF18 | RNA-P6T2-P6T2-2 | Human | Lung | IAC | 6.53e-06 | 2.60e-01 | -0.0132 |
| 23370 | ARHGEF18 | RNA-P6T2-P6T2-3 | Human | Lung | IAC | 7.68e-08 | 2.85e-01 | -0.013 |
| 23370 | ARHGEF18 | RNA-P6T2-P6T2-4 | Human | Lung | IAC | 1.32e-08 | 3.30e-01 | -0.0121 |
| 23370 | ARHGEF18 | RNA-P7T1-P7T1-1 | Human | Lung | AIS | 2.37e-02 | 3.94e-01 | -0.0961 |
| 23370 | ARHGEF18 | RNA-P7T1-P7T1-2 | Human | Lung | AIS | 3.45e-03 | 3.44e-01 | -0.0876 |
| Page: 1 |
| Tissue | Expression Dynamics | Abbreviation |
| Lung | 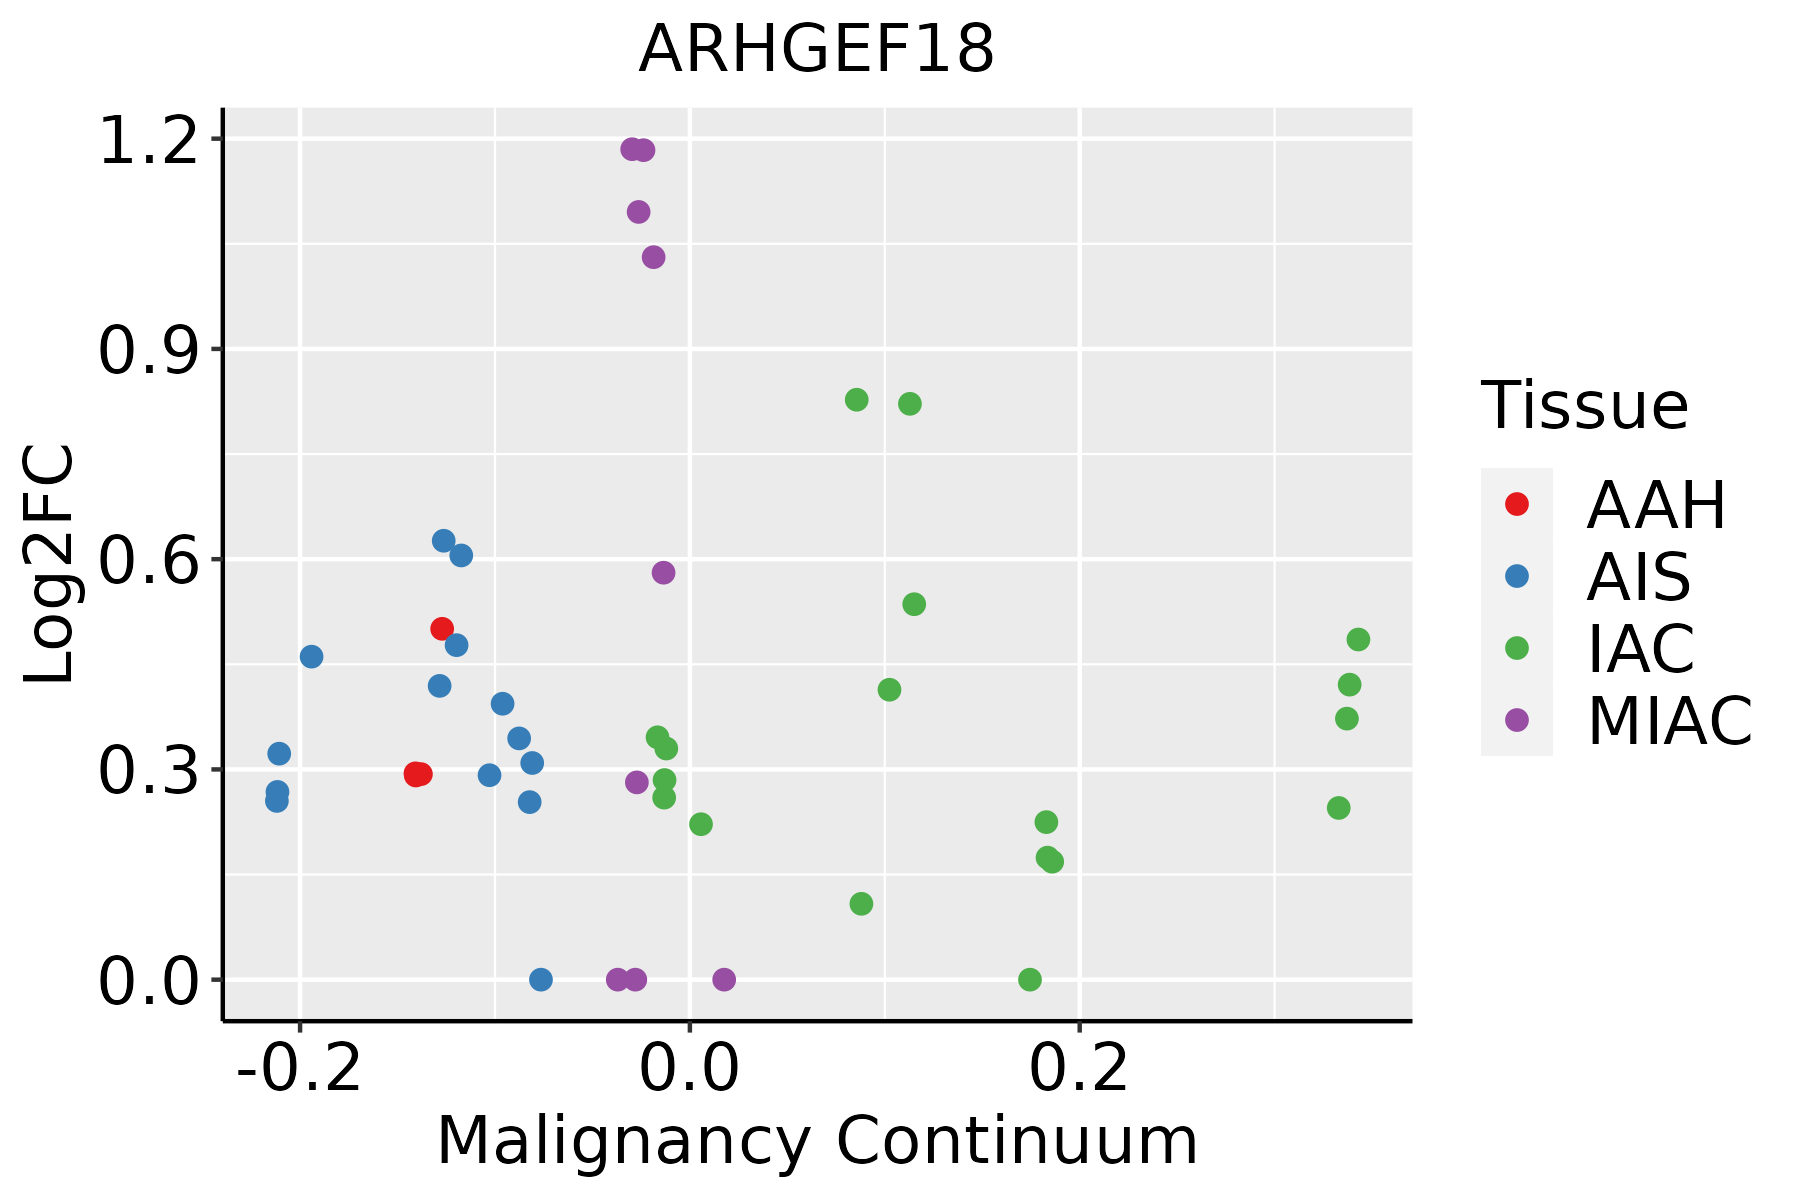 | AAH: Atypical adenomatous hyperplasia |
| AIS: Adenocarcinoma in situ | ||
| IAC: Invasive lung adenocarcinoma | ||
| MIA: Minimally invasive adenocarcinoma |
| ∗log2FC in expression of this searched gene in stem-like cells from each diseased tissue sample relative to stem-like cells in normal samples in each tissue plotted against the malignancy continuum. Samples are colored based on if they are from different disease stage. |
Top |
Malignant transformation related pathway analysis |
| Find out the enriched GO biological processes and KEGG pathways involved in transition from healthy to precancer to cancer |
| Tissue | Disease Stage | Enriched GO biological Processes |
| Colorectum | AD |  |
| Colorectum | SER |  |
| Colorectum | MSS |  |
| Colorectum | MSI-H |  |
| Colorectum | FAP |  |
| ∗Top 15 enriched GO BP terms are showed in the bar plot of each disease state in each tissue. Each row represents a significant GO biological process which is colored according to the -log10(p.adjust). |
| Page: 1 2 3 4 5 6 7 8 9 |
| GO ID | Tissue | Disease Stage | Description | Gene Ratio | Bg Ratio | pvalue | p.adjust | Count |
| GO:00226048 | Lung | IAC | regulation of cell morphogenesis | 74/2061 | 309/18723 | 6.31e-11 | 1.70e-08 | 74 |
| GO:00510565 | Lung | IAC | regulation of small GTPase mediated signal transduction | 70/2061 | 302/18723 | 9.44e-10 | 1.87e-07 | 70 |
| GO:00070158 | Lung | IAC | actin filament organization | 92/2061 | 442/18723 | 1.01e-09 | 1.93e-07 | 92 |
| GO:00510178 | Lung | IAC | actin filament bundle assembly | 40/2061 | 157/18723 | 2.66e-07 | 2.14e-05 | 40 |
| GO:00310327 | Lung | IAC | actomyosin structure organization | 46/2061 | 196/18723 | 4.70e-07 | 3.10e-05 | 46 |
| GO:00329708 | Lung | IAC | regulation of actin filament-based process | 77/2061 | 397/18723 | 4.85e-07 | 3.10e-05 | 77 |
| GO:00615728 | Lung | IAC | actin filament bundle organization | 40/2061 | 161/18723 | 5.43e-07 | 3.32e-05 | 40 |
| GO:00329568 | Lung | IAC | regulation of actin cytoskeleton organization | 70/2061 | 358/18723 | 1.17e-06 | 6.20e-05 | 70 |
| GO:00106398 | Lung | IAC | negative regulation of organelle organization | 68/2061 | 348/18723 | 1.69e-06 | 8.24e-05 | 68 |
| GO:19029038 | Lung | IAC | regulation of supramolecular fiber organization | 73/2061 | 383/18723 | 1.87e-06 | 8.87e-05 | 73 |
| GO:00083607 | Lung | IAC | regulation of cell shape | 37/2061 | 154/18723 | 3.35e-06 | 1.42e-04 | 37 |
| GO:00072655 | Lung | IAC | Ras protein signal transduction | 65/2061 | 337/18723 | 4.48e-06 | 1.81e-04 | 65 |
| GO:00514947 | Lung | IAC | negative regulation of cytoskeleton organization | 38/2061 | 163/18723 | 5.35e-06 | 2.08e-04 | 38 |
| GO:00322318 | Lung | IAC | regulation of actin filament bundle assembly | 28/2061 | 105/18723 | 6.21e-06 | 2.30e-04 | 28 |
| GO:00300388 | Lung | IAC | contractile actin filament bundle assembly | 28/2061 | 106/18723 | 7.56e-06 | 2.64e-04 | 28 |
| GO:00431498 | Lung | IAC | stress fiber assembly | 28/2061 | 106/18723 | 7.56e-06 | 2.64e-04 | 28 |
| GO:00322323 | Lung | IAC | negative regulation of actin filament bundle assembly | 14/2061 | 35/18723 | 9.02e-06 | 3.02e-04 | 14 |
| GO:00514973 | Lung | IAC | negative regulation of stress fiber assembly | 13/2061 | 32/18723 | 1.54e-05 | 4.49e-04 | 13 |
| GO:01100208 | Lung | IAC | regulation of actomyosin structure organization | 26/2061 | 100/18723 | 2.14e-05 | 5.98e-04 | 26 |
| GO:01100538 | Lung | IAC | regulation of actin filament organization | 54/2061 | 278/18723 | 2.27e-05 | 6.28e-04 | 54 |
| Page: 1 2 3 4 |
| Pathway ID | Tissue | Disease Stage | Description | Gene Ratio | Bg Ratio | pvalue | p.adjust | qvalue | Count |
| hsa0453016 | Lung | IAC | Tight junction | 43/1053 | 169/8465 | 2.44e-06 | 8.81e-05 | 5.85e-05 | 43 |
| hsa0453017 | Lung | IAC | Tight junction | 43/1053 | 169/8465 | 2.44e-06 | 8.81e-05 | 5.85e-05 | 43 |
| hsa0453023 | Lung | AIS | Tight junction | 46/961 | 169/8465 | 7.79e-09 | 4.33e-07 | 2.77e-07 | 46 |
| hsa0453033 | Lung | AIS | Tight junction | 46/961 | 169/8465 | 7.79e-09 | 4.33e-07 | 2.77e-07 | 46 |
| hsa0453063 | Lung | MIAC | Tight junction | 22/507 | 169/8465 | 4.53e-04 | 7.32e-03 | 5.30e-03 | 22 |
| hsa0453073 | Lung | MIAC | Tight junction | 22/507 | 169/8465 | 4.53e-04 | 7.32e-03 | 5.30e-03 | 22 |
| Page: 1 |
Top |
Cell-cell communication analysis |
| Identification of potential cell-cell interactions between two cell types and their ligand-receptor pairs for different disease states |
| Ligand | Receptor | LRpair | Pathway | Tissue | Disease Stage |
| Page: 1 |
Top |
Single-cell gene regulatory network inference analysis |
| Find out the significant the regulons (TFs) and the target genes of each regulon across cell types for different disease states |
| TF | Cell Type | Tissue | Disease Stage | Target Gene | RSS | Regulon Activity |
| ∗The dot plots of a searched regulon are shown for all cell subpopulations in each disease state of each tissue based on the regulon specific score inferred using pySCENIC and by calculating the average expression. |
| Page: 1 |
Top |
Somatic mutation of malignant transformation related genes |
| Annotation of somatic variants for genes involved in malignant transformation |
| Hugo Symbol | Variant Class | Variant Classification | dbSNP RS | HGVSc | HGVSp | HGVSp Short | SWISSPROT | BIOTYPE | SIFT | PolyPhen | Tumor Sample Barcode | Tissue | Histology | Sex | Age | Stage | Therapy Types | Drugs | Outcome |
| ARHGEF18 | SNV | Missense_Mutation | novel | c.1078N>C | p.Glu360Gln | p.E360Q | Q6ZSZ5 | protein_coding | tolerated(0.12) | benign(0.062) | TCGA-BH-A2L8-01 | Breast | breast invasive carcinoma | Female | <65 | I/II | Chemotherapy | cytoxan | CR |
| ARHGEF18 | SNV | Missense_Mutation | c.1292C>A | p.Ala431Asp | p.A431D | Q6ZSZ5 | protein_coding | tolerated(0.06) | benign(0.06) | TCGA-C8-A26X-01 | Breast | breast invasive carcinoma | Female | <65 | I/II | Chemotherapy | 5-fluorouracil | CR | |
| ARHGEF18 | insertion | In_Frame_Ins | novel | c.755_756insTCCCCACCCCCC | p.Lys252delinsAsnProHisProPro | p.K252delinsNPHPP | Q6ZSZ5 | protein_coding | TCGA-A8-A09C-01 | Breast | breast invasive carcinoma | Female | >=65 | I/II | Unknown | Unknown | SD | ||
| ARHGEF18 | insertion | Frame_Shift_Ins | novel | c.756_757insCCCCC | p.Gln253ProfsTer8 | p.Q253Pfs*8 | Q6ZSZ5 | protein_coding | TCGA-A8-A09C-01 | Breast | breast invasive carcinoma | Female | >=65 | I/II | Unknown | Unknown | SD | ||
| ARHGEF18 | insertion | Frame_Shift_Ins | novel | c.1961_1962insT | p.Glu655ArgfsTer69 | p.E655Rfs*69 | Q6ZSZ5 | protein_coding | TCGA-A8-A0A1-01 | Breast | breast invasive carcinoma | Female | >=65 | I/II | Hormone Therapy | tamoxiphen | SD | ||
| ARHGEF18 | SNV | Missense_Mutation | rs775135579 | c.1068N>C | p.Glu356Asp | p.E356D | Q6ZSZ5 | protein_coding | tolerated(0.17) | benign(0.02) | TCGA-C5-A8XK-01 | Cervix | cervical & endocervical cancer | Female | <65 | I/II | Chemotherapy | cisplatin | SD |
| ARHGEF18 | SNV | Missense_Mutation | c.2064N>C | p.Met688Ile | p.M688I | Q6ZSZ5 | protein_coding | tolerated(0.78) | benign(0.001) | TCGA-DS-A0VM-01 | Cervix | cervical & endocervical cancer | Female | <65 | I/II | Chemotherapy | cisplatin | PD | |
| ARHGEF18 | SNV | Missense_Mutation | novel | c.2220C>G | p.Phe740Leu | p.F740L | Q6ZSZ5 | protein_coding | tolerated(0.56) | benign(0) | TCGA-IR-A3LH-01 | Cervix | cervical & endocervical cancer | Female | <65 | I/II | Chemotherapy | cisplatin | CR |
| ARHGEF18 | SNV | Missense_Mutation | c.2200N>T | p.Pro734Ser | p.P734S | Q6ZSZ5 | protein_coding | tolerated(0.17) | benign(0) | TCGA-IR-A3LI-01 | Cervix | cervical & endocervical cancer | Female | <65 | I/II | Chemotherapy | cisplatin | CR | |
| ARHGEF18 | SNV | Missense_Mutation | novel | c.1680N>C | p.Glu560Asp | p.E560D | Q6ZSZ5 | protein_coding | tolerated(0.06) | benign(0.269) | TCGA-ZJ-AAXU-01 | Cervix | cervical & endocervical cancer | Female | <65 | I/II | Unknown | Unknown | SD |
| Page: 1 2 3 4 5 6 7 8 9 10 11 |
Top |
Related drugs of malignant transformation related genes |
| Identification of chemicals and drugs interact with genes involved in malignant transfromation |
| (DGIdb 4.0) |
| Entrez ID | Symbol | Category | Interaction Types | Drug Claim Name | Drug Name | PMIDs |
| Page: 1 |

Copyright 2023-Present -The University of Texas Health Science Center at Houston |