
|
|||||
|
 | |
| |
| |
| |
| |
| |
|
Gene: ARHGEF16 |
Gene summary for ARHGEF16 |
| Gene information | Species | Human | Gene symbol | ARHGEF16 | Gene ID | 27237 |
| Gene name | Rho guanine nucleotide exchange factor 16 | |
| Gene Alias | GEF16 | |
| Cytomap | 1p36.32 | |
| Gene Type | protein-coding | GO ID | GO:0006928 | UniProtAcc | B3KTS4 |
Top |
Malignant transformation analysis |
| Identification of the aberrant gene expression in precancerous and cancerous lesions by comparing the gene expression of stem-like cells in diseased tissues with normal stem cells |
| Entrez ID | Symbol | Replicates | Species | Organ | Tissue | Adj P-value | Log2FC | Malignancy |
| 27237 | ARHGEF16 | LZE4T | Human | Esophagus | ESCC | 3.44e-02 | 4.36e-02 | 0.0811 |
| 27237 | ARHGEF16 | LZE8T | Human | Esophagus | ESCC | 5.63e-11 | 3.21e-01 | 0.067 |
| 27237 | ARHGEF16 | LZE20T | Human | Esophagus | ESCC | 2.23e-02 | 2.15e-01 | 0.0662 |
| 27237 | ARHGEF16 | LZE22T | Human | Esophagus | ESCC | 4.36e-02 | 4.34e-01 | 0.068 |
| 27237 | ARHGEF16 | LZE24T | Human | Esophagus | ESCC | 1.61e-05 | 5.04e-02 | 0.0596 |
| 27237 | ARHGEF16 | P1T-E | Human | Esophagus | ESCC | 3.21e-06 | 3.09e-01 | 0.0875 |
| 27237 | ARHGEF16 | P2T-E | Human | Esophagus | ESCC | 7.94e-19 | 3.38e-01 | 0.1177 |
| 27237 | ARHGEF16 | P4T-E | Human | Esophagus | ESCC | 5.14e-14 | 4.25e-01 | 0.1323 |
| 27237 | ARHGEF16 | P5T-E | Human | Esophagus | ESCC | 3.56e-08 | 1.47e-01 | 0.1327 |
| 27237 | ARHGEF16 | P8T-E | Human | Esophagus | ESCC | 6.66e-23 | 3.32e-01 | 0.0889 |
| 27237 | ARHGEF16 | P9T-E | Human | Esophagus | ESCC | 2.63e-11 | 1.26e-01 | 0.1131 |
| 27237 | ARHGEF16 | P10T-E | Human | Esophagus | ESCC | 8.90e-19 | 4.01e-01 | 0.116 |
| 27237 | ARHGEF16 | P12T-E | Human | Esophagus | ESCC | 3.58e-07 | 1.13e-01 | 0.1122 |
| 27237 | ARHGEF16 | P15T-E | Human | Esophagus | ESCC | 4.98e-25 | 7.52e-01 | 0.1149 |
| 27237 | ARHGEF16 | P16T-E | Human | Esophagus | ESCC | 3.71e-13 | 1.96e-01 | 0.1153 |
| 27237 | ARHGEF16 | P17T-E | Human | Esophagus | ESCC | 3.35e-04 | 2.13e-01 | 0.1278 |
| 27237 | ARHGEF16 | P20T-E | Human | Esophagus | ESCC | 5.72e-04 | 2.18e-01 | 0.1124 |
| 27237 | ARHGEF16 | P21T-E | Human | Esophagus | ESCC | 1.17e-10 | 2.54e-01 | 0.1617 |
| 27237 | ARHGEF16 | P22T-E | Human | Esophagus | ESCC | 2.24e-15 | 2.05e-01 | 0.1236 |
| 27237 | ARHGEF16 | P23T-E | Human | Esophagus | ESCC | 6.64e-06 | 5.51e-02 | 0.108 |
| Page: 1 2 3 4 |
| Tissue | Expression Dynamics | Abbreviation |
| Esophagus | 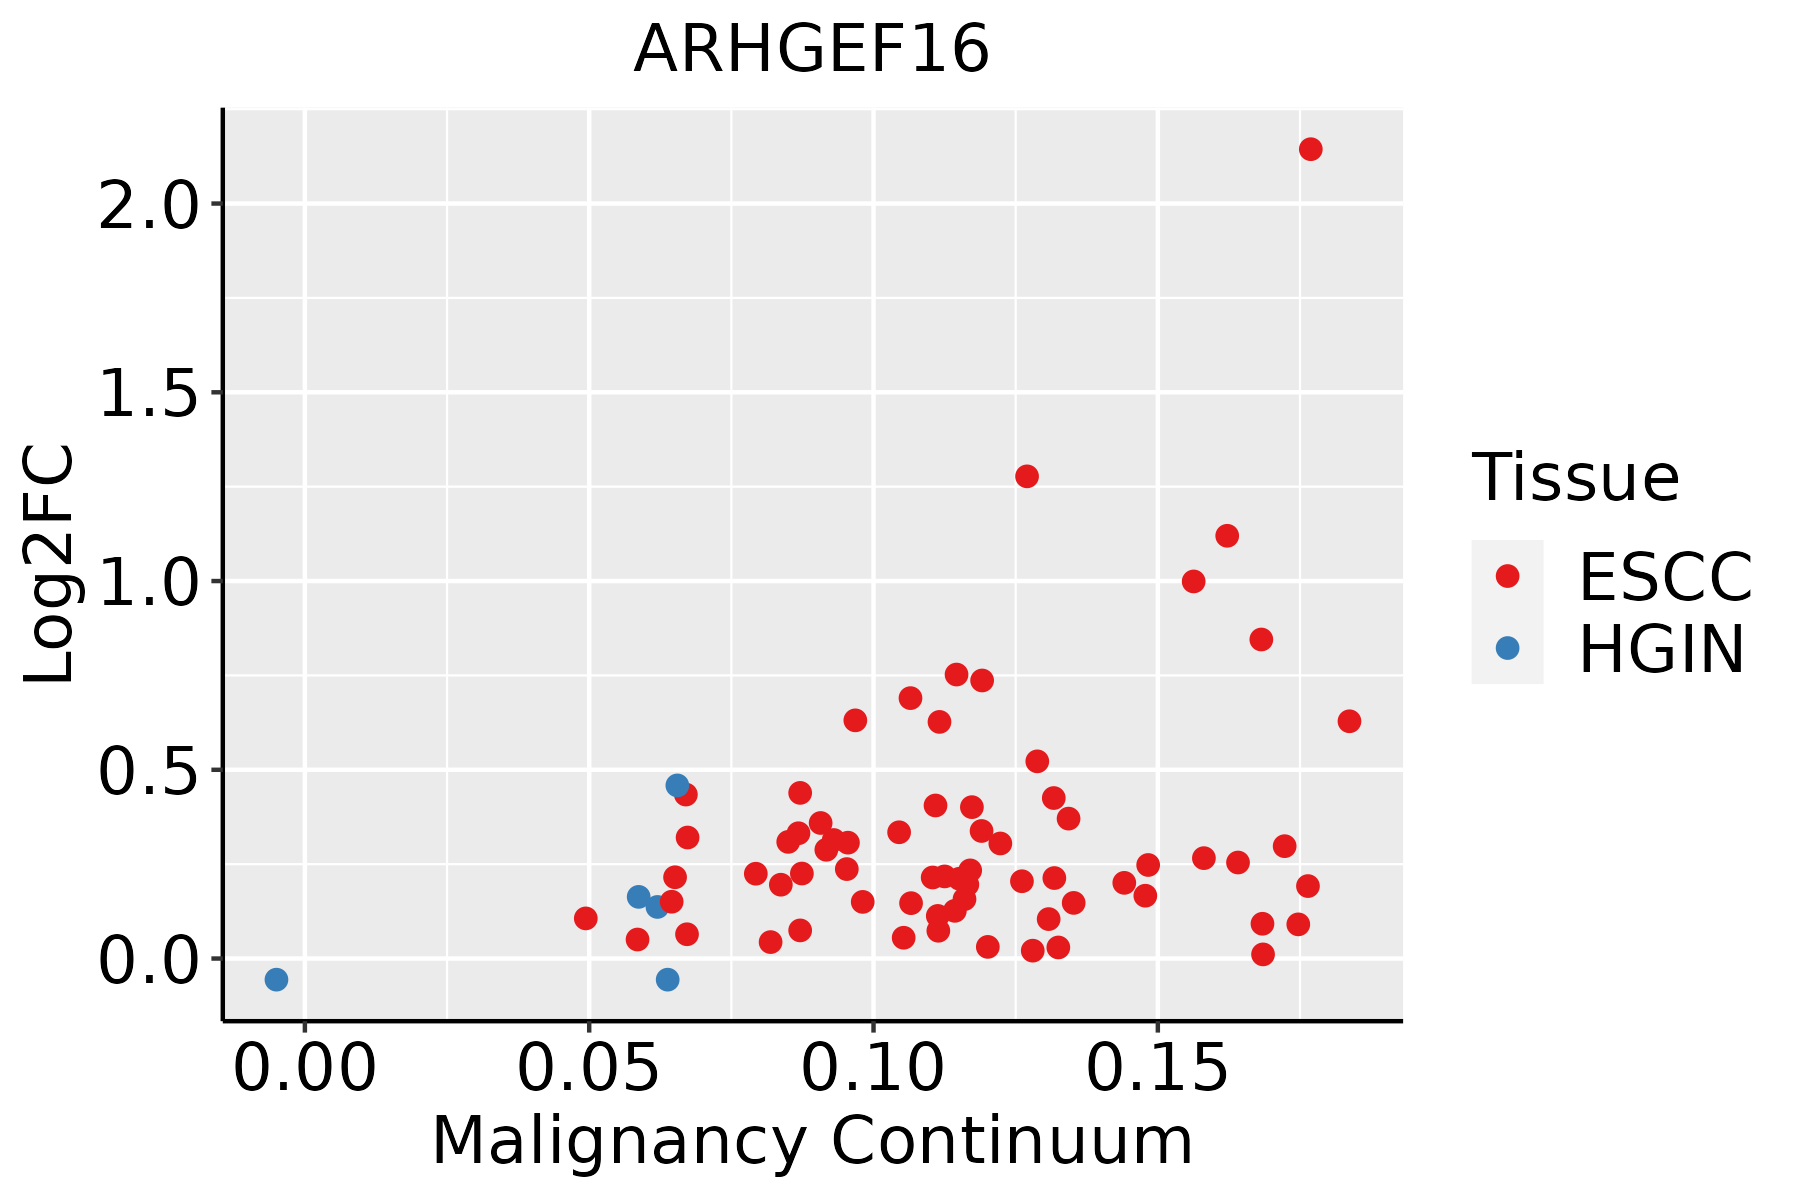 | ESCC: Esophageal squamous cell carcinoma |
| HGIN: High-grade intraepithelial neoplasias | ||
| LGIN: Low-grade intraepithelial neoplasias | ||
| Oral Cavity | 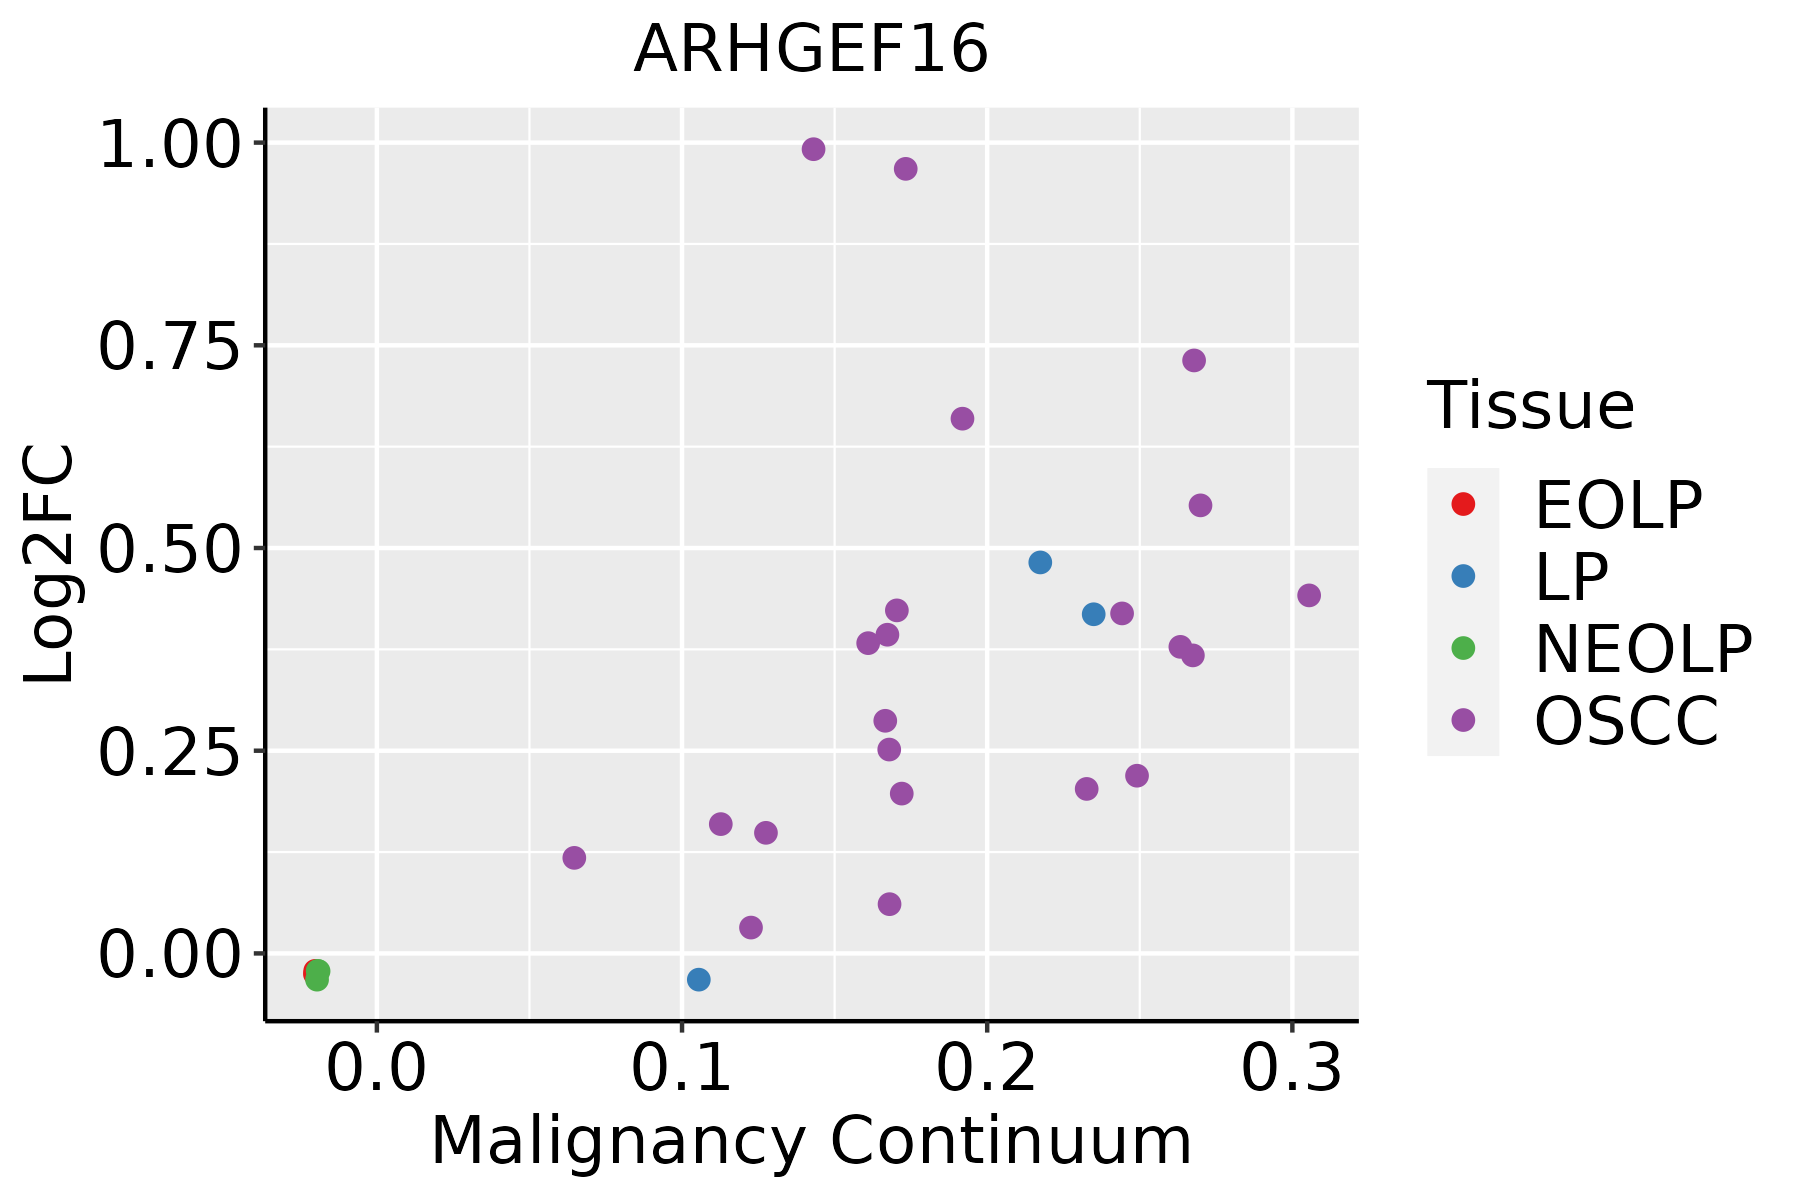 | EOLP: Erosive Oral lichen planus |
| LP: leukoplakia | ||
| NEOLP: Non-erosive oral lichen planus | ||
| OSCC: Oral squamous cell carcinoma | ||
| Skin | 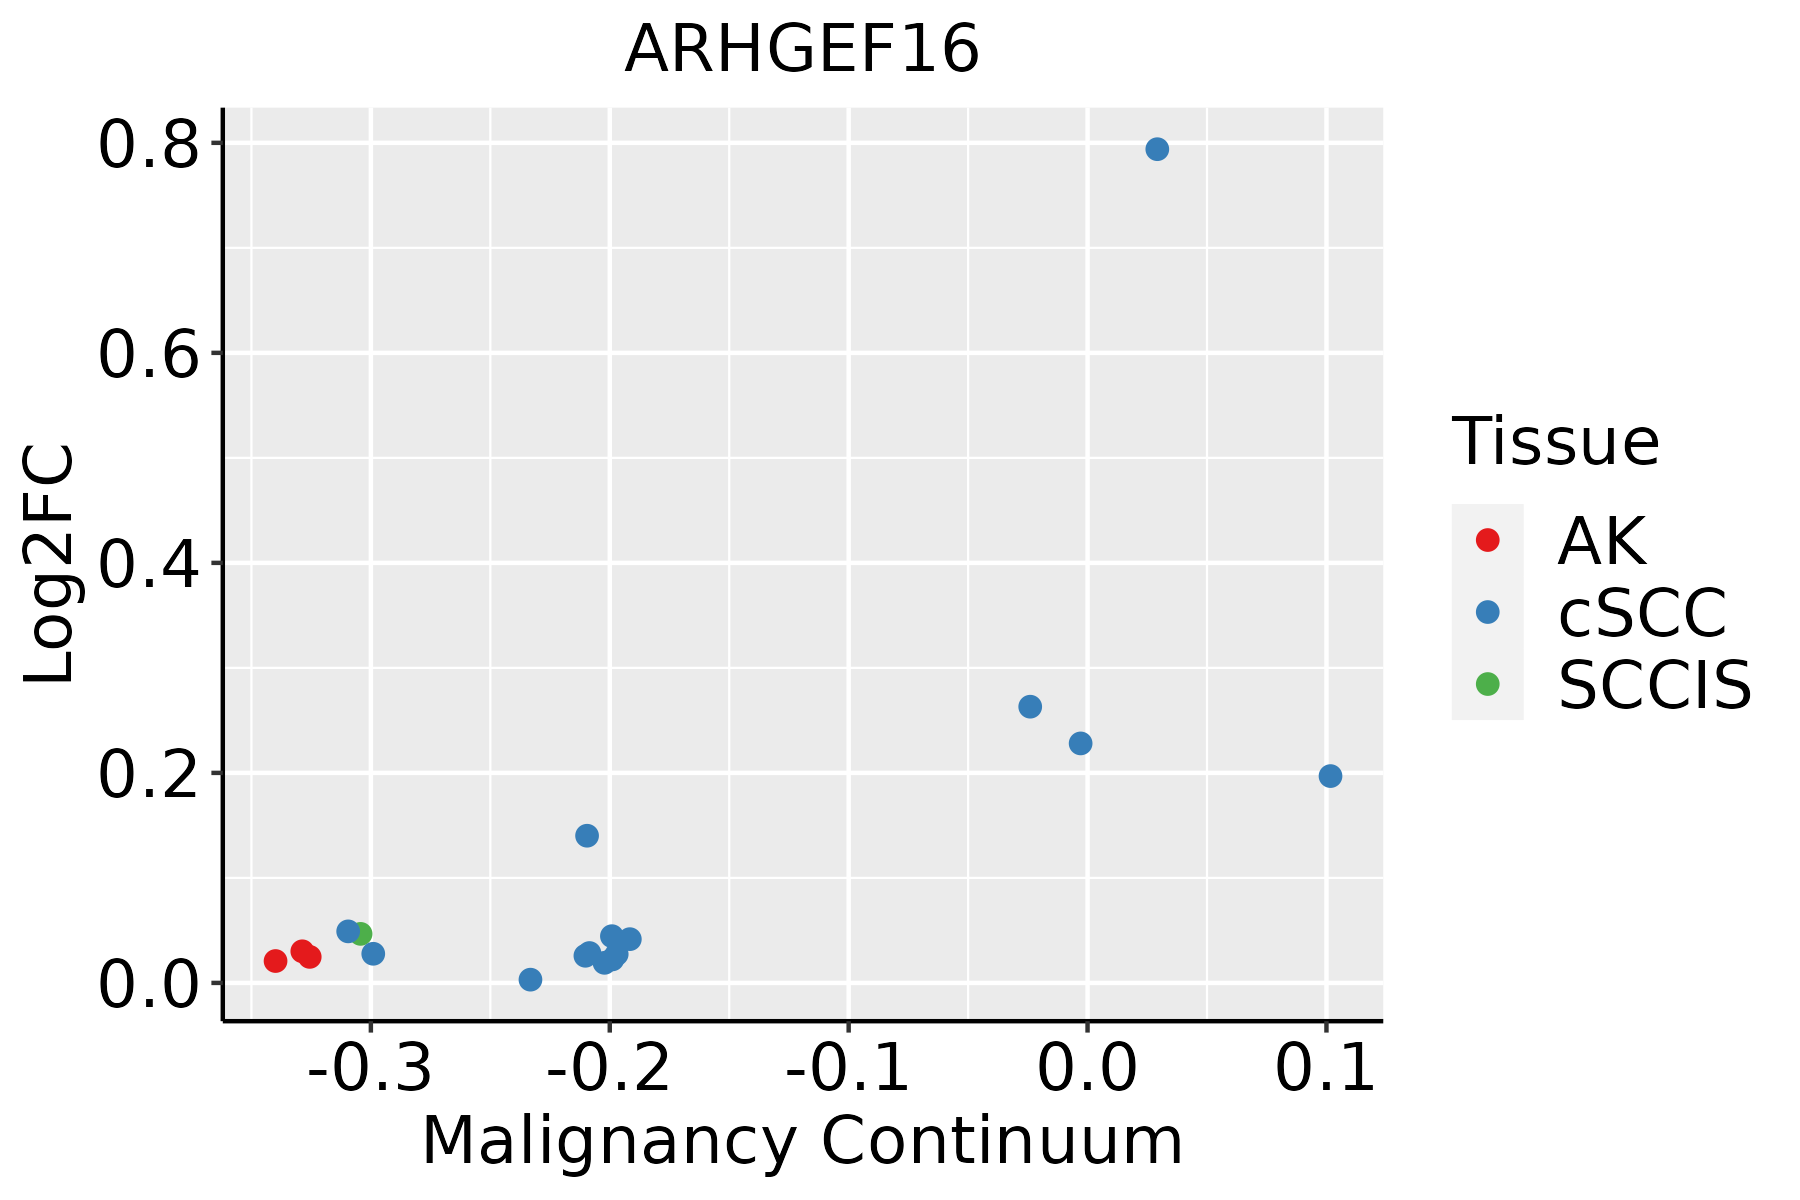 | AK: Actinic keratosis |
| cSCC: Cutaneous squamous cell carcinoma | ||
| SCCIS:squamous cell carcinoma in situ |
| ∗log2FC in expression of this searched gene in stem-like cells from each diseased tissue sample relative to stem-like cells in normal samples in each tissue plotted against the malignancy continuum. Samples are colored based on if they are from different disease stage. |
Top |
Malignant transformation related pathway analysis |
| Find out the enriched GO biological processes and KEGG pathways involved in transition from healthy to precancer to cancer |
| Tissue | Disease Stage | Enriched GO biological Processes |
| Colorectum | AD |  |
| Colorectum | SER |  |
| Colorectum | MSS |  |
| Colorectum | MSI-H |  |
| Colorectum | FAP |  |
| ∗Top 15 enriched GO BP terms are showed in the bar plot of each disease state in each tissue. Each row represents a significant GO biological process which is colored according to the -log10(p.adjust). |
| Page: 1 2 3 4 5 6 7 8 9 |
| GO ID | Tissue | Disease Stage | Description | Gene Ratio | Bg Ratio | pvalue | p.adjust | Count |
| GO:1903829111 | Esophagus | ESCC | positive regulation of cellular protein localization | 199/8552 | 276/18723 | 2.99e-19 | 3.45e-17 | 199 |
| GO:0072659110 | Esophagus | ESCC | protein localization to plasma membrane | 193/8552 | 284/18723 | 1.95e-14 | 1.03e-12 | 193 |
| GO:199077819 | Esophagus | ESCC | protein localization to cell periphery | 217/8552 | 333/18723 | 4.08e-13 | 1.88e-11 | 217 |
| GO:190547519 | Esophagus | ESCC | regulation of protein localization to membrane | 117/8552 | 175/18723 | 1.14e-08 | 2.26e-07 | 117 |
| GO:190437519 | Esophagus | ESCC | regulation of protein localization to cell periphery | 85/8552 | 125/18723 | 3.63e-07 | 5.06e-06 | 85 |
| GO:1903076110 | Esophagus | ESCC | regulation of protein localization to plasma membrane | 72/8552 | 104/18723 | 9.74e-07 | 1.23e-05 | 72 |
| GO:190547719 | Esophagus | ESCC | positive regulation of protein localization to membrane | 73/8552 | 106/18723 | 1.13e-06 | 1.40e-05 | 73 |
| GO:190437719 | Esophagus | ESCC | positive regulation of protein localization to cell periphery | 47/8552 | 69/18723 | 1.37e-04 | 9.27e-04 | 47 |
| GO:190307817 | Esophagus | ESCC | positive regulation of protein localization to plasma membrane | 43/8552 | 62/18723 | 1.38e-04 | 9.35e-04 | 43 |
| GO:004308715 | Esophagus | ESCC | regulation of GTPase activity | 183/8552 | 348/18723 | 5.34e-03 | 2.00e-02 | 183 |
| GO:190382920 | Oral cavity | OSCC | positive regulation of cellular protein localization | 179/7305 | 276/18723 | 2.20e-18 | 2.41e-16 | 179 |
| GO:007265918 | Oral cavity | OSCC | protein localization to plasma membrane | 169/7305 | 284/18723 | 1.69e-12 | 7.21e-11 | 169 |
| GO:199077816 | Oral cavity | OSCC | protein localization to cell periphery | 190/7305 | 333/18723 | 1.46e-11 | 5.13e-10 | 190 |
| GO:190547516 | Oral cavity | OSCC | regulation of protein localization to membrane | 105/7305 | 175/18723 | 1.42e-08 | 2.85e-07 | 105 |
| GO:190437516 | Oral cavity | OSCC | regulation of protein localization to cell periphery | 78/7305 | 125/18723 | 9.80e-08 | 1.68e-06 | 78 |
| GO:190307617 | Oral cavity | OSCC | regulation of protein localization to plasma membrane | 67/7305 | 104/18723 | 1.34e-07 | 2.24e-06 | 67 |
| GO:190547716 | Oral cavity | OSCC | positive regulation of protein localization to membrane | 65/7305 | 106/18723 | 2.69e-06 | 3.32e-05 | 65 |
| GO:190437716 | Oral cavity | OSCC | positive regulation of protein localization to cell periphery | 43/7305 | 69/18723 | 7.43e-05 | 5.81e-04 | 43 |
| GO:190307815 | Oral cavity | OSCC | positive regulation of protein localization to plasma membrane | 39/7305 | 62/18723 | 1.19e-04 | 8.54e-04 | 39 |
| GO:004308710 | Oral cavity | OSCC | regulation of GTPase activity | 165/7305 | 348/18723 | 7.94e-04 | 4.27e-03 | 165 |
| Page: 1 2 |
| Pathway ID | Tissue | Disease Stage | Description | Gene Ratio | Bg Ratio | pvalue | p.adjust | qvalue | Count |
| Page: 1 |
Top |
Cell-cell communication analysis |
| Identification of potential cell-cell interactions between two cell types and their ligand-receptor pairs for different disease states |
| Ligand | Receptor | LRpair | Pathway | Tissue | Disease Stage |
| Page: 1 |
Top |
Single-cell gene regulatory network inference analysis |
| Find out the significant the regulons (TFs) and the target genes of each regulon across cell types for different disease states |
| TF | Cell Type | Tissue | Disease Stage | Target Gene | RSS | Regulon Activity |
| ∗The dot plots of a searched regulon are shown for all cell subpopulations in each disease state of each tissue based on the regulon specific score inferred using pySCENIC and by calculating the average expression. |
| Page: 1 |
Top |
Somatic mutation of malignant transformation related genes |
| Annotation of somatic variants for genes involved in malignant transformation |
| Hugo Symbol | Variant Class | Variant Classification | dbSNP RS | HGVSc | HGVSp | HGVSp Short | SWISSPROT | BIOTYPE | SIFT | PolyPhen | Tumor Sample Barcode | Tissue | Histology | Sex | Age | Stage | Therapy Types | Drugs | Outcome |
| ARHGEF16 | SNV | Missense_Mutation | novel | c.474N>A | p.Met158Ile | p.M158I | Q5VV41 | protein_coding | tolerated(0.14) | benign(0.005) | TCGA-5L-AAT1-01 | Breast | breast invasive carcinoma | Female | <65 | III/IV | Hormone Therapy | letrozol | SD |
| ARHGEF16 | SNV | Missense_Mutation | c.862N>A | p.Ala288Thr | p.A288T | Q5VV41 | protein_coding | deleterious(0.01) | probably_damaging(0.992) | TCGA-AN-A0FW-01 | Breast | breast invasive carcinoma | Female | >=65 | III/IV | Unknown | Unknown | SD | |
| ARHGEF16 | SNV | Missense_Mutation | c.743A>G | p.Asp248Gly | p.D248G | Q5VV41 | protein_coding | tolerated(0.12) | benign(0.01) | TCGA-AR-A1AI-01 | Breast | breast invasive carcinoma | Female | <65 | I/II | Chemotherapy | cytoxan | PD | |
| ARHGEF16 | SNV | Missense_Mutation | c.1997N>C | p.Leu666Pro | p.L666P | Q5VV41 | protein_coding | tolerated(0.06) | possibly_damaging(0.696) | TCGA-C8-A1HJ-01 | Breast | breast invasive carcinoma | Female | <65 | I/II | Unknown | Unknown | SD | |
| ARHGEF16 | insertion | Nonsense_Mutation | novel | c.478_479insACCCAACAGCTGATCCCTAAGA | p.Gly160AspfsTer7 | p.G160Dfs*7 | Q5VV41 | protein_coding | TCGA-A2-A0D1-01 | Breast | breast invasive carcinoma | Female | >=65 | I/II | Chemotherapy | taxotere | SD | ||
| ARHGEF16 | SNV | Missense_Mutation | novel | c.1778G>A | p.Gly593Asp | p.G593D | Q5VV41 | protein_coding | deleterious(0.02) | possibly_damaging(0.838) | TCGA-2W-A8YY-01 | Cervix | cervical & endocervical cancer | Female | <65 | I/II | Chemotherapy | cisplatin | CR |
| ARHGEF16 | SNV | Missense_Mutation | novel | c.2066G>A | p.Ser689Asn | p.S689N | Q5VV41 | protein_coding | tolerated(1) | benign(0.021) | TCGA-C5-A902-01 | Cervix | cervical & endocervical cancer | Female | <65 | I/II | Chemotherapy | cisplatin | SD |
| ARHGEF16 | SNV | Missense_Mutation | rs774950266 | c.1193T>C | p.Phe398Ser | p.F398S | Q5VV41 | protein_coding | deleterious(0) | probably_damaging(0.999) | TCGA-EA-A3HU-01 | Cervix | cervical & endocervical cancer | Female | <65 | I/II | Unknown | Unknown | SD |
| ARHGEF16 | SNV | Missense_Mutation | novel | c.134N>C | p.Arg45Thr | p.R45T | Q5VV41 | protein_coding | tolerated(0.33) | benign(0.023) | TCGA-MA-AA41-01 | Cervix | cervical & endocervical cancer | Female | <65 | I/II | Unknown | Unknown | SD |
| ARHGEF16 | SNV | Missense_Mutation | c.2093G>A | p.Arg698His | p.R698H | Q5VV41 | protein_coding | tolerated(0.06) | possibly_damaging(0.818) | TCGA-A6-2686-01 | Colorectum | colon adenocarcinoma | Female | >=65 | I/II | Unknown | Unknown | SD |
| Page: 1 2 3 4 5 |
Top |
Related drugs of malignant transformation related genes |
| Identification of chemicals and drugs interact with genes involved in malignant transfromation |
| (DGIdb 4.0) |
| Entrez ID | Symbol | Category | Interaction Types | Drug Claim Name | Drug Name | PMIDs |
| Page: 1 |

Copyright 2023-Present -The University of Texas Health Science Center at Houston |