| Tissue | Expression Dynamics | Abbreviation |
| Cervix | 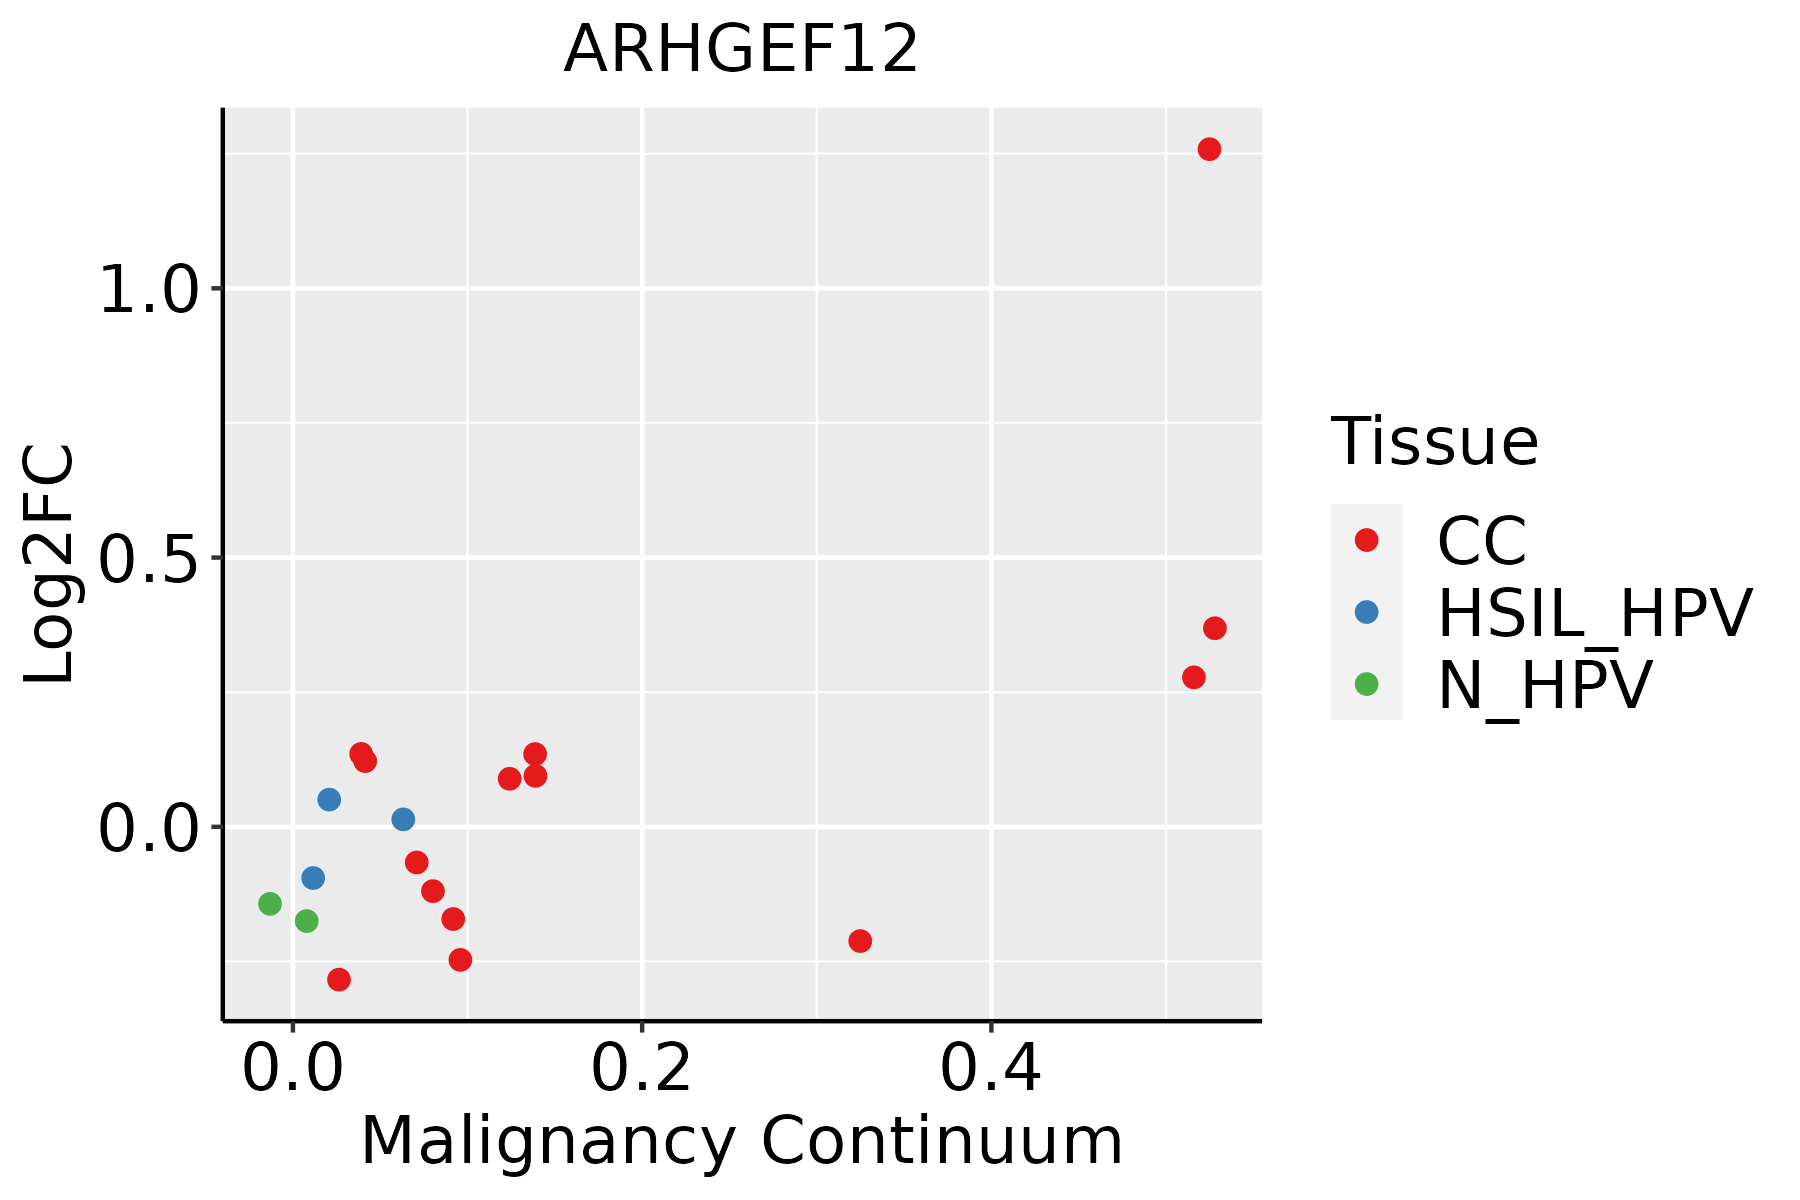 | CC: Cervix cancer |
| HSIL_HPV: HPV-infected high-grade squamous intraepithelial lesions |
| N_HPV: HPV-infected normal cervix |
| Colorectum (GSE201348) |  | FAP: Familial adenomatous polyposis |
| CRC: Colorectal cancer |
| Colorectum (HTA11) |  | AD: Adenomas |
| SER: Sessile serrated lesions |
| MSI-H: Microsatellite-high colorectal cancer |
| MSS: Microsatellite stable colorectal cancer |
| Esophagus | 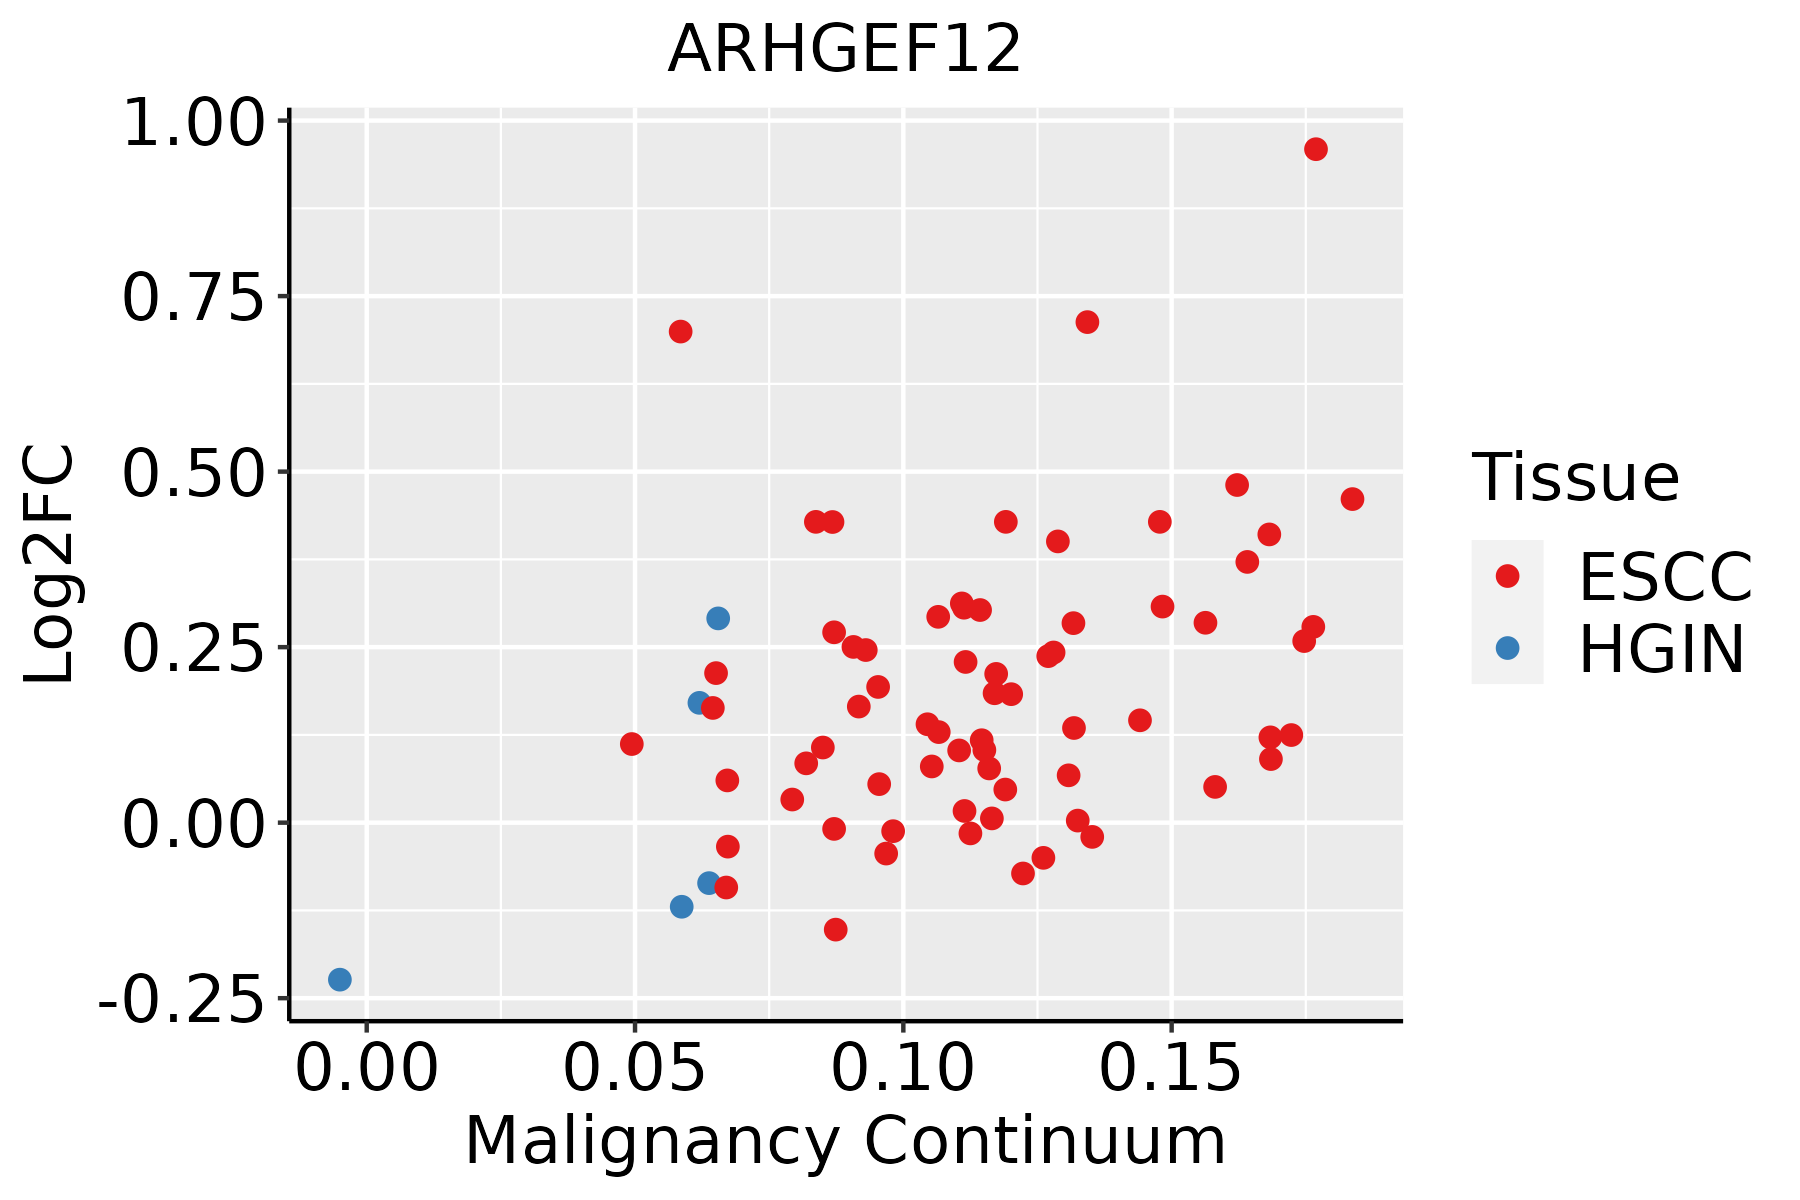 | ESCC: Esophageal squamous cell carcinoma |
| HGIN: High-grade intraepithelial neoplasias |
| LGIN: Low-grade intraepithelial neoplasias |
| Liver |  | HCC: Hepatocellular carcinoma |
| NAFLD: Non-alcoholic fatty liver disease |
| Lung | 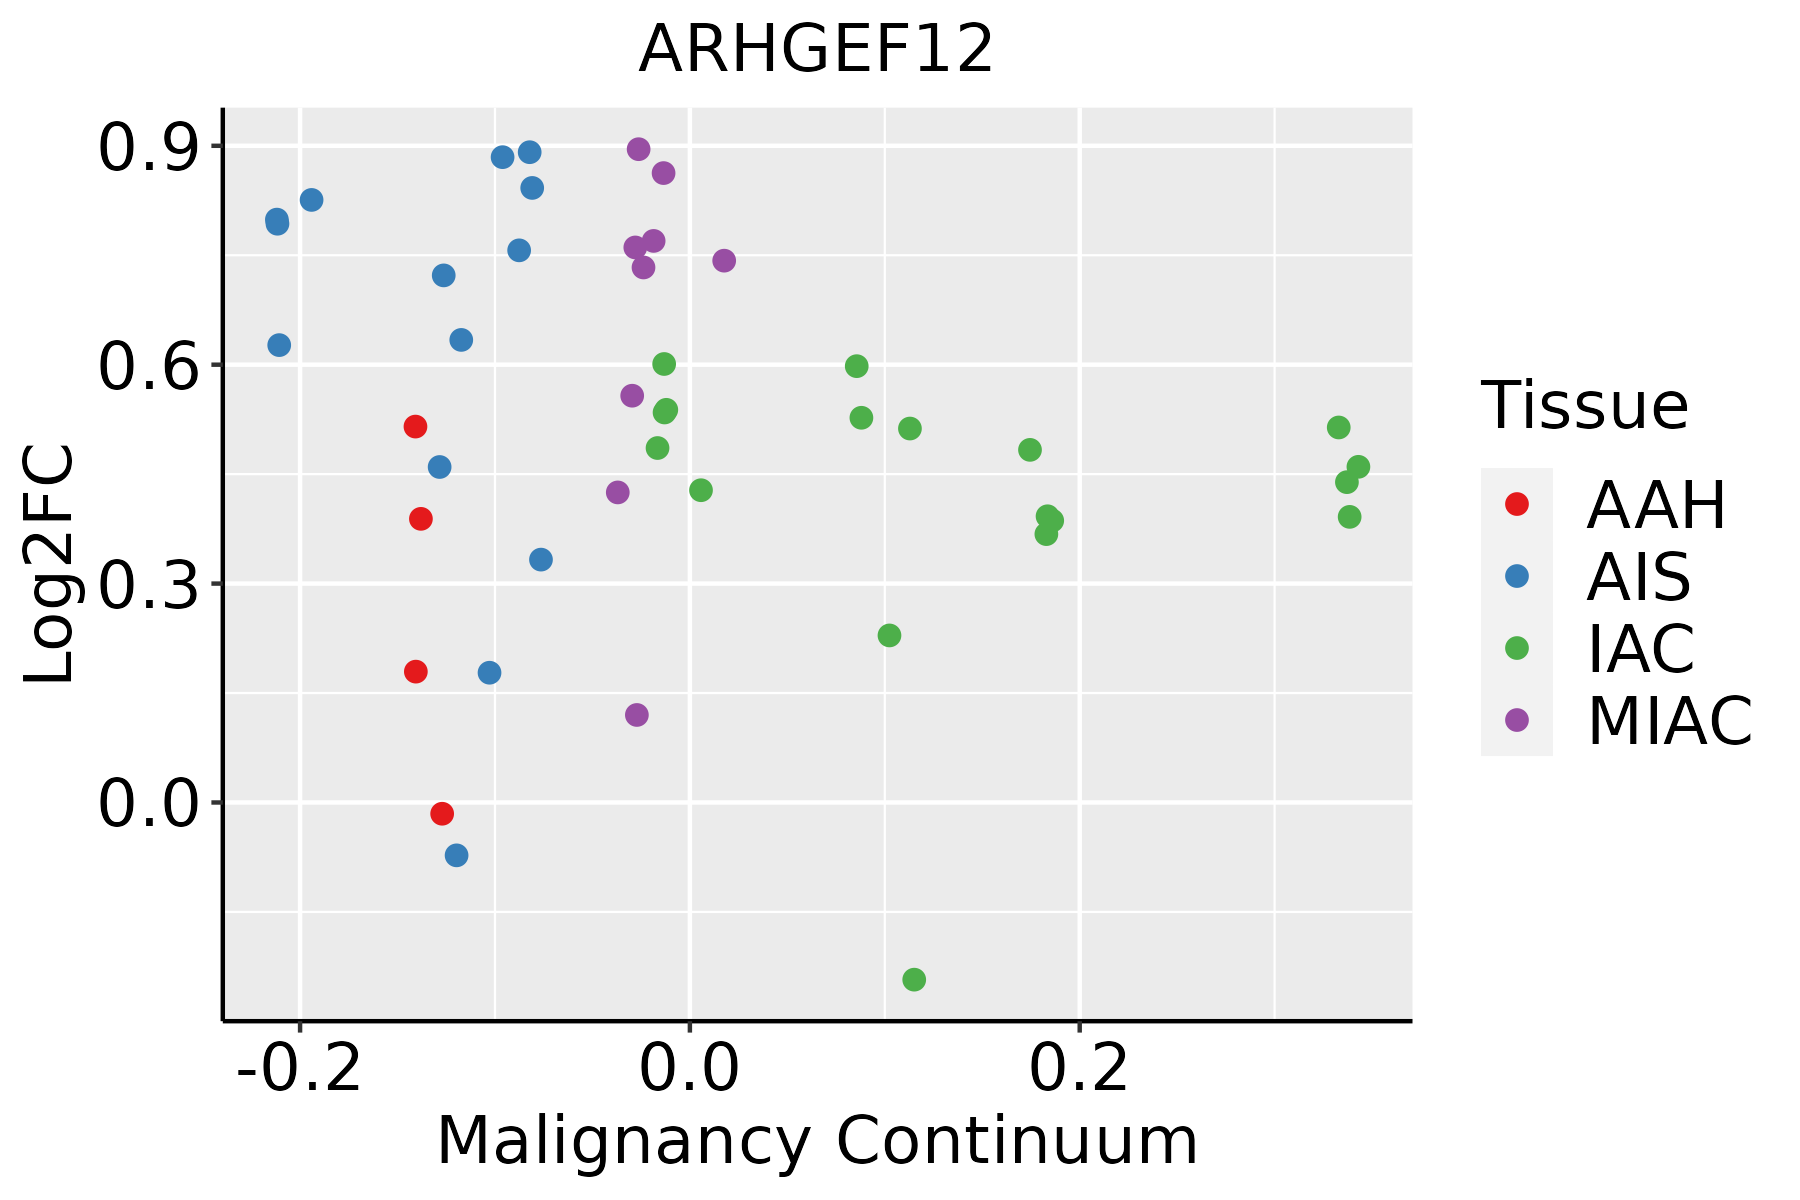 | AAH: Atypical adenomatous hyperplasia |
| AIS: Adenocarcinoma in situ |
| IAC: Invasive lung adenocarcinoma |
| MIA: Minimally invasive adenocarcinoma |
| Oral Cavity |  | EOLP: Erosive Oral lichen planus |
| LP: leukoplakia |
| NEOLP: Non-erosive oral lichen planus |
| OSCC: Oral squamous cell carcinoma |
| Prostate | 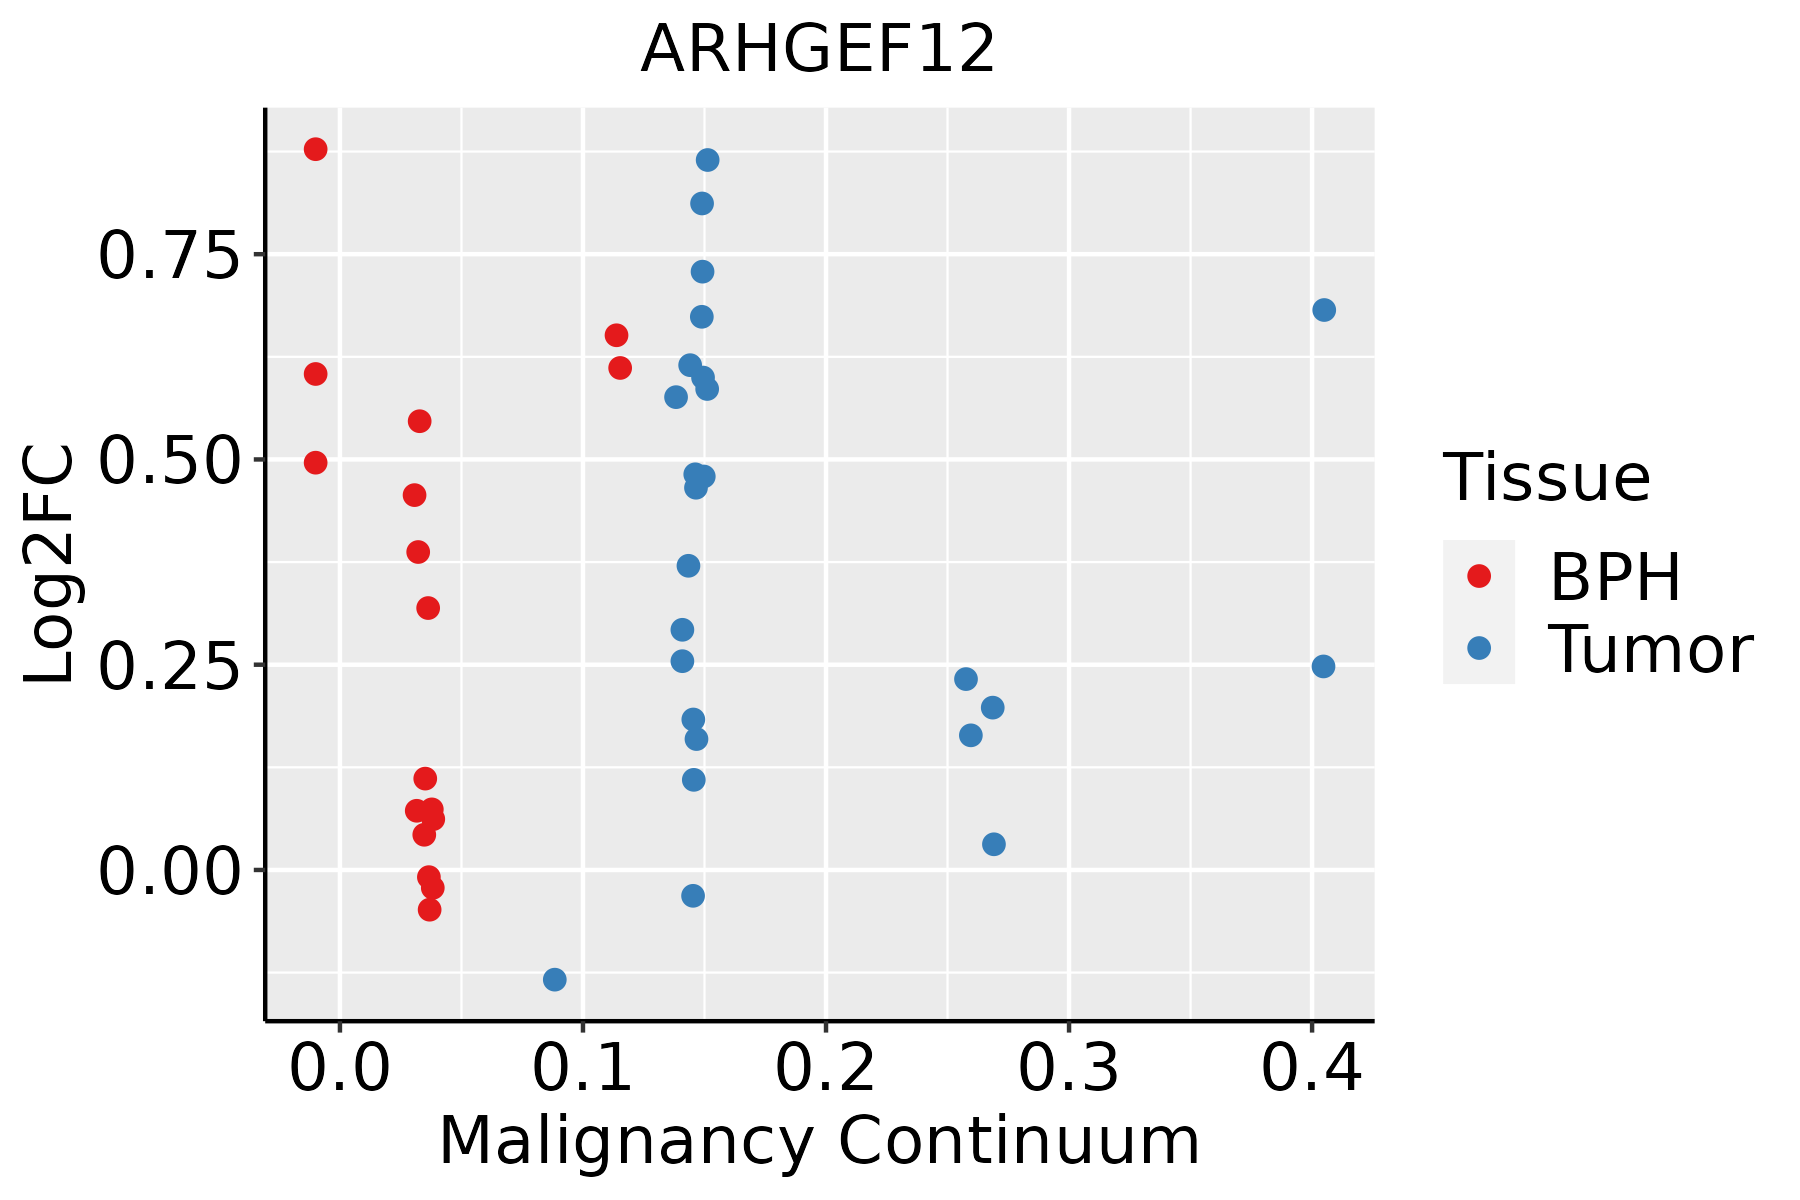 | BPH: Benign Prostatic Hyperplasia |
| Skin |  | AK: Actinic keratosis |
| cSCC: Cutaneous squamous cell carcinoma |
| SCCIS:squamous cell carcinoma in situ |
| Thyroid |  | ATC: Anaplastic thyroid cancer |
| HT: Hashimoto's thyroiditis |
| PTC: Papillary thyroid cancer |
| GO ID | Tissue | Disease Stage | Description | Gene Ratio | Bg Ratio | pvalue | p.adjust | Count |
| GO:00510566 | Cervix | CC | regulation of small GTPase mediated signal transduction | 75/2311 | 302/18723 | 1.54e-09 | 1.74e-07 | 75 |
| GO:00072656 | Cervix | CC | Ras protein signal transduction | 79/2311 | 337/18723 | 9.49e-09 | 7.77e-07 | 79 |
| GO:00072666 | Cervix | CC | Rho protein signal transduction | 35/2311 | 137/18723 | 1.77e-05 | 3.33e-04 | 35 |
| GO:0007265 | Colorectum | AD | Ras protein signal transduction | 104/3918 | 337/18723 | 1.01e-05 | 2.35e-04 | 104 |
| GO:0051056 | Colorectum | AD | regulation of small GTPase mediated signal transduction | 94/3918 | 302/18723 | 1.81e-05 | 3.76e-04 | 94 |
| GO:0007266 | Colorectum | AD | Rho protein signal transduction | 42/3918 | 137/18723 | 4.64e-03 | 3.16e-02 | 42 |
| GO:00072651 | Colorectum | MSS | Ras protein signal transduction | 91/3467 | 337/18723 | 7.20e-05 | 1.21e-03 | 91 |
| GO:00510561 | Colorectum | MSS | regulation of small GTPase mediated signal transduction | 82/3467 | 302/18723 | 1.31e-04 | 1.99e-03 | 82 |
| GO:00510562 | Colorectum | FAP | regulation of small GTPase mediated signal transduction | 78/2622 | 302/18723 | 3.25e-08 | 2.85e-06 | 78 |
| GO:00072652 | Colorectum | FAP | Ras protein signal transduction | 80/2622 | 337/18723 | 9.61e-07 | 4.33e-05 | 80 |
| GO:00072661 | Colorectum | FAP | Rho protein signal transduction | 34/2622 | 137/18723 | 5.11e-04 | 5.82e-03 | 34 |
| GO:00510563 | Colorectum | CRC | regulation of small GTPase mediated signal transduction | 69/2078 | 302/18723 | 3.34e-09 | 9.08e-07 | 69 |
| GO:00072653 | Colorectum | CRC | Ras protein signal transduction | 70/2078 | 337/18723 | 1.49e-07 | 1.66e-05 | 70 |
| GO:00072662 | Colorectum | CRC | Rho protein signal transduction | 28/2078 | 137/18723 | 9.97e-04 | 1.19e-02 | 28 |
| GO:000726510 | Esophagus | ESCC | Ras protein signal transduction | 201/8552 | 337/18723 | 1.44e-07 | 2.30e-06 | 201 |
| GO:000726610 | Esophagus | ESCC | Rho protein signal transduction | 81/8552 | 137/18723 | 1.03e-03 | 5.20e-03 | 81 |
| GO:005105610 | Esophagus | ESCC | regulation of small GTPase mediated signal transduction | 157/8552 | 302/18723 | 1.55e-02 | 4.98e-02 | 157 |
| GO:00072654 | Liver | NAFLD | Ras protein signal transduction | 66/1882 | 337/18723 | 8.43e-08 | 7.09e-06 | 66 |
| GO:00510564 | Liver | NAFLD | regulation of small GTPase mediated signal transduction | 56/1882 | 302/18723 | 4.62e-06 | 1.75e-04 | 56 |
| GO:00072664 | Liver | NAFLD | Rho protein signal transduction | 31/1882 | 137/18723 | 1.19e-05 | 3.67e-04 | 31 |
| Pathway ID | Tissue | Disease Stage | Description | Gene Ratio | Bg Ratio | pvalue | p.adjust | qvalue | Count |
| hsa0513020 | Cervix | CC | Pathogenic Escherichia coli infection | 63/1267 | 197/8465 | 9.28e-10 | 2.00e-08 | 1.19e-08 | 63 |
| hsa0516318 | Cervix | CC | Human cytomegalovirus infection | 65/1267 | 225/8465 | 4.59e-08 | 6.47e-07 | 3.83e-07 | 65 |
| hsa0520516 | Cervix | CC | Proteoglycans in cancer | 60/1267 | 205/8465 | 9.13e-08 | 1.18e-06 | 7.00e-07 | 60 |
| hsa0481016 | Cervix | CC | Regulation of actin cytoskeleton | 64/1267 | 229/8465 | 2.24e-07 | 2.59e-06 | 1.53e-06 | 64 |
| hsa0513516 | Cervix | CC | Yersinia infection | 39/1267 | 137/8465 | 3.27e-05 | 2.41e-04 | 1.42e-04 | 39 |
| hsa043609 | Cervix | CC | Axon guidance | 47/1267 | 182/8465 | 8.13e-05 | 5.38e-04 | 3.18e-04 | 47 |
| hsa046115 | Cervix | CC | Platelet activation | 28/1267 | 124/8465 | 1.50e-02 | 4.45e-02 | 2.63e-02 | 28 |
| hsa05130110 | Cervix | CC | Pathogenic Escherichia coli infection | 63/1267 | 197/8465 | 9.28e-10 | 2.00e-08 | 1.19e-08 | 63 |
| hsa0516319 | Cervix | CC | Human cytomegalovirus infection | 65/1267 | 225/8465 | 4.59e-08 | 6.47e-07 | 3.83e-07 | 65 |
| hsa0520517 | Cervix | CC | Proteoglycans in cancer | 60/1267 | 205/8465 | 9.13e-08 | 1.18e-06 | 7.00e-07 | 60 |
| hsa0481017 | Cervix | CC | Regulation of actin cytoskeleton | 64/1267 | 229/8465 | 2.24e-07 | 2.59e-06 | 1.53e-06 | 64 |
| hsa0513517 | Cervix | CC | Yersinia infection | 39/1267 | 137/8465 | 3.27e-05 | 2.41e-04 | 1.42e-04 | 39 |
| hsa0436012 | Cervix | CC | Axon guidance | 47/1267 | 182/8465 | 8.13e-05 | 5.38e-04 | 3.18e-04 | 47 |
| hsa0461113 | Cervix | CC | Platelet activation | 28/1267 | 124/8465 | 1.50e-02 | 4.45e-02 | 2.63e-02 | 28 |
| hsa05130 | Colorectum | AD | Pathogenic Escherichia coli infection | 79/2092 | 197/8465 | 1.05e-06 | 1.36e-05 | 8.65e-06 | 79 |
| hsa05135 | Colorectum | AD | Yersinia infection | 58/2092 | 137/8465 | 3.90e-06 | 4.35e-05 | 2.78e-05 | 58 |
| hsa05205 | Colorectum | AD | Proteoglycans in cancer | 70/2092 | 205/8465 | 1.37e-03 | 8.46e-03 | 5.39e-03 | 70 |
| hsa05163 | Colorectum | AD | Human cytomegalovirus infection | 75/2092 | 225/8465 | 2.00e-03 | 1.10e-02 | 7.01e-03 | 75 |
| hsa04810 | Colorectum | AD | Regulation of actin cytoskeleton | 75/2092 | 229/8465 | 3.36e-03 | 1.76e-02 | 1.12e-02 | 75 |
| hsa04360 | Colorectum | AD | Axon guidance | 61/2092 | 182/8465 | 4.36e-03 | 2.17e-02 | 1.38e-02 | 61 |
| Hugo Symbol | Variant Class | Variant Classification | dbSNP RS | HGVSc | HGVSp | HGVSp Short | SWISSPROT | BIOTYPE | SIFT | PolyPhen | Tumor Sample Barcode | Tissue | Histology | Sex | Age | Stage | Therapy Types | Drugs | Outcome |
| ARHGEF12 | SNV | Missense_Mutation | | c.3799C>G | p.Leu1267Val | p.L1267V | Q9NZN5 | protein_coding | deleterious_low_confidence(0) | probably_damaging(0.991) | TCGA-AC-A5XS-01 | Breast | breast invasive carcinoma | Female | >=65 | I/II | Hormone Therapy | femara | SD |
| ARHGEF12 | SNV | Missense_Mutation | novel | c.4467G>C | p.Glu1489Asp | p.E1489D | Q9NZN5 | protein_coding | tolerated_low_confidence(0.28) | benign(0.026) | TCGA-AC-A5XS-01 | Breast | breast invasive carcinoma | Female | >=65 | I/II | Hormone Therapy | femara | SD |
| ARHGEF12 | SNV | Missense_Mutation | | c.77N>A | p.Arg26Gln | p.R26Q | Q9NZN5 | protein_coding | deleterious(0) | possibly_damaging(0.844) | TCGA-AN-A046-01 | Breast | breast invasive carcinoma | Female | >=65 | I/II | Unknown | Unknown | SD |
| ARHGEF12 | SNV | Missense_Mutation | novel | c.1390N>C | p.Tyr464His | p.Y464H | Q9NZN5 | protein_coding | tolerated(0.15) | benign(0.152) | TCGA-AN-A046-01 | Breast | breast invasive carcinoma | Female | >=65 | I/II | Unknown | Unknown | SD |
| ARHGEF12 | SNV | Missense_Mutation | | c.3566N>T | p.Ser1189Leu | p.S1189L | Q9NZN5 | protein_coding | tolerated_low_confidence(0.24) | benign(0.036) | TCGA-AO-A0JC-01 | Breast | breast invasive carcinoma | Female | <65 | I/II | Chemotherapy | fluorouracil | SD |
| ARHGEF12 | SNV | Missense_Mutation | novel | c.3139N>G | p.Leu1047Val | p.L1047V | Q9NZN5 | protein_coding | deleterious(0) | possibly_damaging(0.886) | TCGA-BH-A0B6-01 | Breast | breast invasive carcinoma | Female | <65 | I/II | Unknown | Unknown | SD |
| ARHGEF12 | SNV | Missense_Mutation | novel | c.1263N>G | p.Ile421Met | p.I421M | Q9NZN5 | protein_coding | deleterious(0.01) | benign(0.427) | TCGA-BH-A2L8-01 | Breast | breast invasive carcinoma | Female | <65 | I/II | Chemotherapy | cytoxan | CR |
| ARHGEF12 | SNV | Missense_Mutation | | c.4148N>T | p.Asp1383Val | p.D1383V | Q9NZN5 | protein_coding | deleterious_low_confidence(0) | probably_damaging(0.996) | TCGA-E2-A15R-01 | Breast | breast invasive carcinoma | Female | <65 | I/II | Chemotherapy | cyclophosphamide | SD |
| ARHGEF12 | SNV | Missense_Mutation | | c.1450N>T | p.Arg484Trp | p.R484W | Q9NZN5 | protein_coding | deleterious(0) | probably_damaging(1) | TCGA-GM-A2DA-01 | Breast | breast invasive carcinoma | Female | <65 | I/II | Chemotherapy | fluorouracil | PD |
| ARHGEF12 | insertion | Frame_Shift_Ins | novel | c.2907_2908insAC | p.Ile970ThrfsTer3 | p.I970Tfs*3 | Q9NZN5 | protein_coding | | | TCGA-A8-A095-01 | Breast | breast invasive carcinoma | Female | <65 | I/II | Chemotherapy | 5-fluorouracil | CR |


