
|
|||||
|
 | |
| |
| |
| |
| |
| |
|
Gene: ARHGEF10L |
Gene summary for ARHGEF10L |
| Gene information | Species | Human | Gene symbol | ARHGEF10L | Gene ID | 55160 |
| Gene name | Rho guanine nucleotide exchange factor 10 like | |
| Gene Alias | GrinchGEF | |
| Cytomap | 1p36.13 | |
| Gene Type | protein-coding | GO ID | GO:0006950 | UniProtAcc | Q9HCE6 |
Top |
Malignant transformation analysis |
| Identification of the aberrant gene expression in precancerous and cancerous lesions by comparing the gene expression of stem-like cells in diseased tissues with normal stem cells |
| Entrez ID | Symbol | Replicates | Species | Organ | Tissue | Adj P-value | Log2FC | Malignancy |
| 55160 | ARHGEF10L | CCI_1 | Human | Cervix | CC | 2.27e-02 | 5.87e-01 | 0.528 |
| 55160 | ARHGEF10L | CCI_2 | Human | Cervix | CC | 8.66e-03 | 4.36e-01 | 0.5249 |
| 55160 | ARHGEF10L | CCI_3 | Human | Cervix | CC | 1.89e-08 | 6.84e-01 | 0.516 |
| 55160 | ARHGEF10L | HTA11_3410_2000001011 | Human | Colorectum | AD | 1.06e-05 | -2.81e-01 | 0.0155 |
| 55160 | ARHGEF10L | HTA11_347_2000001011 | Human | Colorectum | AD | 1.61e-09 | 5.35e-01 | -0.1954 |
| 55160 | ARHGEF10L | HTA11_696_2000001011 | Human | Colorectum | AD | 8.95e-07 | 5.46e-01 | -0.1464 |
| 55160 | ARHGEF10L | HTA11_1391_2000001011 | Human | Colorectum | AD | 3.46e-05 | 6.02e-01 | -0.059 |
| 55160 | ARHGEF10L | HTA11_546_2000001011 | Human | Colorectum | AD | 4.31e-03 | 5.67e-01 | -0.0842 |
| 55160 | ARHGEF10L | HTA11_866_3004761011 | Human | Colorectum | AD | 1.17e-02 | 4.28e-01 | 0.096 |
| 55160 | ARHGEF10L | HTA11_7663_2000001011 | Human | Colorectum | SER | 2.50e-08 | 8.21e-01 | 0.0131 |
| 55160 | ARHGEF10L | HTA11_7696_3000711011 | Human | Colorectum | AD | 7.88e-06 | 4.69e-01 | 0.0674 |
| 55160 | ARHGEF10L | HTA11_6818_2000001011 | Human | Colorectum | AD | 6.36e-04 | 5.53e-01 | 0.0112 |
| 55160 | ARHGEF10L | HTA11_99999970781_79442 | Human | Colorectum | MSS | 9.48e-03 | -2.59e-01 | 0.294 |
| 55160 | ARHGEF10L | HTA11_99999974143_84620 | Human | Colorectum | MSS | 7.19e-03 | -2.24e-01 | 0.3005 |
| 55160 | ARHGEF10L | F007 | Human | Colorectum | FAP | 1.24e-04 | -3.78e-01 | 0.1176 |
| 55160 | ARHGEF10L | A002-C-010 | Human | Colorectum | FAP | 5.77e-04 | -1.77e-01 | 0.242 |
| 55160 | ARHGEF10L | A001-C-207 | Human | Colorectum | FAP | 1.76e-06 | -3.68e-01 | 0.1278 |
| 55160 | ARHGEF10L | A015-C-203 | Human | Colorectum | FAP | 1.10e-42 | -4.32e-01 | -0.1294 |
| 55160 | ARHGEF10L | A015-C-204 | Human | Colorectum | FAP | 2.42e-10 | -3.73e-01 | -0.0228 |
| 55160 | ARHGEF10L | A014-C-040 | Human | Colorectum | FAP | 2.86e-05 | -3.69e-01 | -0.1184 |
| Page: 1 2 3 |
| Tissue | Expression Dynamics | Abbreviation |
| Cervix | 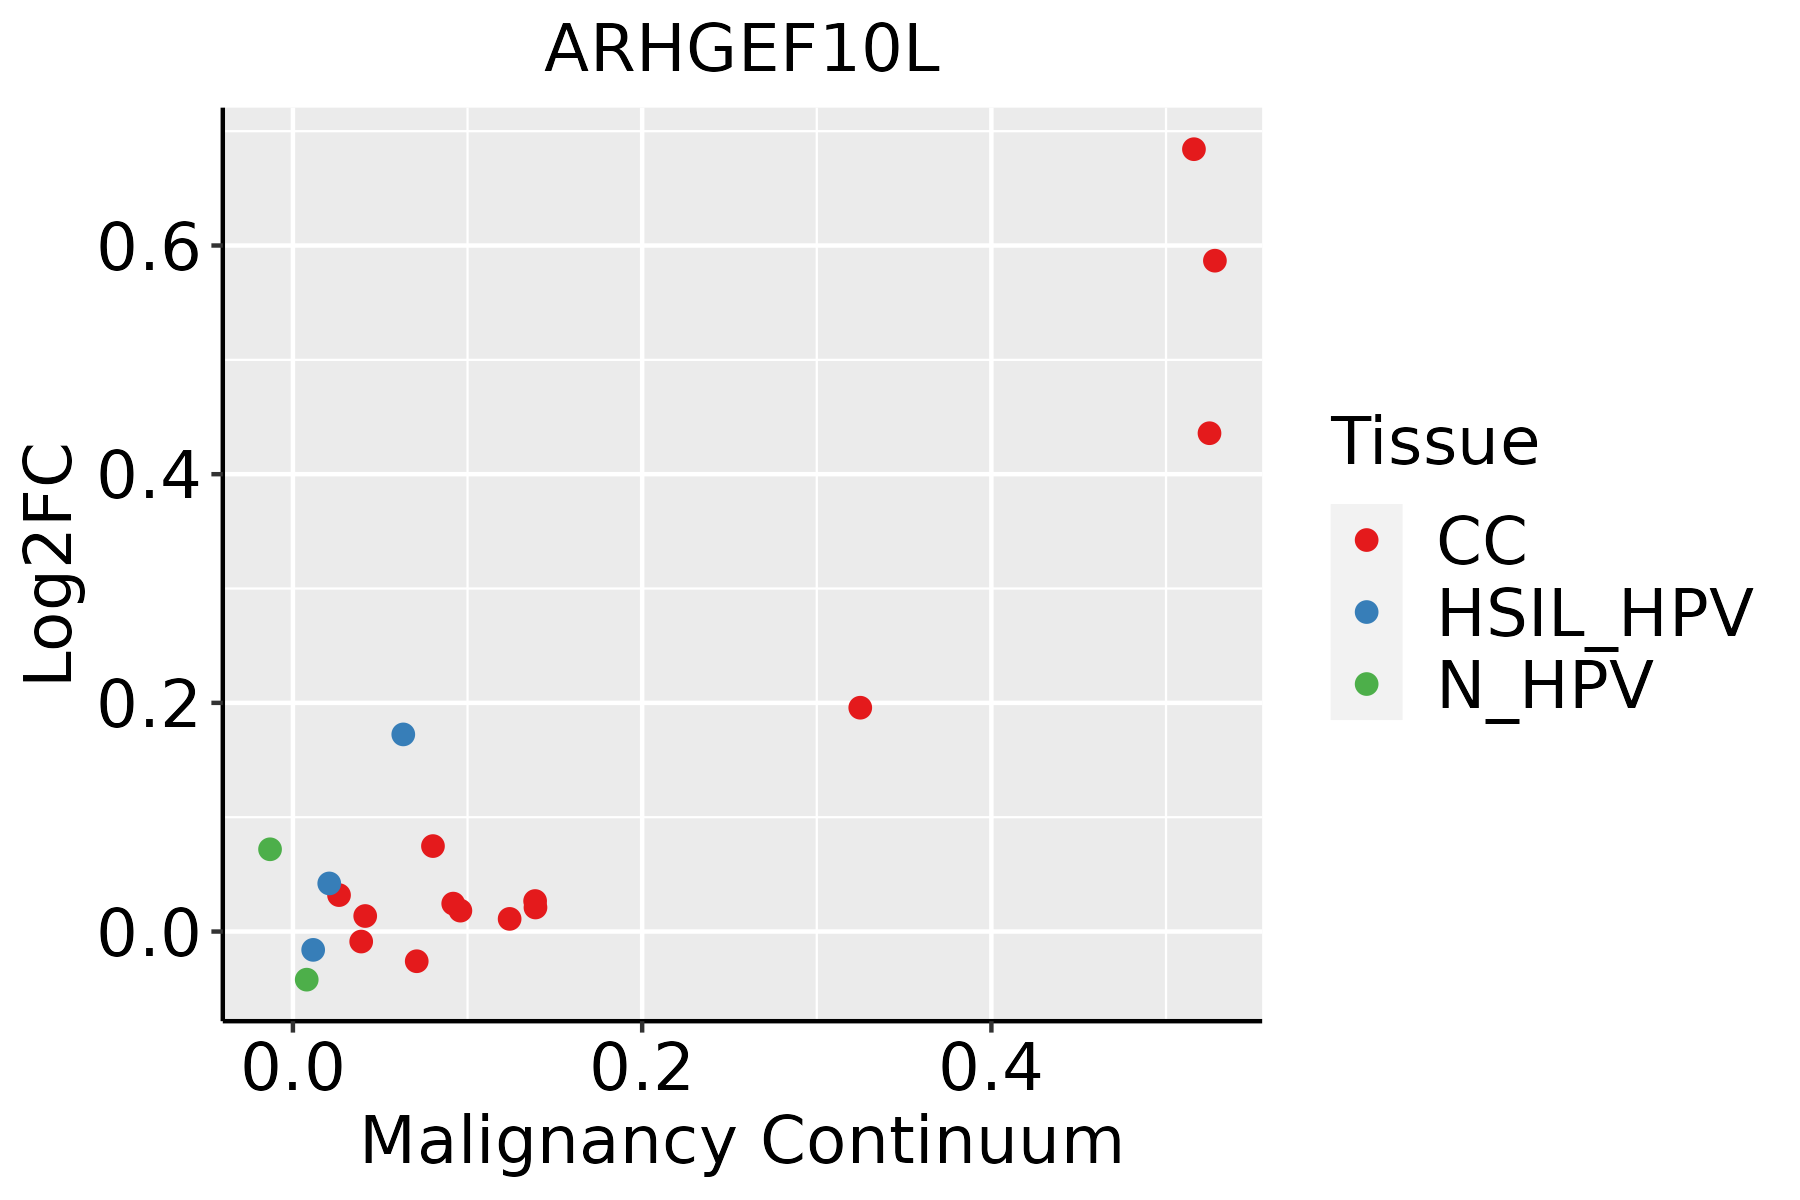 | CC: Cervix cancer |
| HSIL_HPV: HPV-infected high-grade squamous intraepithelial lesions | ||
| N_HPV: HPV-infected normal cervix | ||
| Colorectum (GSE201348) |  | FAP: Familial adenomatous polyposis |
| CRC: Colorectal cancer | ||
| Colorectum (HTA11) |  | AD: Adenomas |
| SER: Sessile serrated lesions | ||
| MSI-H: Microsatellite-high colorectal cancer | ||
| MSS: Microsatellite stable colorectal cancer | ||
| Liver | 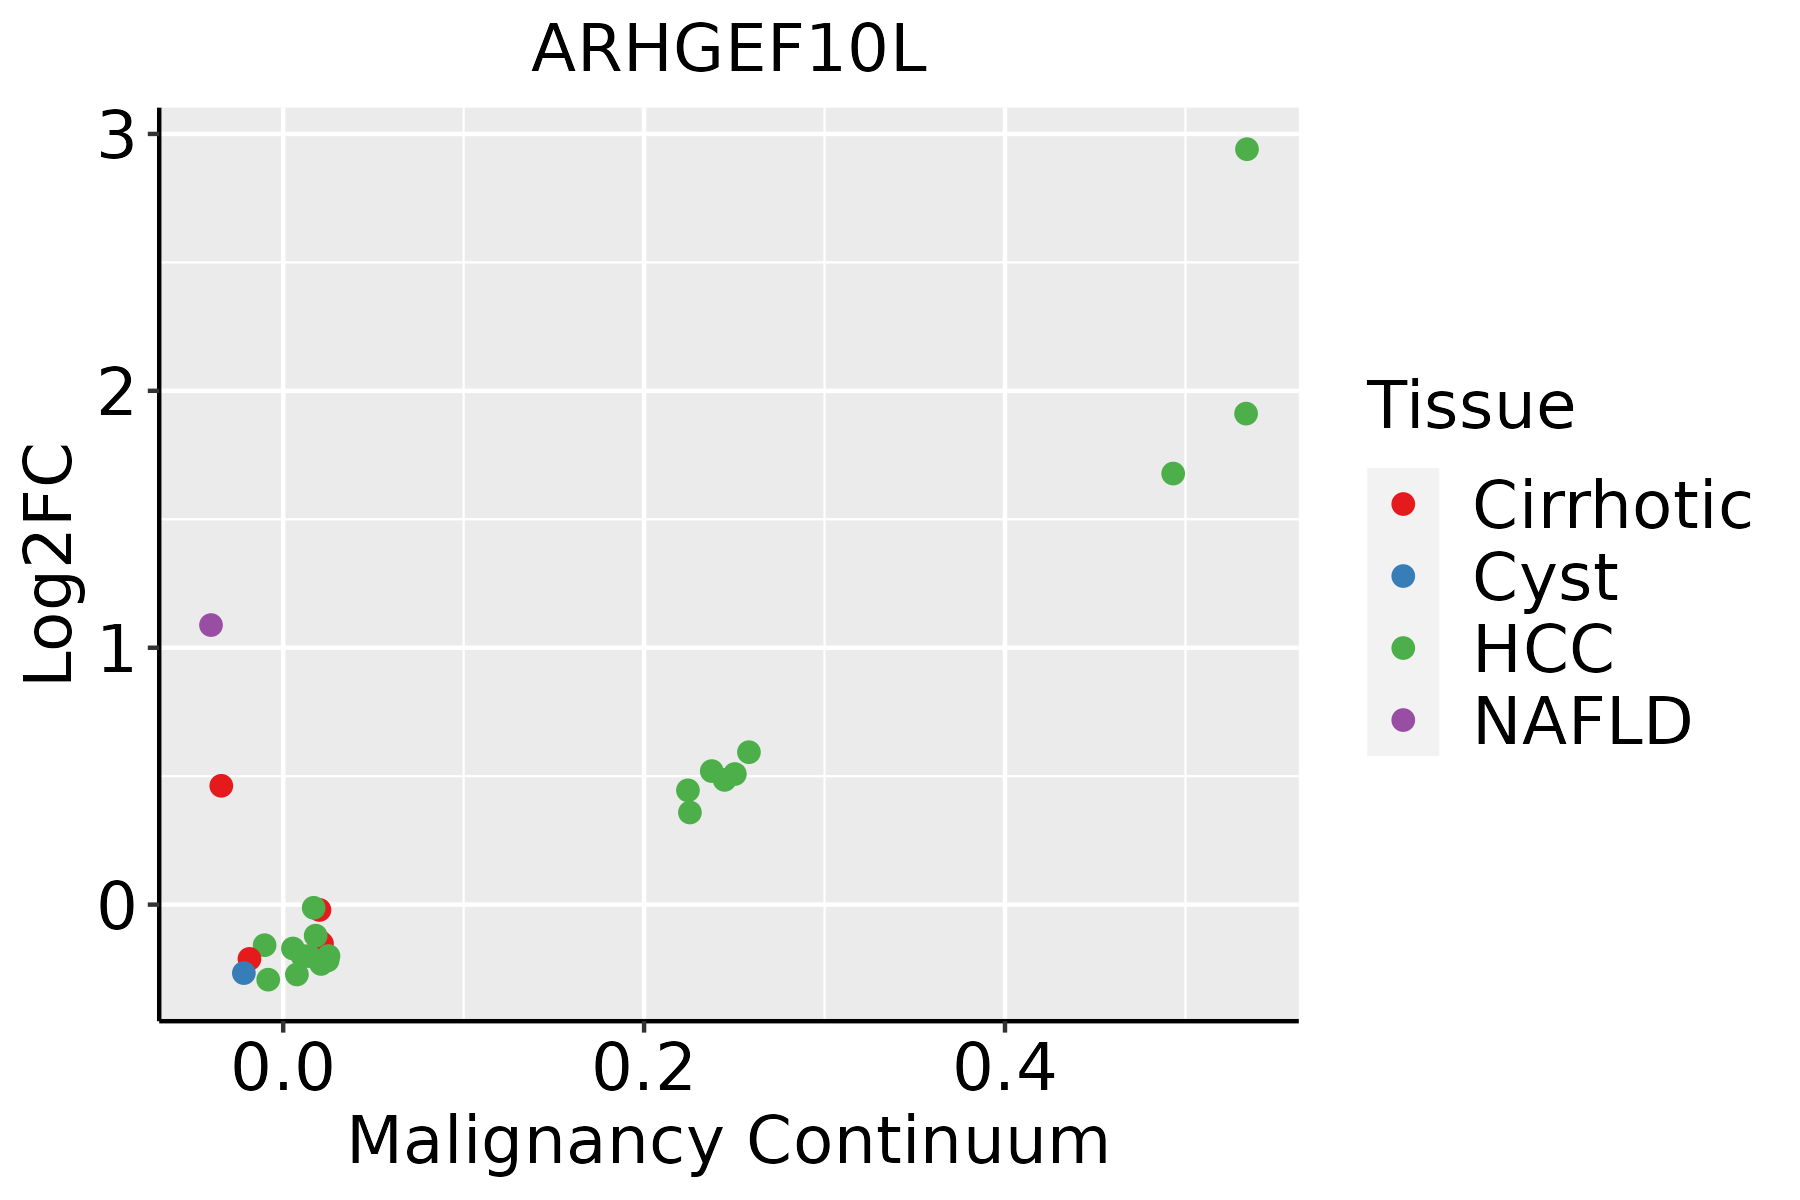 | HCC: Hepatocellular carcinoma |
| NAFLD: Non-alcoholic fatty liver disease |
| ∗log2FC in expression of this searched gene in stem-like cells from each diseased tissue sample relative to stem-like cells in normal samples in each tissue plotted against the malignancy continuum. Samples are colored based on if they are from different disease stage. |
Top |
Malignant transformation related pathway analysis |
| Find out the enriched GO biological processes and KEGG pathways involved in transition from healthy to precancer to cancer |
| Tissue | Disease Stage | Enriched GO biological Processes |
| Colorectum | AD |  |
| Colorectum | SER |  |
| Colorectum | MSS |  |
| Colorectum | MSI-H |  |
| Colorectum | FAP |  |
| ∗Top 15 enriched GO BP terms are showed in the bar plot of each disease state in each tissue. Each row represents a significant GO biological process which is colored according to the -log10(p.adjust). |
| Page: 1 2 3 4 5 6 7 8 9 |
| GO ID | Tissue | Disease Stage | Description | Gene Ratio | Bg Ratio | pvalue | p.adjust | Count |
| GO:000701510 | Cervix | CC | actin filament organization | 109/2311 | 442/18723 | 4.92e-13 | 2.45e-10 | 109 |
| GO:003297010 | Cervix | CC | regulation of actin filament-based process | 96/2311 | 397/18723 | 4.00e-11 | 8.54e-09 | 96 |
| GO:190290310 | Cervix | CC | regulation of supramolecular fiber organization | 92/2311 | 383/18723 | 1.49e-10 | 2.48e-08 | 92 |
| GO:003295610 | Cervix | CC | regulation of actin cytoskeleton organization | 86/2311 | 358/18723 | 5.90e-10 | 7.51e-08 | 86 |
| GO:00510566 | Cervix | CC | regulation of small GTPase mediated signal transduction | 75/2311 | 302/18723 | 1.54e-09 | 1.74e-07 | 75 |
| GO:011005310 | Cervix | CC | regulation of actin filament organization | 67/2311 | 278/18723 | 4.01e-08 | 2.54e-06 | 67 |
| GO:006157210 | Cervix | CC | actin filament bundle organization | 44/2311 | 161/18723 | 2.08e-07 | 9.34e-06 | 44 |
| GO:005101710 | Cervix | CC | actin filament bundle assembly | 43/2311 | 157/18723 | 2.66e-07 | 1.12e-05 | 43 |
| GO:190290510 | Cervix | CC | positive regulation of supramolecular fiber organization | 50/2311 | 209/18723 | 2.55e-06 | 7.54e-05 | 50 |
| GO:005149510 | Cervix | CC | positive regulation of cytoskeleton organization | 50/2311 | 226/18723 | 2.53e-05 | 4.29e-04 | 50 |
| GO:003223110 | Cervix | CC | regulation of actin filament bundle assembly | 28/2311 | 105/18723 | 5.19e-05 | 7.79e-04 | 28 |
| GO:011002010 | Cervix | CC | regulation of actomyosin structure organization | 27/2311 | 100/18723 | 5.55e-05 | 8.10e-04 | 27 |
| GO:00069846 | Cervix | CC | ER-nucleus signaling pathway | 16/2311 | 46/18723 | 7.12e-05 | 9.90e-04 | 16 |
| GO:005149210 | Cervix | CC | regulation of stress fiber assembly | 25/2311 | 91/18723 | 7.59e-05 | 1.04e-03 | 25 |
| GO:00310329 | Cervix | CC | actomyosin structure organization | 43/2311 | 196/18723 | 1.11e-04 | 1.40e-03 | 43 |
| GO:003003810 | Cervix | CC | contractile actin filament bundle assembly | 27/2311 | 106/18723 | 1.63e-04 | 1.94e-03 | 27 |
| GO:004314910 | Cervix | CC | stress fiber assembly | 27/2311 | 106/18723 | 1.63e-04 | 1.94e-03 | 27 |
| GO:00322339 | Cervix | CC | positive regulation of actin filament bundle assembly | 18/2311 | 63/18723 | 4.39e-04 | 4.39e-03 | 18 |
| GO:00514966 | Cervix | CC | positive regulation of stress fiber assembly | 14/2311 | 52/18723 | 3.39e-03 | 2.20e-02 | 14 |
| GO:0007015 | Colorectum | AD | actin filament organization | 167/3918 | 442/18723 | 1.65e-16 | 7.94e-14 | 167 |
| Page: 1 2 3 4 5 6 7 8 9 |
| Pathway ID | Tissue | Disease Stage | Description | Gene Ratio | Bg Ratio | pvalue | p.adjust | qvalue | Count |
| Page: 1 |
Top |
Cell-cell communication analysis |
| Identification of potential cell-cell interactions between two cell types and their ligand-receptor pairs for different disease states |
| Ligand | Receptor | LRpair | Pathway | Tissue | Disease Stage |
| Page: 1 |
Top |
Single-cell gene regulatory network inference analysis |
| Find out the significant the regulons (TFs) and the target genes of each regulon across cell types for different disease states |
| TF | Cell Type | Tissue | Disease Stage | Target Gene | RSS | Regulon Activity |
| ∗The dot plots of a searched regulon are shown for all cell subpopulations in each disease state of each tissue based on the regulon specific score inferred using pySCENIC and by calculating the average expression. |
| Page: 1 |
Top |
Somatic mutation of malignant transformation related genes |
| Annotation of somatic variants for genes involved in malignant transformation |
| Hugo Symbol | Variant Class | Variant Classification | dbSNP RS | HGVSc | HGVSp | HGVSp Short | SWISSPROT | BIOTYPE | SIFT | PolyPhen | Tumor Sample Barcode | Tissue | Histology | Sex | Age | Stage | Therapy Types | Drugs | Outcome |
| ARHGEF10L | SNV | Missense_Mutation | c.1639N>T | p.Val547Leu | p.V547L | Q9HCE6 | protein_coding | deleterious(0.03) | probably_damaging(0.97) | TCGA-A2-A0YJ-01 | Breast | breast invasive carcinoma | Female | <65 | III/IV | Chemotherapy | cytoxan | PD | |
| ARHGEF10L | SNV | Missense_Mutation | c.1094N>A | p.Arg365His | p.R365H | Q9HCE6 | protein_coding | deleterious(0) | probably_damaging(0.994) | TCGA-A8-A06U-01 | Breast | breast invasive carcinoma | Female | >=65 | I/II | Unknown | Unknown | SD | |
| ARHGEF10L | SNV | Missense_Mutation | c.1489G>A | p.Ala497Thr | p.A497T | Q9HCE6 | protein_coding | deleterious(0) | probably_damaging(0.999) | TCGA-BH-A18G-01 | Breast | breast invasive carcinoma | Female | >=65 | I/II | Unknown | Unknown | SD | |
| ARHGEF10L | SNV | Missense_Mutation | c.1042N>A | p.Glu348Lys | p.E348K | Q9HCE6 | protein_coding | deleterious(0) | possibly_damaging(0.904) | TCGA-E2-A1L8-01 | Breast | breast invasive carcinoma | Female | <65 | I/II | Chemotherapy | cyclophosphamide | SD | |
| ARHGEF10L | SNV | Missense_Mutation | c.2288N>G | p.Pro763Arg | p.P763R | Q9HCE6 | protein_coding | tolerated(0.22) | probably_damaging(0.983) | TCGA-E9-A1NF-01 | Breast | breast invasive carcinoma | Female | <65 | I/II | Chemotherapy | doxorubicin | PD | |
| ARHGEF10L | insertion | Nonsense_Mutation | novel | c.2470_2471insTAGTCATTCAGGAGCAGGTACTCTCAGAAAATTCTTTGTGACGAT | p.Gly824delinsValValIleGlnGluGlnValLeuSerGluAsnSerLeuTerArgCys | p.G824delinsVVIQEQVLSENSL*RC | Q9HCE6 | protein_coding | TCGA-AN-A0FX-01 | Breast | breast invasive carcinoma | Female | <65 | I/II | Unknown | Unknown | SD | ||
| ARHGEF10L | deletion | Frame_Shift_Del | c.186delN | p.Pro64HisfsTer2 | p.P64Hfs*2 | Q9HCE6 | protein_coding | TCGA-D8-A1XK-01 | Breast | breast invasive carcinoma | Female | <65 | I/II | Chemotherapy | doxorubicine+cyclophosphamide | SD | |||
| ARHGEF10L | deletion | Frame_Shift_Del | novel | c.1008delG | p.Lys336AsnfsTer11 | p.K336Nfs*11 | Q9HCE6 | protein_coding | TCGA-LL-A740-01 | Breast | breast invasive carcinoma | Female | <65 | I/II | Chemotherapy | adriamycin | CR | ||
| ARHGEF10L | SNV | Missense_Mutation | rs776413301 | c.1384T>C | p.Phe462Leu | p.F462L | Q9HCE6 | protein_coding | deleterious(0.02) | benign(0.073) | TCGA-2W-A8YY-01 | Cervix | cervical & endocervical cancer | Female | <65 | I/II | Chemotherapy | cisplatin | CR |
| ARHGEF10L | SNV | Missense_Mutation | c.2334N>G | p.Phe778Leu | p.F778L | Q9HCE6 | protein_coding | tolerated(0.67) | possibly_damaging(0.81) | TCGA-JX-A3Q0-01 | Cervix | cervical & endocervical cancer | Female | <65 | III/IV | Unknown | Unknown | SD |
| Page: 1 2 3 4 5 6 7 8 9 10 11 12 13 14 15 |
Top |
Related drugs of malignant transformation related genes |
| Identification of chemicals and drugs interact with genes involved in malignant transfromation |
| (DGIdb 4.0) |
| Entrez ID | Symbol | Category | Interaction Types | Drug Claim Name | Drug Name | PMIDs |
| Page: 1 |

Copyright 2023-Present -The University of Texas Health Science Center at Houston |