
|
|||||
|
 | |
| |
| |
| |
| |
| |
|
Gene: ARHGDIA |
Gene summary for ARHGDIA |
| Gene information | Species | Human | Gene symbol | ARHGDIA | Gene ID | 396 |
| Gene name | Rho GDP dissociation inhibitor alpha | |
| Gene Alias | GDIA1 | |
| Cytomap | 17q25.3 | |
| Gene Type | protein-coding | GO ID | GO:0000902 | UniProtAcc | P52565 |
Top |
Malignant transformation analysis |
| Identification of the aberrant gene expression in precancerous and cancerous lesions by comparing the gene expression of stem-like cells in diseased tissues with normal stem cells |
| Entrez ID | Symbol | Replicates | Species | Organ | Tissue | Adj P-value | Log2FC | Malignancy |
| 396 | ARHGDIA | AEH-subject1 | Human | Endometrium | AEH | 1.63e-17 | -3.81e-01 | -0.3059 |
| 396 | ARHGDIA | AEH-subject2 | Human | Endometrium | AEH | 1.46e-08 | -2.66e-01 | -0.2525 |
| 396 | ARHGDIA | AEH-subject3 | Human | Endometrium | AEH | 3.89e-05 | -2.49e-01 | -0.2576 |
| 396 | ARHGDIA | AEH-subject4 | Human | Endometrium | AEH | 4.42e-11 | -3.34e-01 | -0.2657 |
| 396 | ARHGDIA | AEH-subject5 | Human | Endometrium | AEH | 1.27e-11 | -3.94e-01 | -0.2953 |
| 396 | ARHGDIA | EEC-subject1 | Human | Endometrium | EEC | 7.24e-17 | -4.01e-01 | -0.2682 |
| 396 | ARHGDIA | EEC-subject2 | Human | Endometrium | EEC | 1.87e-16 | -3.35e-01 | -0.2607 |
| 396 | ARHGDIA | EEC-subject3 | Human | Endometrium | EEC | 1.74e-56 | -3.83e-01 | -0.2525 |
| 396 | ARHGDIA | EEC-subject4 | Human | Endometrium | EEC | 2.44e-09 | -2.75e-01 | -0.2571 |
| 396 | ARHGDIA | EEC-subject5 | Human | Endometrium | EEC | 5.47e-08 | -3.27e-01 | -0.249 |
| 396 | ARHGDIA | GSM6177620_NYU_UCEC1_lib1_lib1 | Human | Endometrium | EEC | 7.27e-32 | -2.56e-01 | -0.1869 |
| 396 | ARHGDIA | GSM6177620_NYU_UCEC1_lib2_lib2 | Human | Endometrium | EEC | 2.50e-32 | -2.06e-01 | -0.1875 |
| 396 | ARHGDIA | GSM6177620_NYU_UCEC1_lib3_lib3 | Human | Endometrium | EEC | 2.71e-33 | -2.73e-01 | -0.1883 |
| 396 | ARHGDIA | GSM6177621_NYU_UCEC2_lib1_lib1 | Human | Endometrium | EEC | 2.74e-33 | -2.88e-01 | -0.1934 |
| 396 | ARHGDIA | GSM6177622_NYU_UCEC3_lib1_lib1 | Human | Endometrium | EEC | 7.36e-47 | -1.98e-01 | -0.1917 |
| 396 | ARHGDIA | GSM6177622_NYU_UCEC3_lib2_lib2 | Human | Endometrium | EEC | 7.19e-51 | -1.88e-01 | -0.1916 |
| 396 | ARHGDIA | GSM6177623_NYU_UCEC3_Vis | Human | Endometrium | EEC | 2.13e-08 | 9.16e-02 | -0.1269 |
| 396 | ARHGDIA | LZE4T | Human | Esophagus | ESCC | 1.08e-05 | 5.41e-01 | 0.0811 |
| 396 | ARHGDIA | LZE5T | Human | Esophagus | ESCC | 2.71e-07 | 3.21e-01 | 0.0514 |
| 396 | ARHGDIA | LZE7T | Human | Esophagus | ESCC | 3.24e-04 | 1.02e+00 | 0.0667 |
| Page: 1 2 3 4 5 6 7 8 9 |
| Tissue | Expression Dynamics | Abbreviation |
| Endometrium | 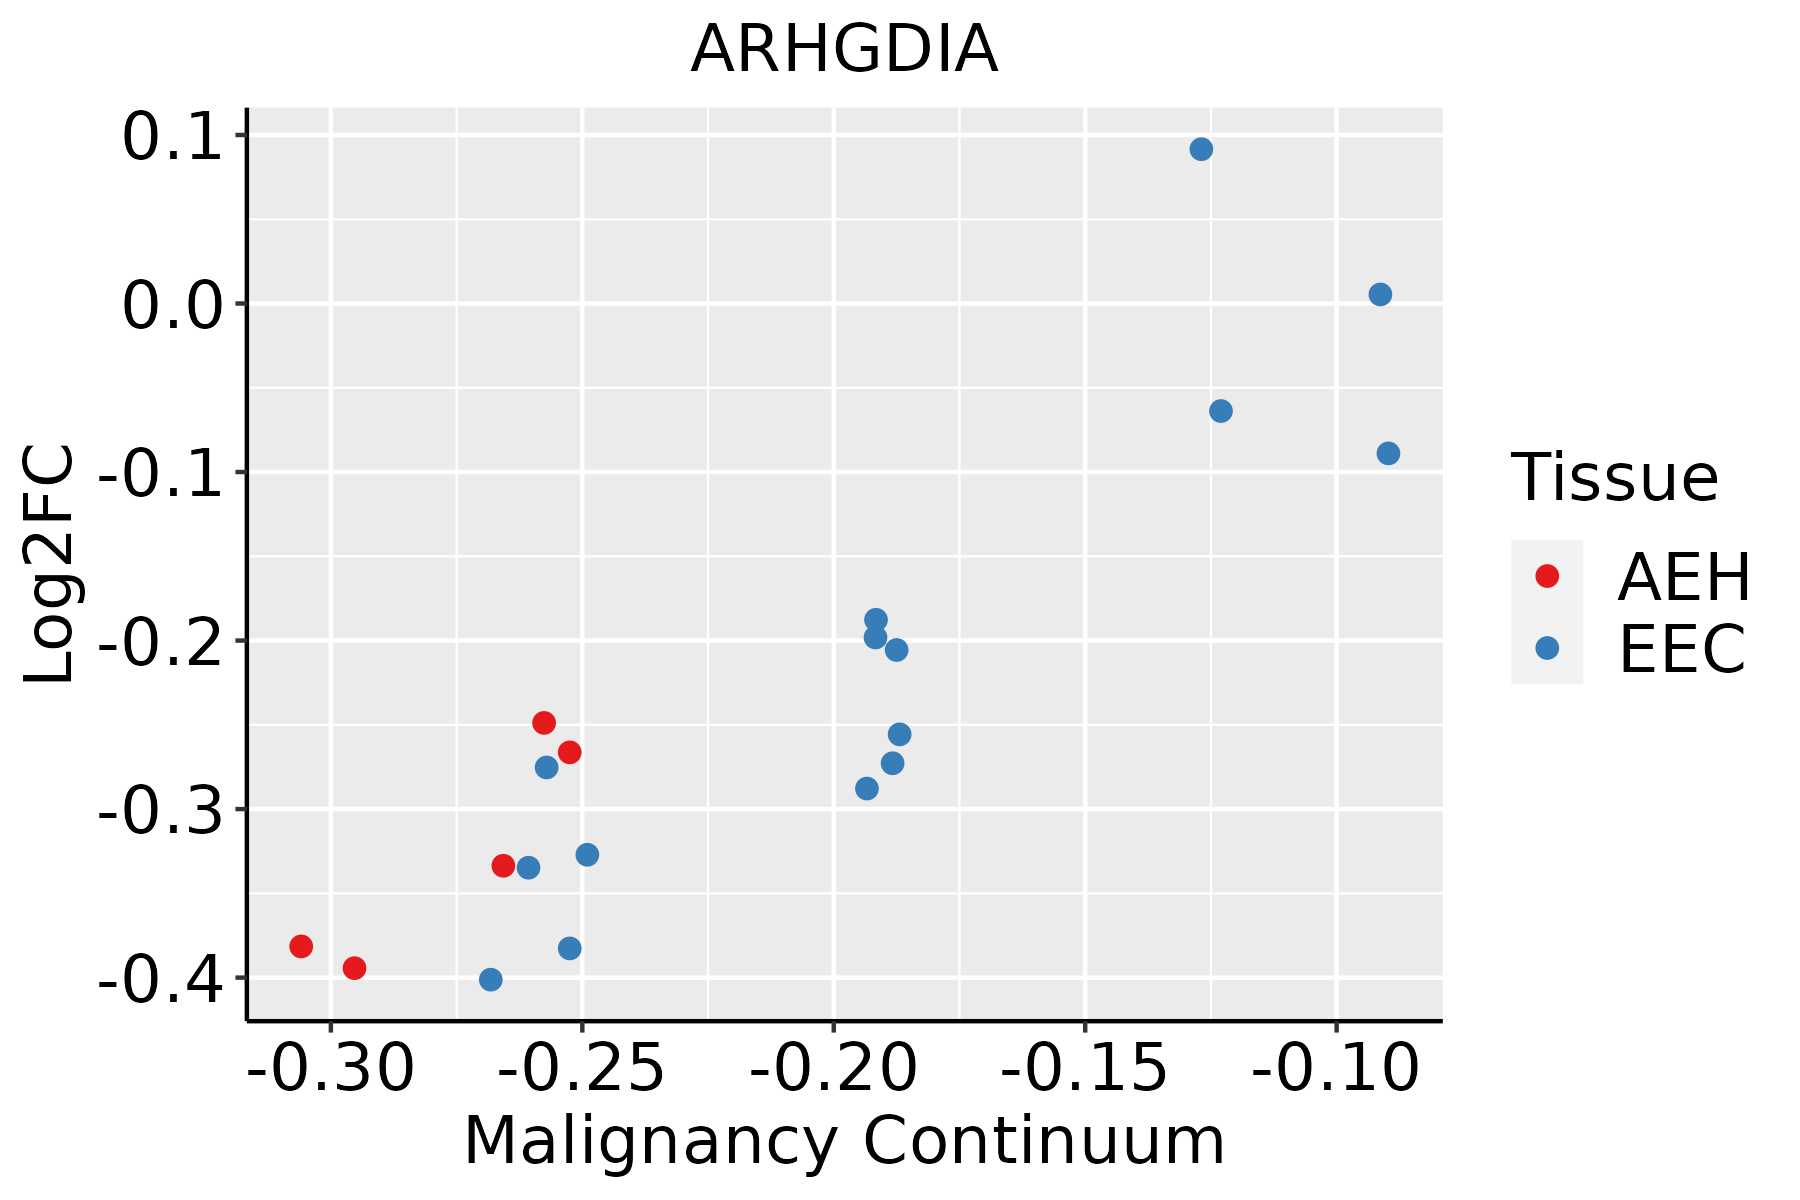 | AEH: Atypical endometrial hyperplasia |
| EEC: Endometrioid Cancer | ||
| Esophagus | 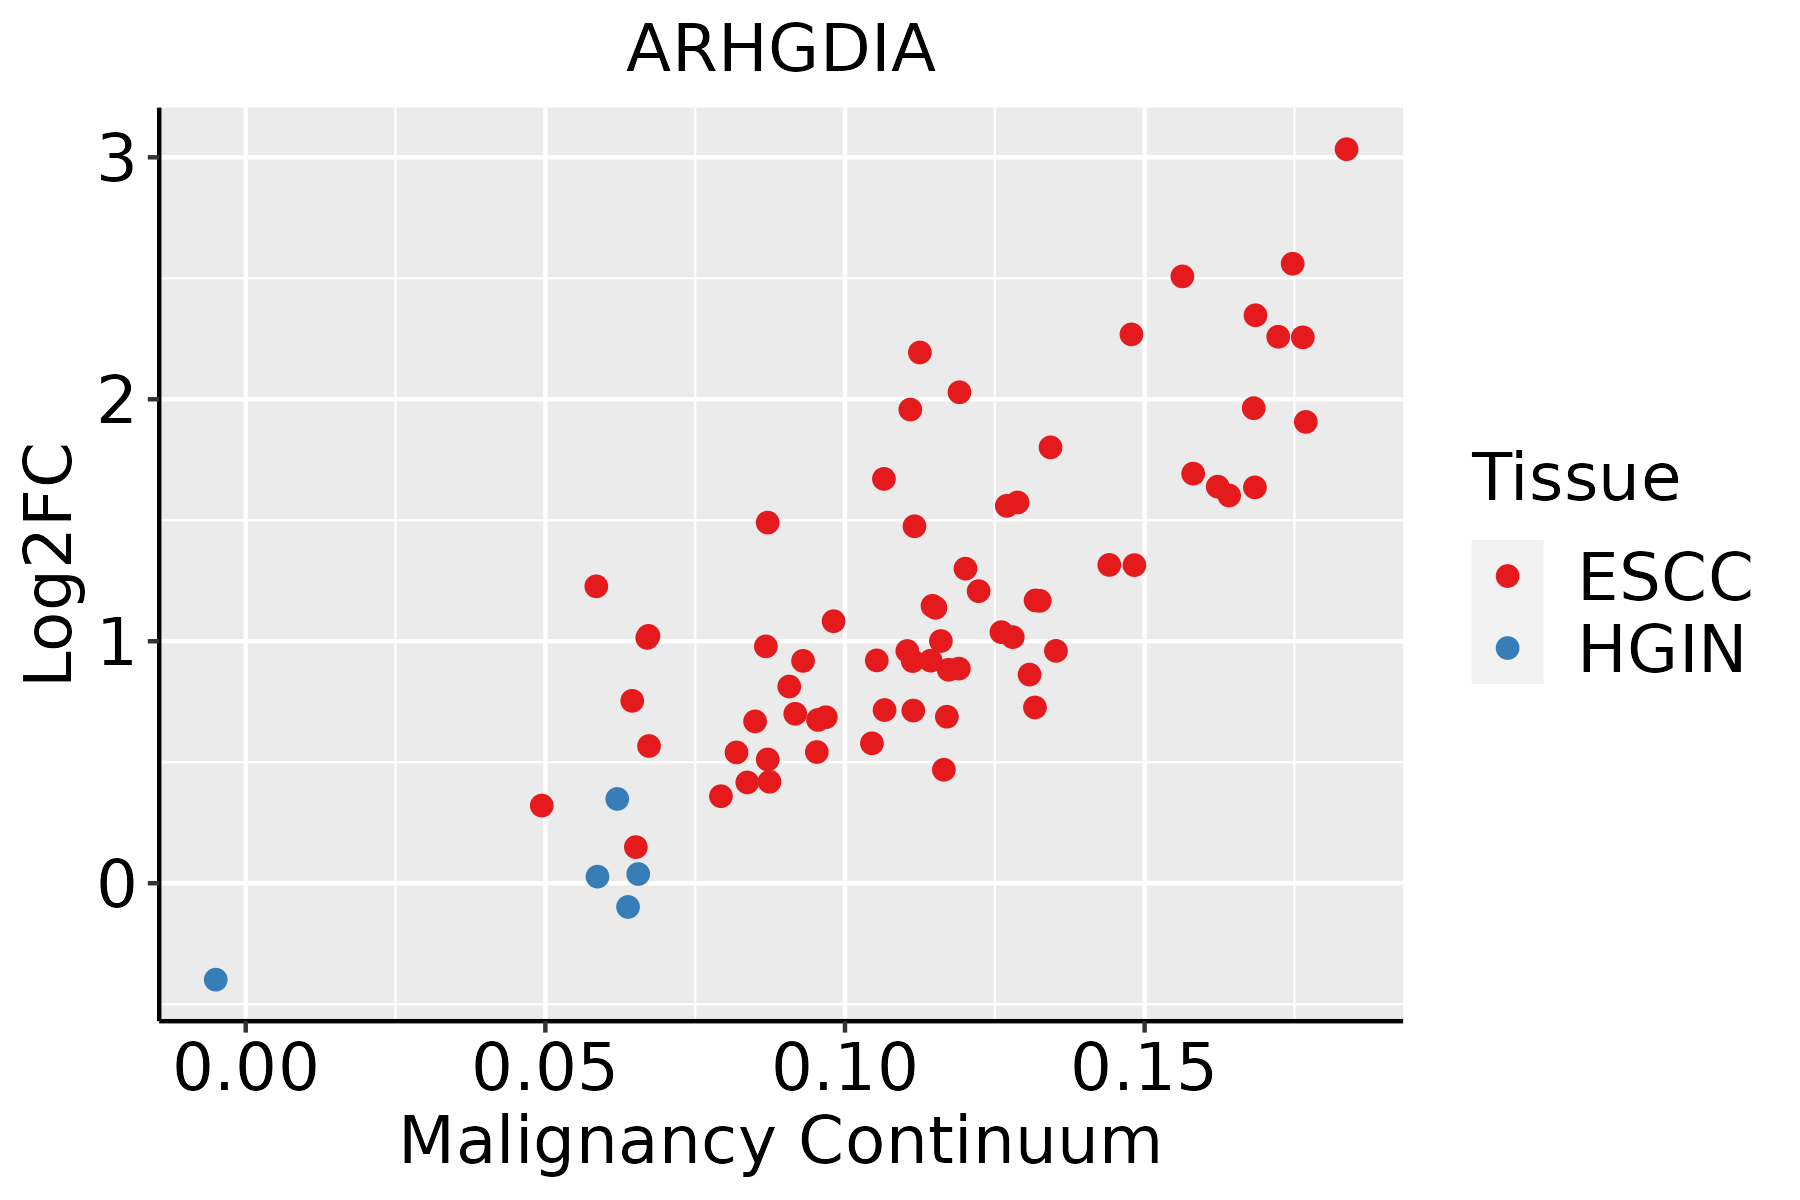 | ESCC: Esophageal squamous cell carcinoma |
| HGIN: High-grade intraepithelial neoplasias | ||
| LGIN: Low-grade intraepithelial neoplasias | ||
| Liver | 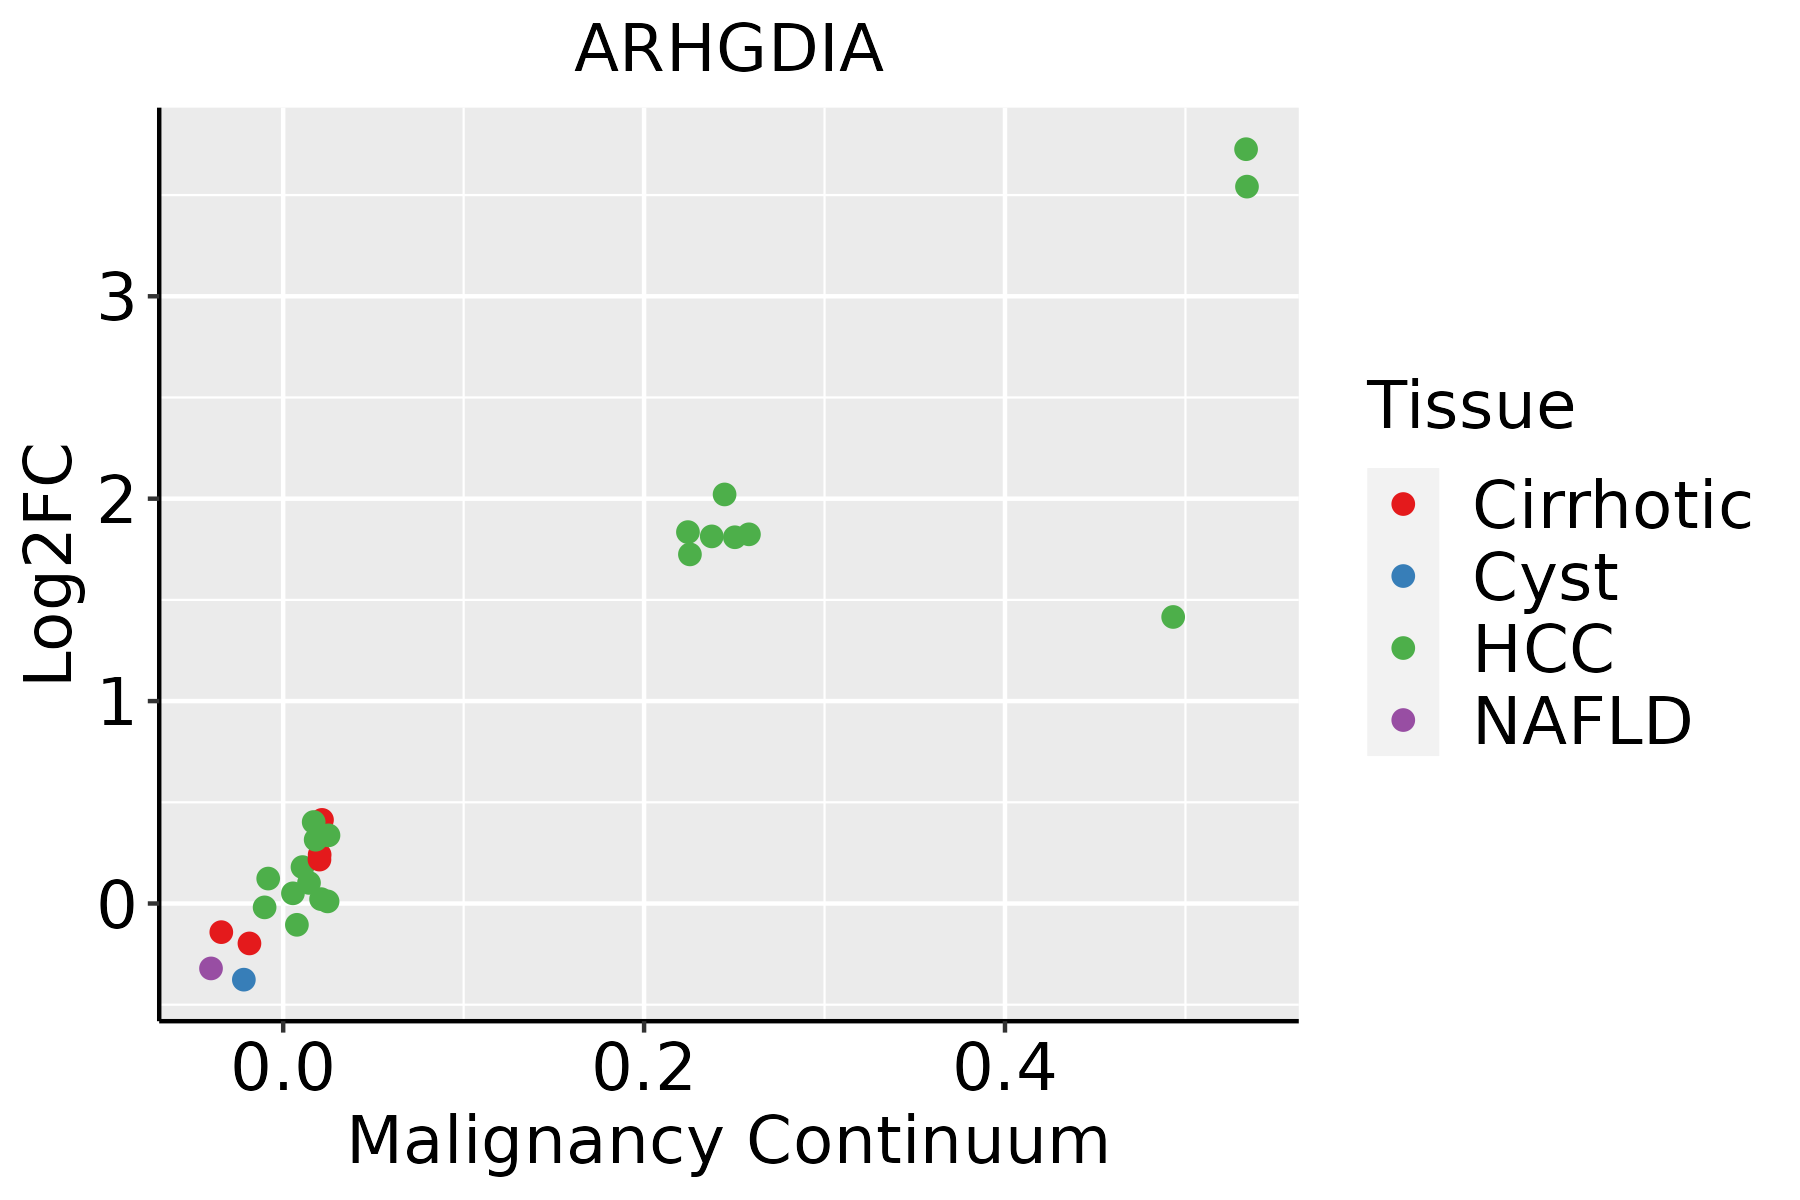 | HCC: Hepatocellular carcinoma |
| NAFLD: Non-alcoholic fatty liver disease | ||
| Oral Cavity | 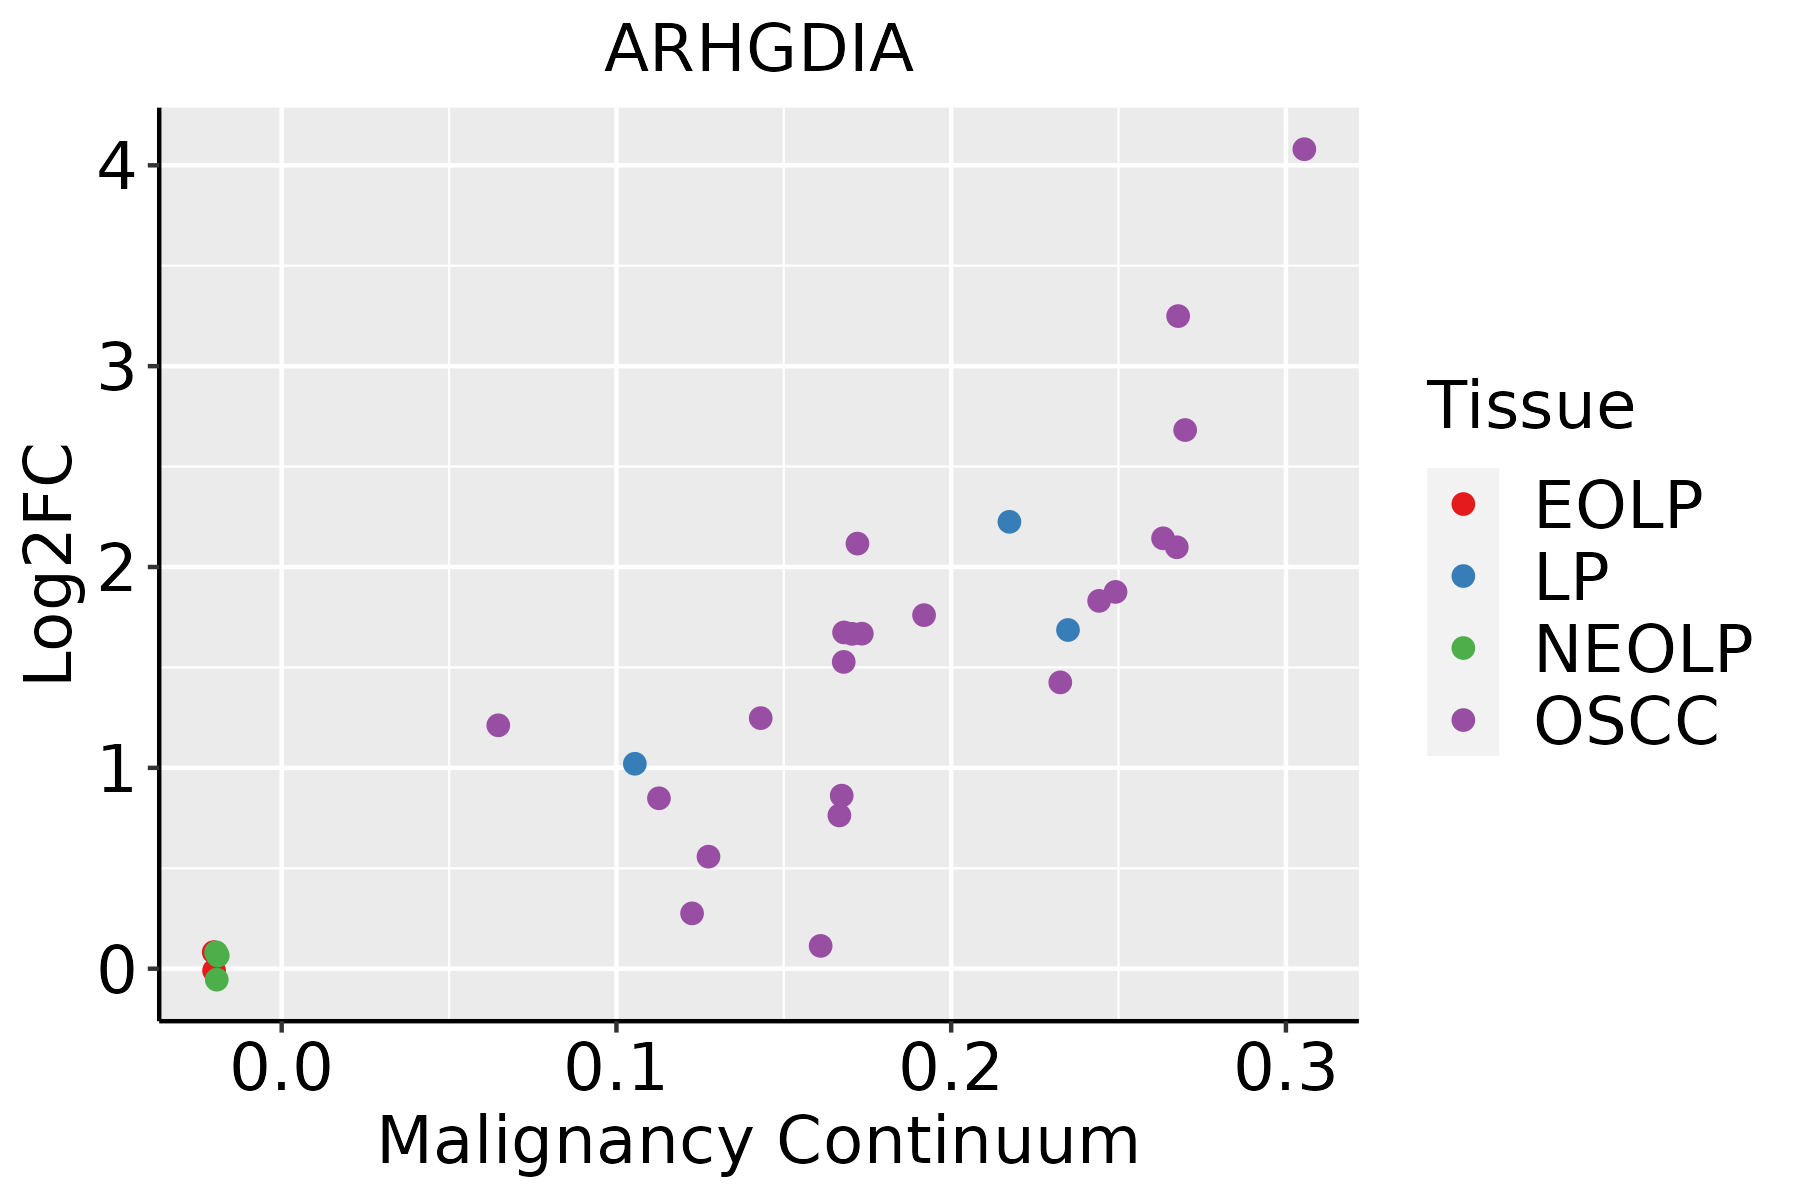 | EOLP: Erosive Oral lichen planus |
| LP: leukoplakia | ||
| NEOLP: Non-erosive oral lichen planus | ||
| OSCC: Oral squamous cell carcinoma | ||
| Prostate | 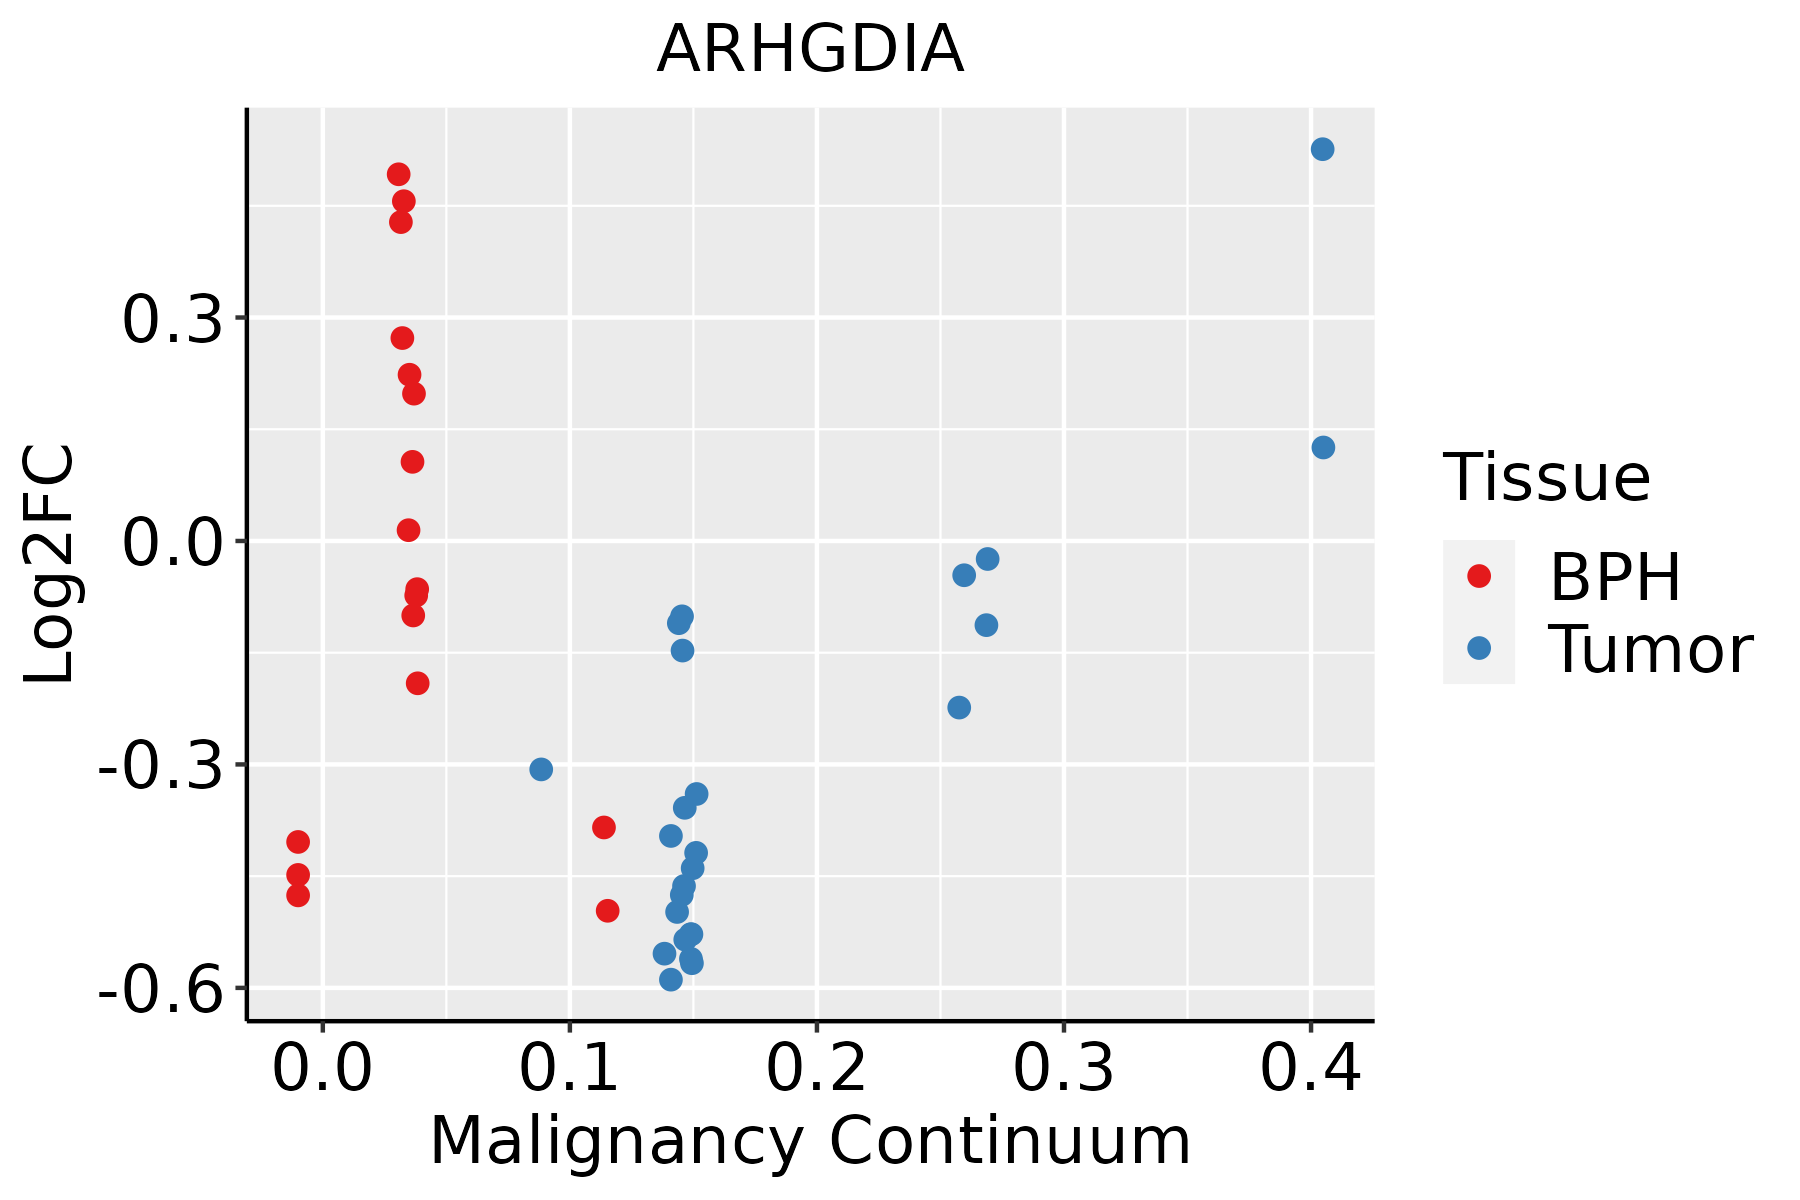 | BPH: Benign Prostatic Hyperplasia |
| Skin | 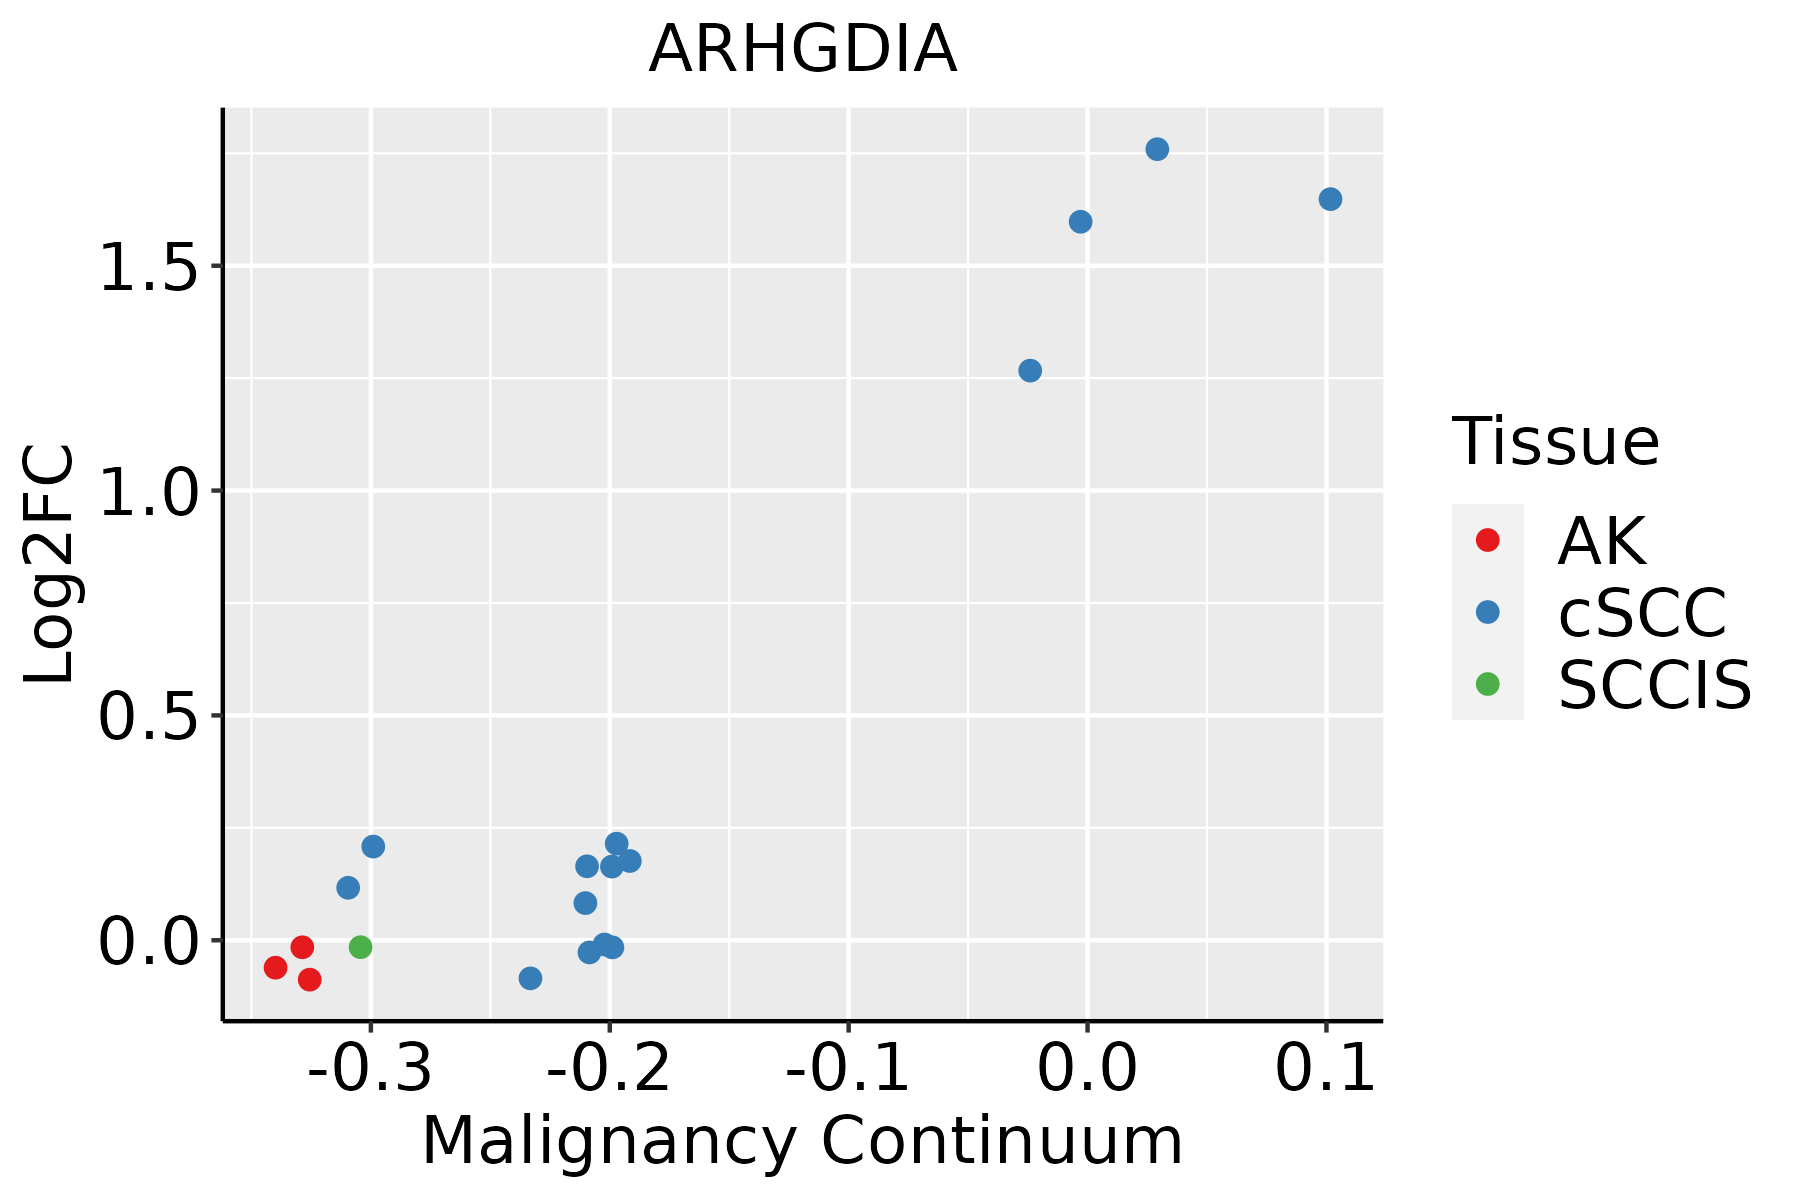 | AK: Actinic keratosis |
| cSCC: Cutaneous squamous cell carcinoma | ||
| SCCIS:squamous cell carcinoma in situ | ||
| Thyroid | 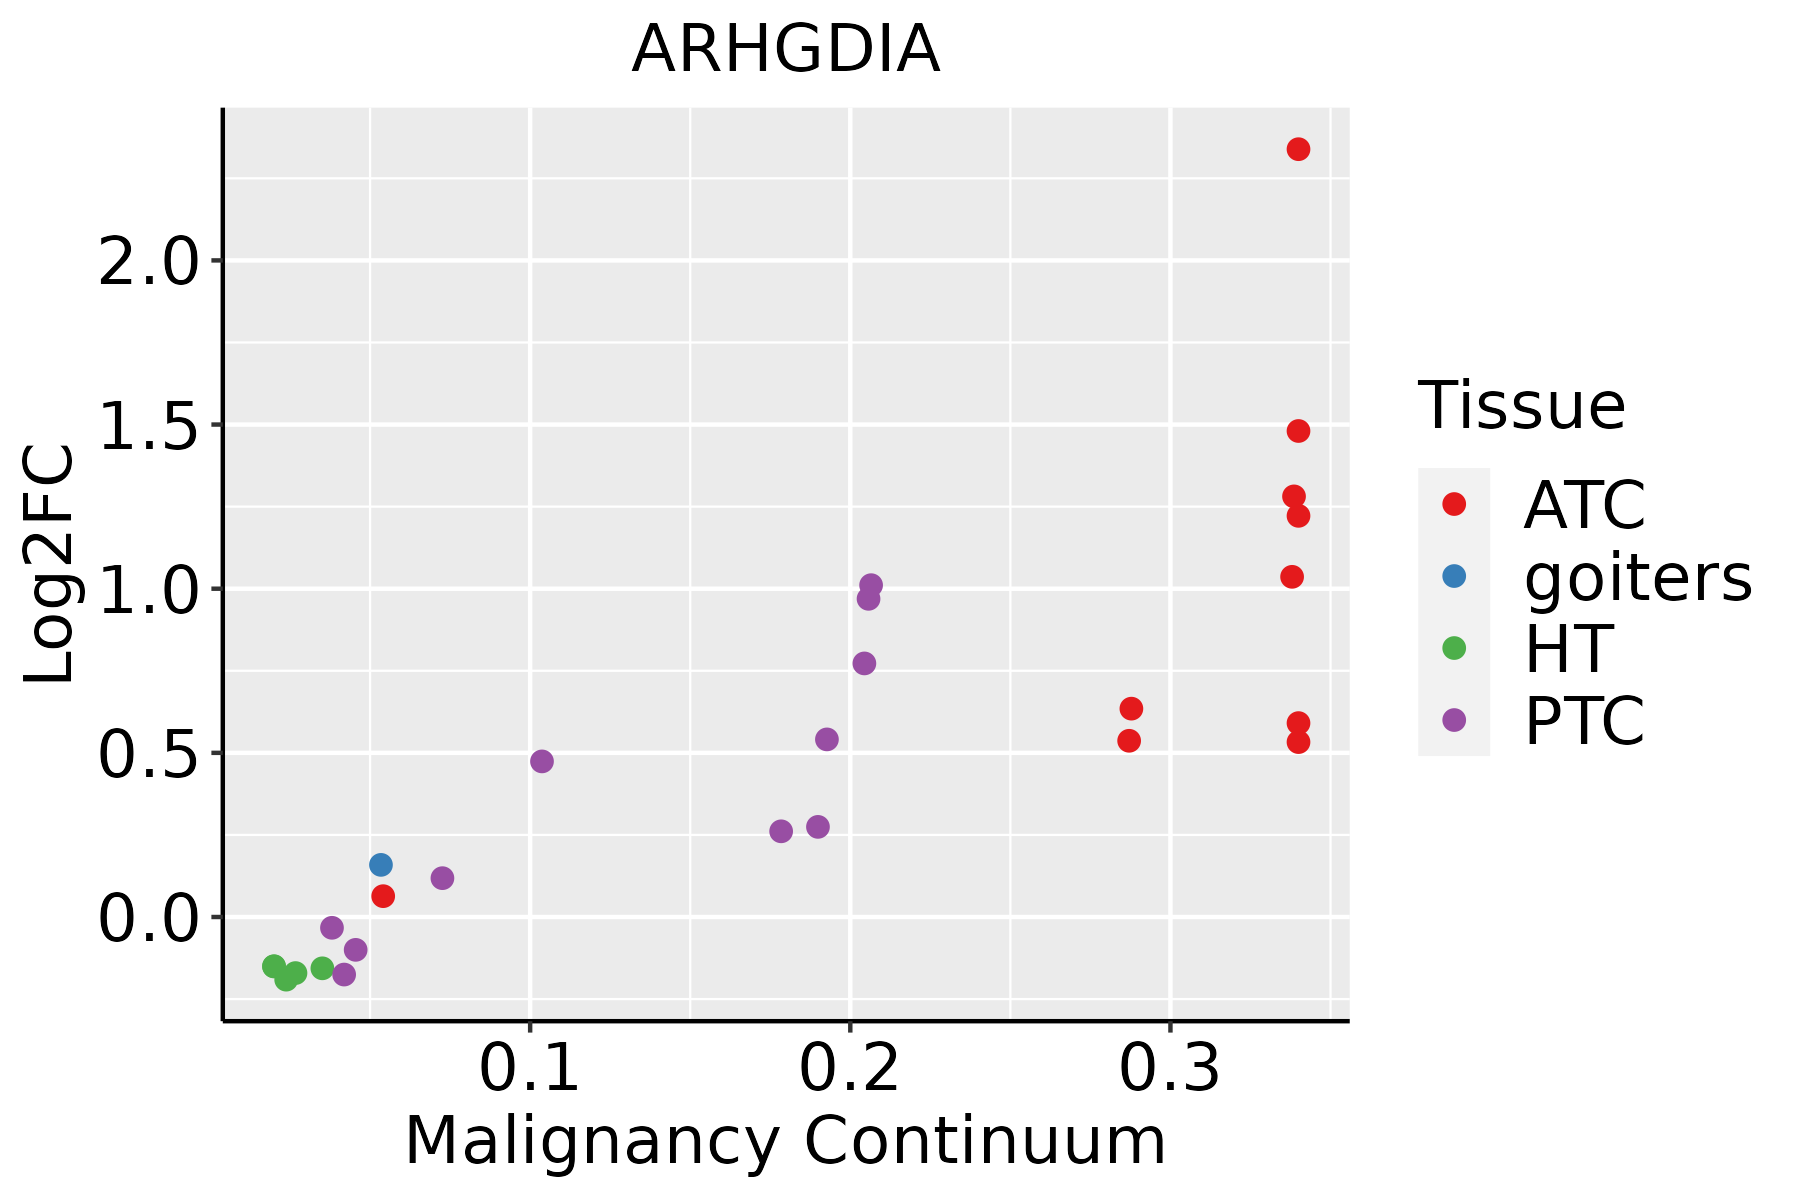 | ATC: Anaplastic thyroid cancer |
| HT: Hashimoto's thyroiditis | ||
| PTC: Papillary thyroid cancer |
| ∗log2FC in expression of this searched gene in stem-like cells from each diseased tissue sample relative to stem-like cells in normal samples in each tissue plotted against the malignancy continuum. Samples are colored based on if they are from different disease stage. |
Top |
Malignant transformation related pathway analysis |
| Find out the enriched GO biological processes and KEGG pathways involved in transition from healthy to precancer to cancer |
| Tissue | Disease Stage | Enriched GO biological Processes |
| Colorectum | AD |  |
| Colorectum | SER |  |
| Colorectum | MSS |  |
| Colorectum | MSI-H |  |
| Colorectum | FAP |  |
| ∗Top 15 enriched GO BP terms are showed in the bar plot of each disease state in each tissue. Each row represents a significant GO biological process which is colored according to the -log10(p.adjust). |
| Page: 1 2 3 4 5 6 7 8 9 |
| GO ID | Tissue | Disease Stage | Description | Gene Ratio | Bg Ratio | pvalue | p.adjust | Count |
| GO:002260415 | Endometrium | AEH | regulation of cell morphogenesis | 79/2100 | 309/18723 | 1.04e-12 | 2.24e-10 | 79 |
| GO:003297016 | Endometrium | AEH | regulation of actin filament-based process | 89/2100 | 397/18723 | 9.14e-11 | 1.10e-08 | 89 |
| GO:003295616 | Endometrium | AEH | regulation of actin cytoskeleton organization | 77/2100 | 358/18723 | 1.18e-08 | 7.76e-07 | 77 |
| GO:00315329 | Endometrium | AEH | actin cytoskeleton reorganization | 32/2100 | 107/18723 | 1.24e-07 | 5.80e-06 | 32 |
| GO:00510567 | Endometrium | AEH | regulation of small GTPase mediated signal transduction | 59/2100 | 302/18723 | 1.43e-05 | 3.03e-04 | 59 |
| GO:00303364 | Endometrium | AEH | negative regulation of cell migration | 65/2100 | 344/18723 | 1.65e-05 | 3.42e-04 | 65 |
| GO:20001464 | Endometrium | AEH | negative regulation of cell motility | 67/2100 | 359/18723 | 1.86e-05 | 3.77e-04 | 67 |
| GO:00512714 | Endometrium | AEH | negative regulation of cellular component movement | 68/2100 | 367/18723 | 2.06e-05 | 4.11e-04 | 68 |
| GO:00072657 | Endometrium | AEH | Ras protein signal transduction | 63/2100 | 337/18723 | 3.09e-05 | 5.66e-04 | 63 |
| GO:00400134 | Endometrium | AEH | negative regulation of locomotion | 70/2100 | 391/18723 | 4.95e-05 | 8.05e-04 | 70 |
| GO:00083609 | Endometrium | AEH | regulation of cell shape | 34/2100 | 154/18723 | 7.85e-05 | 1.18e-03 | 34 |
| GO:00096128 | Endometrium | AEH | response to mechanical stimulus | 42/2100 | 216/18723 | 2.58e-04 | 3.04e-03 | 42 |
| GO:007149616 | Endometrium | AEH | cellular response to external stimulus | 57/2100 | 320/18723 | 2.72e-04 | 3.14e-03 | 57 |
| GO:00465786 | Endometrium | AEH | regulation of Ras protein signal transduction | 36/2100 | 189/18723 | 1.01e-03 | 8.97e-03 | 36 |
| GO:00072667 | Endometrium | AEH | Rho protein signal transduction | 28/2100 | 137/18723 | 1.17e-03 | 1.01e-02 | 28 |
| GO:00712149 | Endometrium | AEH | cellular response to abiotic stimulus | 55/2100 | 331/18723 | 1.85e-03 | 1.46e-02 | 55 |
| GO:01040049 | Endometrium | AEH | cellular response to environmental stimulus | 55/2100 | 331/18723 | 1.85e-03 | 1.46e-02 | 55 |
| GO:20002494 | Endometrium | AEH | regulation of actin cytoskeleton reorganization | 11/2100 | 39/18723 | 2.92e-03 | 2.08e-02 | 11 |
| GO:00071627 | Endometrium | AEH | negative regulation of cell adhesion | 49/2100 | 303/18723 | 5.43e-03 | 3.37e-02 | 49 |
| GO:00350236 | Endometrium | AEH | regulation of Rho protein signal transduction | 18/2100 | 86/18723 | 6.39e-03 | 3.79e-02 | 18 |
| Page: 1 2 3 4 5 6 7 8 9 10 11 |
| Pathway ID | Tissue | Disease Stage | Description | Gene Ratio | Bg Ratio | pvalue | p.adjust | qvalue | Count |
| hsa0472216 | Endometrium | AEH | Neurotrophin signaling pathway | 31/1197 | 119/8465 | 4.07e-04 | 3.07e-03 | 2.25e-03 | 31 |
| hsa0472217 | Endometrium | AEH | Neurotrophin signaling pathway | 31/1197 | 119/8465 | 4.07e-04 | 3.07e-03 | 2.25e-03 | 31 |
| hsa0472222 | Endometrium | EEC | Neurotrophin signaling pathway | 30/1237 | 119/8465 | 1.54e-03 | 9.55e-03 | 7.12e-03 | 30 |
| hsa0472232 | Endometrium | EEC | Neurotrophin signaling pathway | 30/1237 | 119/8465 | 1.54e-03 | 9.55e-03 | 7.12e-03 | 30 |
| hsa0472225 | Esophagus | ESCC | Neurotrophin signaling pathway | 80/4205 | 119/8465 | 7.33e-05 | 3.07e-04 | 1.57e-04 | 80 |
| hsa0496223 | Esophagus | ESCC | Vasopressin-regulated water reabsorption | 33/4205 | 44/8465 | 5.27e-04 | 1.78e-03 | 9.13e-04 | 33 |
| hsa04722111 | Esophagus | ESCC | Neurotrophin signaling pathway | 80/4205 | 119/8465 | 7.33e-05 | 3.07e-04 | 1.57e-04 | 80 |
| hsa0496233 | Esophagus | ESCC | Vasopressin-regulated water reabsorption | 33/4205 | 44/8465 | 5.27e-04 | 1.78e-03 | 9.13e-04 | 33 |
| hsa0472210 | Liver | HCC | Neurotrophin signaling pathway | 74/4020 | 119/8465 | 8.27e-04 | 3.26e-03 | 1.81e-03 | 74 |
| hsa049624 | Liver | HCC | Vasopressin-regulated water reabsorption | 30/4020 | 44/8465 | 4.41e-03 | 1.32e-02 | 7.34e-03 | 30 |
| hsa0472211 | Liver | HCC | Neurotrophin signaling pathway | 74/4020 | 119/8465 | 8.27e-04 | 3.26e-03 | 1.81e-03 | 74 |
| hsa0496211 | Liver | HCC | Vasopressin-regulated water reabsorption | 30/4020 | 44/8465 | 4.41e-03 | 1.32e-02 | 7.34e-03 | 30 |
| hsa0472220 | Oral cavity | OSCC | Neurotrophin signaling pathway | 74/3704 | 119/8465 | 3.55e-05 | 1.49e-04 | 7.58e-05 | 74 |
| hsa049626 | Oral cavity | OSCC | Vasopressin-regulated water reabsorption | 29/3704 | 44/8465 | 2.47e-03 | 6.52e-03 | 3.32e-03 | 29 |
| hsa04722110 | Oral cavity | OSCC | Neurotrophin signaling pathway | 74/3704 | 119/8465 | 3.55e-05 | 1.49e-04 | 7.58e-05 | 74 |
| hsa0496213 | Oral cavity | OSCC | Vasopressin-regulated water reabsorption | 29/3704 | 44/8465 | 2.47e-03 | 6.52e-03 | 3.32e-03 | 29 |
| hsa0496222 | Oral cavity | LP | Vasopressin-regulated water reabsorption | 20/2418 | 44/8465 | 1.24e-02 | 4.10e-02 | 2.64e-02 | 20 |
| hsa0496232 | Oral cavity | LP | Vasopressin-regulated water reabsorption | 20/2418 | 44/8465 | 1.24e-02 | 4.10e-02 | 2.64e-02 | 20 |
| hsa0472218 | Prostate | BPH | Neurotrophin signaling pathway | 38/1718 | 119/8465 | 1.76e-03 | 7.16e-03 | 4.43e-03 | 38 |
| hsa049625 | Prostate | BPH | Vasopressin-regulated water reabsorption | 17/1718 | 44/8465 | 3.88e-03 | 1.39e-02 | 8.61e-03 | 17 |
| Page: 1 2 |
Top |
Cell-cell communication analysis |
| Identification of potential cell-cell interactions between two cell types and their ligand-receptor pairs for different disease states |
| Ligand | Receptor | LRpair | Pathway | Tissue | Disease Stage |
| Page: 1 |
Top |
Single-cell gene regulatory network inference analysis |
| Find out the significant the regulons (TFs) and the target genes of each regulon across cell types for different disease states |
| TF | Cell Type | Tissue | Disease Stage | Target Gene | RSS | Regulon Activity |
| ∗The dot plots of a searched regulon are shown for all cell subpopulations in each disease state of each tissue based on the regulon specific score inferred using pySCENIC and by calculating the average expression. |
| Page: 1 |
Top |
Somatic mutation of malignant transformation related genes |
| Annotation of somatic variants for genes involved in malignant transformation |
| Hugo Symbol | Variant Class | Variant Classification | dbSNP RS | HGVSc | HGVSp | HGVSp Short | SWISSPROT | BIOTYPE | SIFT | PolyPhen | Tumor Sample Barcode | Tissue | Histology | Sex | Age | Stage | Therapy Types | Drugs | Outcome |
| ARHGDIA | SNV | Missense_Mutation | novel | c.265N>A | p.Asp89Asn | p.D89N | protein_coding | tolerated(0.06) | benign(0.045) | TCGA-JL-A3YX-01 | Breast | breast invasive carcinoma | Female | <65 | I/II | Unknown | Unknown | SD | |
| ARHGDIA | SNV | Missense_Mutation | c.337N>C | p.Lys113Gln | p.K113Q | protein_coding | deleterious(0.03) | possibly_damaging(0.492) | TCGA-AA-3510-01 | Colorectum | colon adenocarcinoma | Male | >=65 | I/II | Unknown | Unknown | SD | ||
| ARHGDIA | SNV | Missense_Mutation | c.454C>T | p.Arg152Trp | p.R152W | protein_coding | deleterious(0) | probably_damaging(0.994) | TCGA-CK-4951-01 | Colorectum | colon adenocarcinoma | Female | >=65 | I/II | Unknown | Unknown | PD | ||
| ARHGDIA | SNV | Missense_Mutation | rs200283878 | c.199N>A | p.Val67Ile | p.V67I | protein_coding | tolerated(0.2) | benign(0.003) | TCGA-F4-6703-01 | Colorectum | colon adenocarcinoma | Male | <65 | I/II | Unknown | Unknown | SD | |
| ARHGDIA | SNV | Missense_Mutation | novel | c.288N>A | p.Ser96Arg | p.S96R | protein_coding | tolerated(0.06) | benign(0.286) | TCGA-A5-A0G1-01 | Endometrium | uterine corpus endometrioid carcinoma | Female | >=65 | I/II | Unknown | Unknown | SD | |
| ARHGDIA | SNV | Missense_Mutation | c.395C>T | p.Thr132Met | p.T132M | protein_coding | deleterious(0.05) | possibly_damaging(0.465) | TCGA-A5-A7WJ-01 | Endometrium | uterine corpus endometrioid carcinoma | Female | <65 | I/II | Unknown | Unknown | SD | ||
| ARHGDIA | SNV | Missense_Mutation | novel | c.119N>G | p.Glu40Gly | p.E40G | protein_coding | deleterious(0.03) | benign(0.09) | TCGA-AP-A059-01 | Endometrium | uterine corpus endometrioid carcinoma | Female | >=65 | I/II | Unknown | Unknown | SD | |
| ARHGDIA | SNV | Missense_Mutation | c.133G>A | p.Asp45Asn | p.D45N | protein_coding | deleterious(0.01) | probably_damaging(0.985) | TCGA-AP-A0LM-01 | Endometrium | uterine corpus endometrioid carcinoma | Female | <65 | III/IV | Chemotherapy | cisplatin | SD | ||
| ARHGDIA | SNV | Missense_Mutation | rs752693120 | c.187N>A | p.Ala63Thr | p.A63T | protein_coding | tolerated(0.09) | benign(0.01) | TCGA-AP-A1DV-01 | Endometrium | uterine corpus endometrioid carcinoma | Female | <65 | I/II | Unknown | Unknown | SD | |
| ARHGDIA | SNV | Missense_Mutation | c.412N>G | p.Lys138Glu | p.K138E | protein_coding | deleterious(0.01) | possibly_damaging(0.461) | TCGA-B5-A11E-01 | Endometrium | uterine corpus endometrioid carcinoma | Female | <65 | I/II | Unknown | Unknown | SD |
| Page: 1 2 |
Top |
Related drugs of malignant transformation related genes |
| Identification of chemicals and drugs interact with genes involved in malignant transfromation |
| (DGIdb 4.0) |
| Entrez ID | Symbol | Category | Interaction Types | Drug Claim Name | Drug Name | PMIDs |
| Page: 1 |

Copyright 2023-Present -The University of Texas Health Science Center at Houston |