
|
|||||
|
 | |
| |
| |
| |
| |
| |
|
Gene: ARHGAP8 |
Gene summary for ARHGAP8 |
| Gene information | Species | Human | Gene symbol | ARHGAP8 | Gene ID | 23779 |
| Gene name | Rho GTPase activating protein 8 | |
| Gene Alias | BPGAP1 | |
| Cytomap | 22q13.31 | |
| Gene Type | protein-coding | GO ID | GO:0000165 | UniProtAcc | P85298 |
Top |
Malignant transformation analysis |
| Identification of the aberrant gene expression in precancerous and cancerous lesions by comparing the gene expression of stem-like cells in diseased tissues with normal stem cells |
| Entrez ID | Symbol | Replicates | Species | Organ | Tissue | Adj P-value | Log2FC | Malignancy |
| 23779 | ARHGAP8 | HTA11_3410_2000001011 | Human | Colorectum | AD | 1.03e-43 | 7.09e-01 | 0.0155 |
| 23779 | ARHGAP8 | HTA11_2487_2000001011 | Human | Colorectum | SER | 3.26e-23 | 5.08e-01 | -0.1808 |
| 23779 | ARHGAP8 | HTA11_2951_2000001011 | Human | Colorectum | AD | 3.35e-17 | 8.18e-01 | 0.0216 |
| 23779 | ARHGAP8 | HTA11_1938_2000001011 | Human | Colorectum | AD | 2.41e-58 | 1.39e+00 | -0.0811 |
| 23779 | ARHGAP8 | HTA11_78_2000001011 | Human | Colorectum | AD | 3.01e-46 | 9.94e-01 | -0.1088 |
| 23779 | ARHGAP8 | HTA11_347_2000001011 | Human | Colorectum | AD | 3.89e-58 | 9.40e-01 | -0.1954 |
| 23779 | ARHGAP8 | HTA11_411_2000001011 | Human | Colorectum | SER | 4.42e-10 | 6.71e-01 | -0.2602 |
| 23779 | ARHGAP8 | HTA11_2112_2000001011 | Human | Colorectum | SER | 8.76e-08 | 6.16e-01 | -0.2196 |
| 23779 | ARHGAP8 | HTA11_3361_2000001011 | Human | Colorectum | AD | 1.85e-32 | 7.98e-01 | -0.1207 |
| 23779 | ARHGAP8 | HTA11_83_2000001011 | Human | Colorectum | SER | 2.04e-26 | 8.33e-01 | -0.1526 |
| 23779 | ARHGAP8 | HTA11_696_2000001011 | Human | Colorectum | AD | 7.45e-41 | 7.68e-01 | -0.1464 |
| 23779 | ARHGAP8 | HTA11_866_2000001011 | Human | Colorectum | AD | 3.41e-81 | 1.43e+00 | -0.1001 |
| 23779 | ARHGAP8 | HTA11_1391_2000001011 | Human | Colorectum | AD | 1.41e-54 | 1.27e+00 | -0.059 |
| 23779 | ARHGAP8 | HTA11_2992_2000001011 | Human | Colorectum | SER | 1.02e-19 | 7.97e-01 | -0.1706 |
| 23779 | ARHGAP8 | HTA11_5212_2000001011 | Human | Colorectum | AD | 1.67e-10 | 4.22e-01 | -0.2061 |
| 23779 | ARHGAP8 | HTA11_5216_2000001011 | Human | Colorectum | SER | 3.35e-17 | 7.39e-01 | -0.1462 |
| 23779 | ARHGAP8 | HTA11_546_2000001011 | Human | Colorectum | AD | 5.29e-42 | 1.17e+00 | -0.0842 |
| 23779 | ARHGAP8 | HTA11_9341_2000001011 | Human | Colorectum | SER | 1.20e-07 | 4.20e-01 | -0.00410000000000005 |
| 23779 | ARHGAP8 | HTA11_7862_2000001011 | Human | Colorectum | AD | 1.13e-21 | 6.89e-01 | -0.0179 |
| 23779 | ARHGAP8 | HTA11_866_3004761011 | Human | Colorectum | AD | 8.37e-59 | 1.07e+00 | 0.096 |
| Page: 1 2 3 4 5 |
| Tissue | Expression Dynamics | Abbreviation |
| Colorectum (GSE201348) |  | FAP: Familial adenomatous polyposis |
| CRC: Colorectal cancer | ||
| Colorectum (HTA11) |  | AD: Adenomas |
| SER: Sessile serrated lesions | ||
| MSI-H: Microsatellite-high colorectal cancer | ||
| MSS: Microsatellite stable colorectal cancer | ||
| Esophagus | 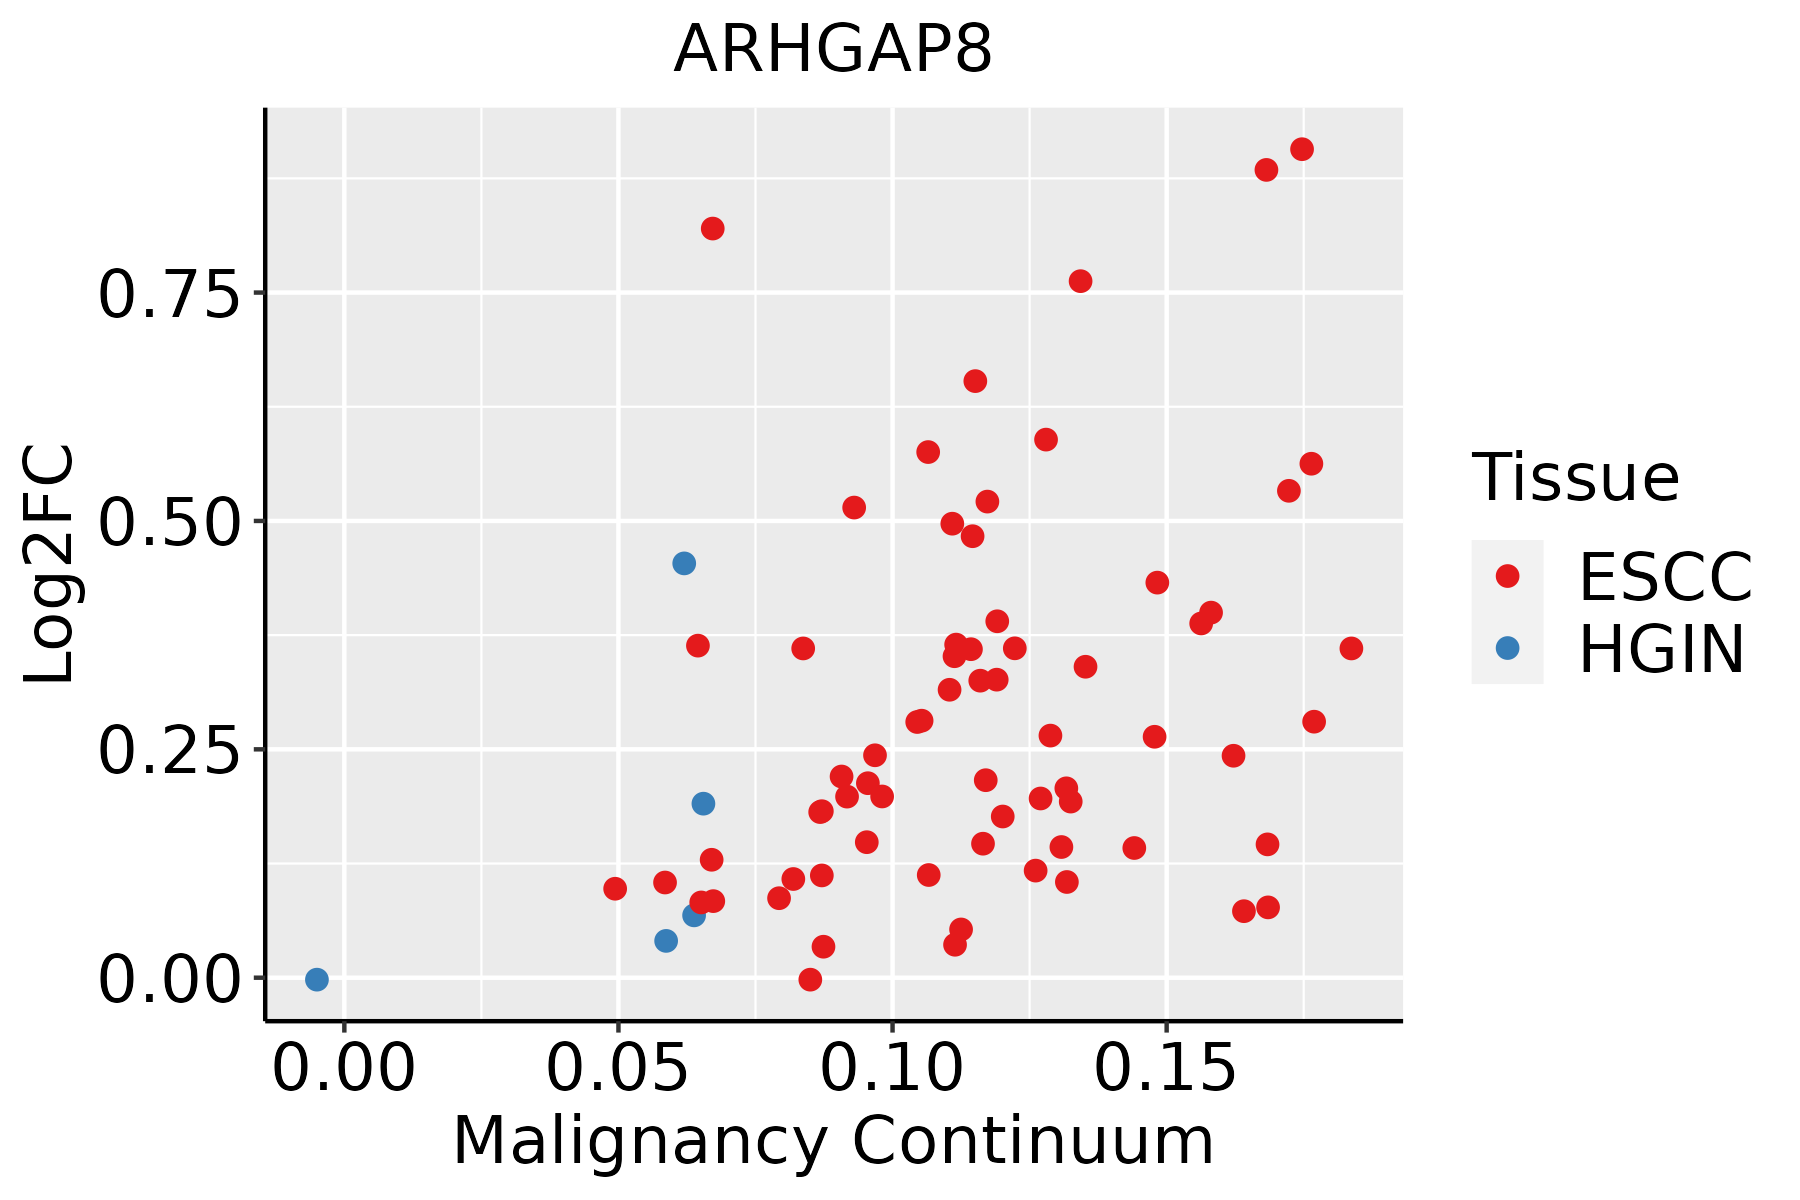 | ESCC: Esophageal squamous cell carcinoma |
| HGIN: High-grade intraepithelial neoplasias | ||
| LGIN: Low-grade intraepithelial neoplasias | ||
| Lung | 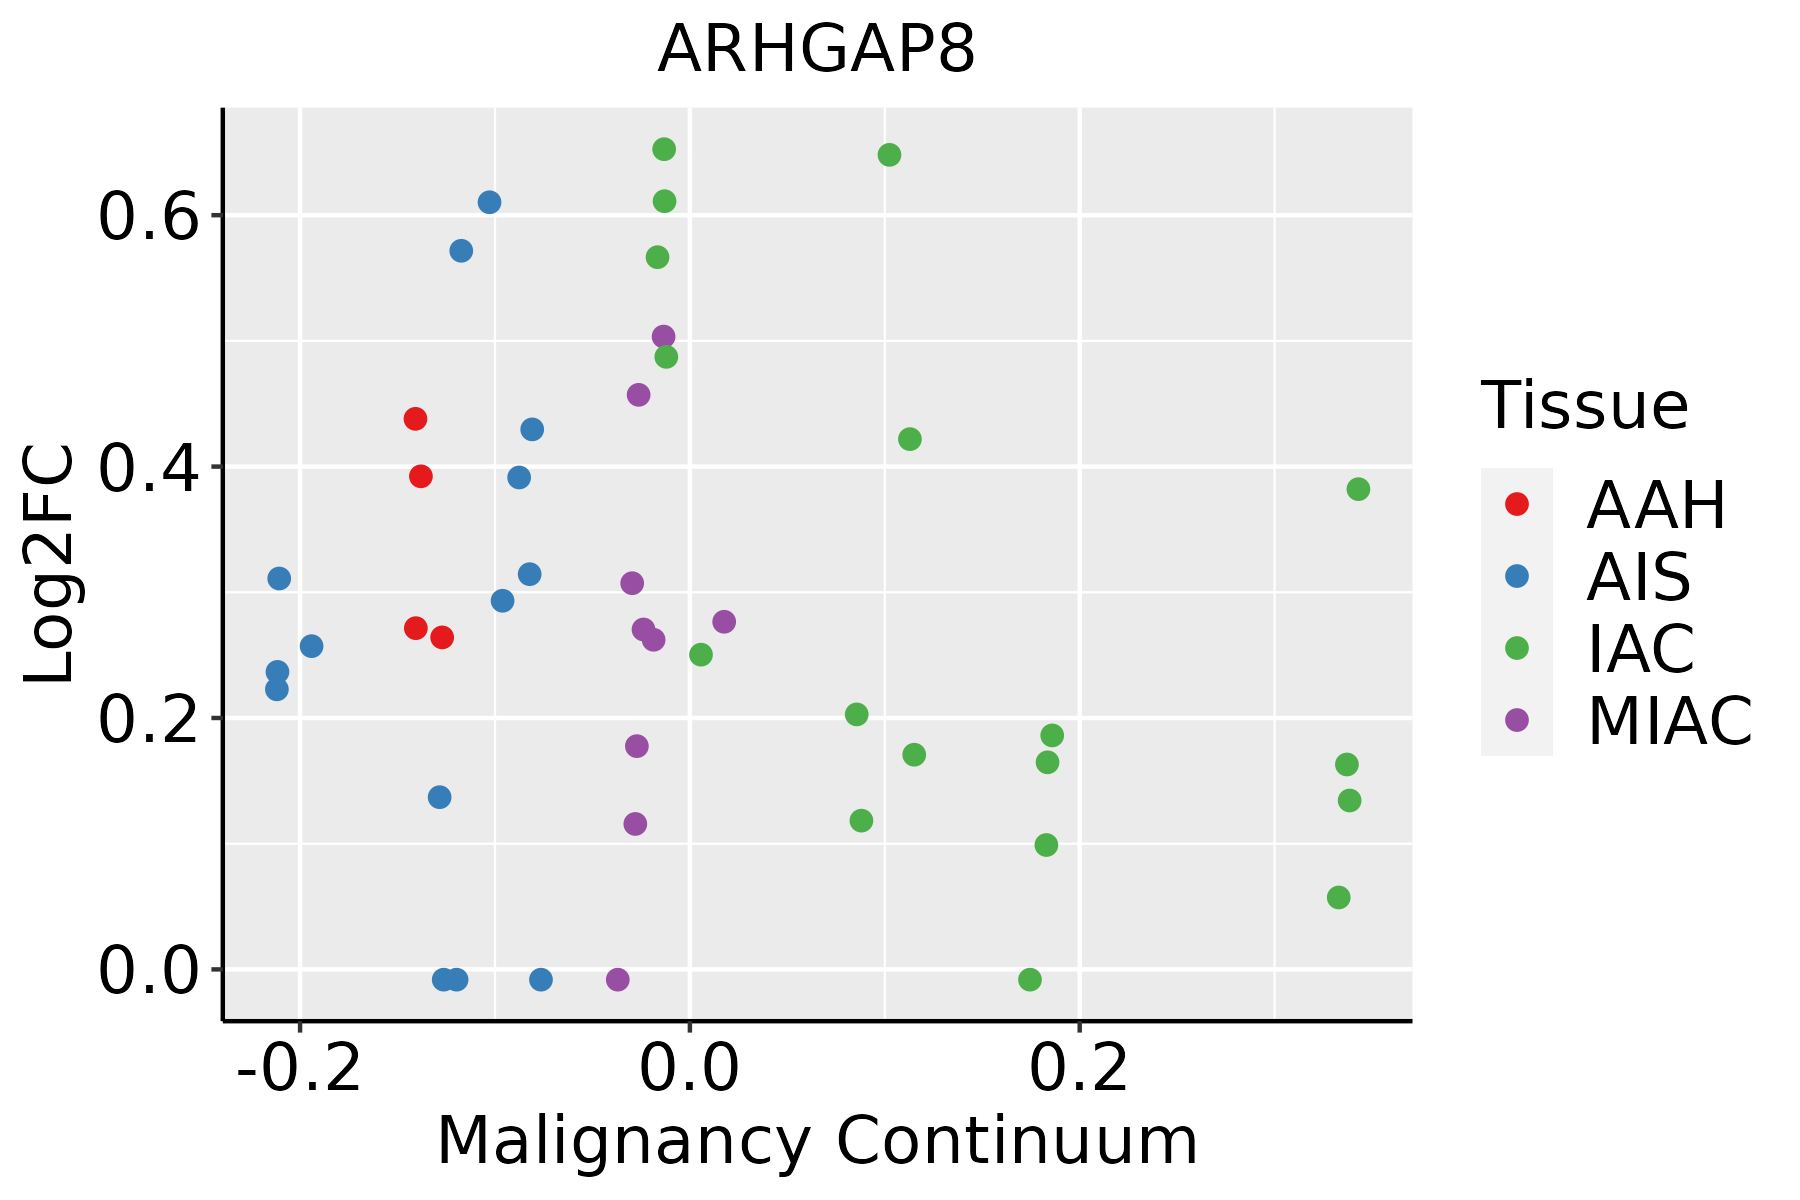 | AAH: Atypical adenomatous hyperplasia |
| AIS: Adenocarcinoma in situ | ||
| IAC: Invasive lung adenocarcinoma | ||
| MIA: Minimally invasive adenocarcinoma |
| ∗log2FC in expression of this searched gene in stem-like cells from each diseased tissue sample relative to stem-like cells in normal samples in each tissue plotted against the malignancy continuum. Samples are colored based on if they are from different disease stage. |
Top |
Malignant transformation related pathway analysis |
| Find out the enriched GO biological processes and KEGG pathways involved in transition from healthy to precancer to cancer |
| Tissue | Disease Stage | Enriched GO biological Processes |
| Colorectum | AD |  |
| Colorectum | SER |  |
| Colorectum | MSS |  |
| Colorectum | MSI-H |  |
| Colorectum | FAP |  |
| ∗Top 15 enriched GO BP terms are showed in the bar plot of each disease state in each tissue. Each row represents a significant GO biological process which is colored according to the -log10(p.adjust). |
| Page: 1 2 3 4 5 6 7 8 9 |
| GO ID | Tissue | Disease Stage | Description | Gene Ratio | Bg Ratio | pvalue | p.adjust | Count |
| GO:0051056 | Colorectum | AD | regulation of small GTPase mediated signal transduction | 94/3918 | 302/18723 | 1.81e-05 | 3.76e-04 | 94 |
| GO:00510561 | Colorectum | MSS | regulation of small GTPase mediated signal transduction | 82/3467 | 302/18723 | 1.31e-04 | 1.99e-03 | 82 |
| GO:00510562 | Colorectum | FAP | regulation of small GTPase mediated signal transduction | 78/2622 | 302/18723 | 3.25e-08 | 2.85e-06 | 78 |
| GO:005105610 | Esophagus | ESCC | regulation of small GTPase mediated signal transduction | 157/8552 | 302/18723 | 1.55e-02 | 4.98e-02 | 157 |
| GO:00510565 | Lung | IAC | regulation of small GTPase mediated signal transduction | 70/2061 | 302/18723 | 9.44e-10 | 1.87e-07 | 70 |
| GO:00434103 | Lung | IAC | positive regulation of MAPK cascade | 78/2061 | 480/18723 | 2.72e-04 | 4.50e-03 | 78 |
| GO:005105611 | Lung | AIS | regulation of small GTPase mediated signal transduction | 66/1849 | 302/18723 | 4.26e-10 | 9.53e-08 | 66 |
| GO:00434101 | Lung | AIS | positive regulation of MAPK cascade | 72/1849 | 480/18723 | 2.11e-04 | 4.32e-03 | 72 |
| GO:0070371 | Lung | AIS | ERK1 and ERK2 cascade | 52/1849 | 330/18723 | 4.80e-04 | 7.95e-03 | 52 |
| GO:0070372 | Lung | AIS | regulation of ERK1 and ERK2 cascade | 48/1849 | 309/18723 | 1.06e-03 | 1.38e-02 | 48 |
| Page: 1 |
| Pathway ID | Tissue | Disease Stage | Description | Gene Ratio | Bg Ratio | pvalue | p.adjust | qvalue | Count |
| Page: 1 |
Top |
Cell-cell communication analysis |
| Identification of potential cell-cell interactions between two cell types and their ligand-receptor pairs for different disease states |
| Ligand | Receptor | LRpair | Pathway | Tissue | Disease Stage |
| Page: 1 |
Top |
Single-cell gene regulatory network inference analysis |
| Find out the significant the regulons (TFs) and the target genes of each regulon across cell types for different disease states |
| TF | Cell Type | Tissue | Disease Stage | Target Gene | RSS | Regulon Activity |
| ∗The dot plots of a searched regulon are shown for all cell subpopulations in each disease state of each tissue based on the regulon specific score inferred using pySCENIC and by calculating the average expression. |
| Page: 1 |
Top |
Somatic mutation of malignant transformation related genes |
| Annotation of somatic variants for genes involved in malignant transformation |
| Hugo Symbol | Variant Class | Variant Classification | dbSNP RS | HGVSc | HGVSp | HGVSp Short | SWISSPROT | BIOTYPE | SIFT | PolyPhen | Tumor Sample Barcode | Tissue | Histology | Sex | Age | Stage | Therapy Types | Drugs | Outcome |
| ARHGAP8 | insertion | Nonsense_Mutation | novel | c.267_268insATCACGAGGTCAGAAGATCAAGACCATCCTGGCTAA | p.Trp89_Leu90insIleThrArgSerGluAspGlnAspHisProGlyTer | p.W89_L90insITRSEDQDHPG* | P85298 | protein_coding | TCGA-A8-A08H-01 | Breast | breast invasive carcinoma | Female | >=65 | I/II | Unknown | Unknown | SD | ||
| ARHGAP8 | SNV | Missense_Mutation | novel | c.332T>G | p.Val111Gly | p.V111G | P85298 | protein_coding | tolerated_low_confidence(0.56) | benign(0.063) | TCGA-AA-3710-01 | Colorectum | colon adenocarcinoma | Female | >=65 | I/II | Unknown | Unknown | SD |
| ARHGAP8 | SNV | Missense_Mutation | rs562703546 | c.421N>A | p.Val141Met | p.V141M | P85298 | protein_coding | deleterious(0) | probably_damaging(0.975) | TCGA-AA-3949-01 | Colorectum | colon adenocarcinoma | Female | >=65 | III/IV | Unknown | Unknown | SD |
| ARHGAP8 | SNV | Missense_Mutation | c.518T>C | p.Leu173Pro | p.L173P | P85298 | protein_coding | deleterious(0) | probably_damaging(1) | TCGA-G4-6320-01 | Colorectum | colon adenocarcinoma | Male | >=65 | III/IV | Chemotherapy | oxaliplatin | SD | |
| ARHGAP8 | SNV | Missense_Mutation | rs540915857 | c.712G>A | p.Glu238Lys | p.E238K | P85298 | protein_coding | tolerated(0.07) | benign(0.075) | TCGA-EI-6917-01 | Colorectum | rectum adenocarcinoma | Male | <65 | III/IV | Chemotherapy | 5fluorouracil+oxaciplatina+l-folinian | SD |
| ARHGAP8 | deletion | Frame_Shift_Del | c.725delC | p.Pro242LeufsTer3 | p.P242Lfs*3 | P85298 | protein_coding | TCGA-AG-A02N-01 | Colorectum | rectum adenocarcinoma | Male | >=65 | I/II | Chemotherapy | folinic | CR | |||
| ARHGAP8 | SNV | Missense_Mutation | rs538343031 | c.232N>A | p.Gly78Arg | p.G78R | P85298 | protein_coding | deleterious(0.01) | probably_damaging(0.944) | TCGA-A5-A0G1-01 | Endometrium | uterine corpus endometrioid carcinoma | Female | >=65 | I/II | Unknown | Unknown | SD |
| ARHGAP8 | SNV | Missense_Mutation | novel | c.220T>C | p.Tyr74His | p.Y74H | P85298 | protein_coding | deleterious(0) | probably_damaging(0.992) | TCGA-AJ-A3EL-01 | Endometrium | uterine corpus endometrioid carcinoma | Female | <65 | I/II | Unknown | Unknown | SD |
| ARHGAP8 | SNV | Missense_Mutation | rs200649519 | c.811N>A | p.Val271Ile | p.V271I | P85298 | protein_coding | tolerated(0.42) | benign(0.009) | TCGA-AJ-A3NE-01 | Endometrium | uterine corpus endometrioid carcinoma | Female | <65 | I/II | Unknown | Unknown | SD |
| ARHGAP8 | SNV | Missense_Mutation | c.448N>A | p.Val150Ile | p.V150I | P85298 | protein_coding | tolerated(0.73) | benign(0.029) | TCGA-AP-A051-01 | Endometrium | uterine corpus endometrioid carcinoma | Female | >=65 | I/II | Unknown | Unknown | SD |
| Page: 1 2 3 4 |
Top |
Related drugs of malignant transformation related genes |
| Identification of chemicals and drugs interact with genes involved in malignant transfromation |
| (DGIdb 4.0) |
| Entrez ID | Symbol | Category | Interaction Types | Drug Claim Name | Drug Name | PMIDs |
| Page: 1 |

Copyright 2023-Present -The University of Texas Health Science Center at Houston |