| Tissue | Expression Dynamics | Abbreviation |
| Cervix |  | CC: Cervix cancer |
| HSIL_HPV: HPV-infected high-grade squamous intraepithelial lesions |
| N_HPV: HPV-infected normal cervix |
| Colorectum (GSE201348) |  | FAP: Familial adenomatous polyposis |
| CRC: Colorectal cancer |
| Colorectum (HTA11) |  | AD: Adenomas |
| SER: Sessile serrated lesions |
| MSI-H: Microsatellite-high colorectal cancer |
| MSS: Microsatellite stable colorectal cancer |
| Esophagus | 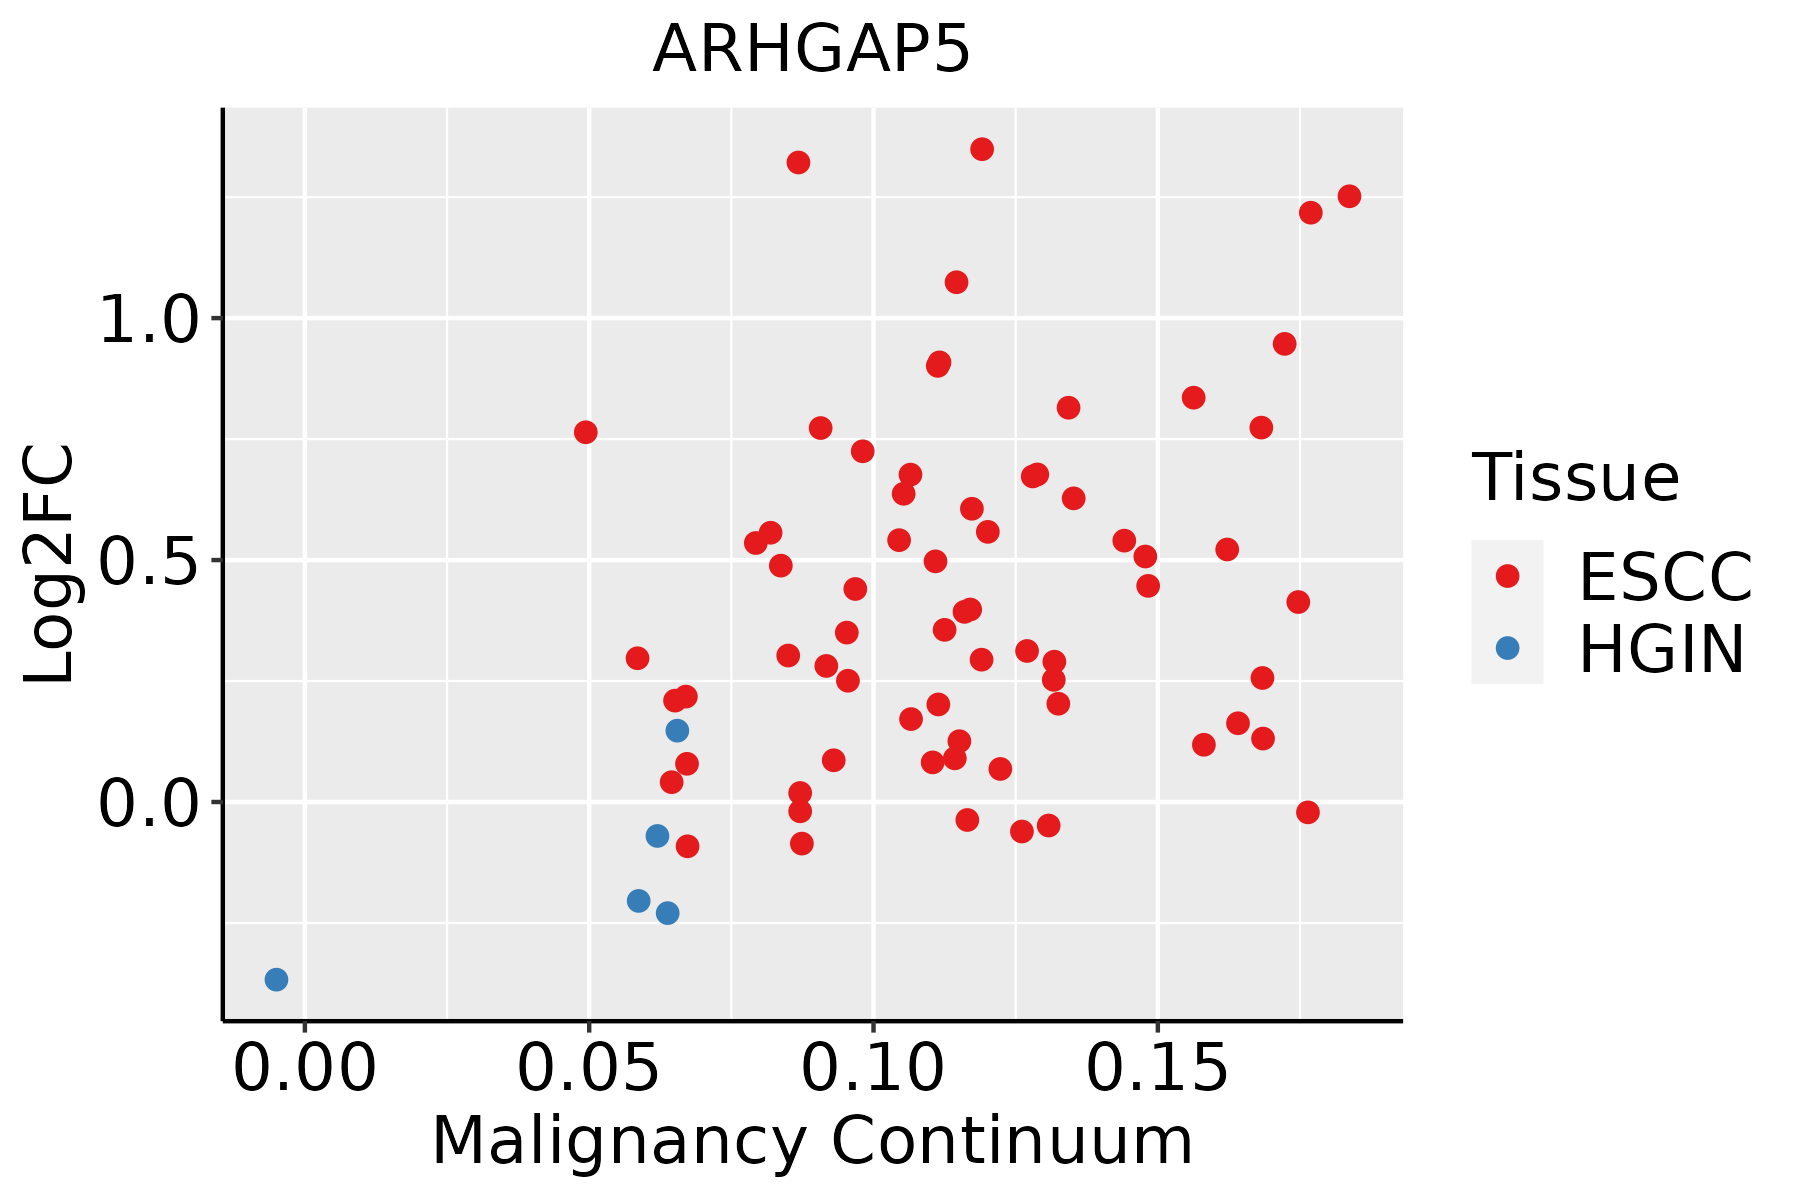 | ESCC: Esophageal squamous cell carcinoma |
| HGIN: High-grade intraepithelial neoplasias |
| LGIN: Low-grade intraepithelial neoplasias |
| GC |  | CAG: Chronic atrophic gastritis |
| CAG with IM: Chronic atrophic gastritis with intestinal metaplasia |
| CSG: Chronic superficial gastritis |
| GC: Gastric cancer |
| SIM: Severe intestinal metaplasia |
| WIM: Wild intestinal metaplasia |
| Liver | 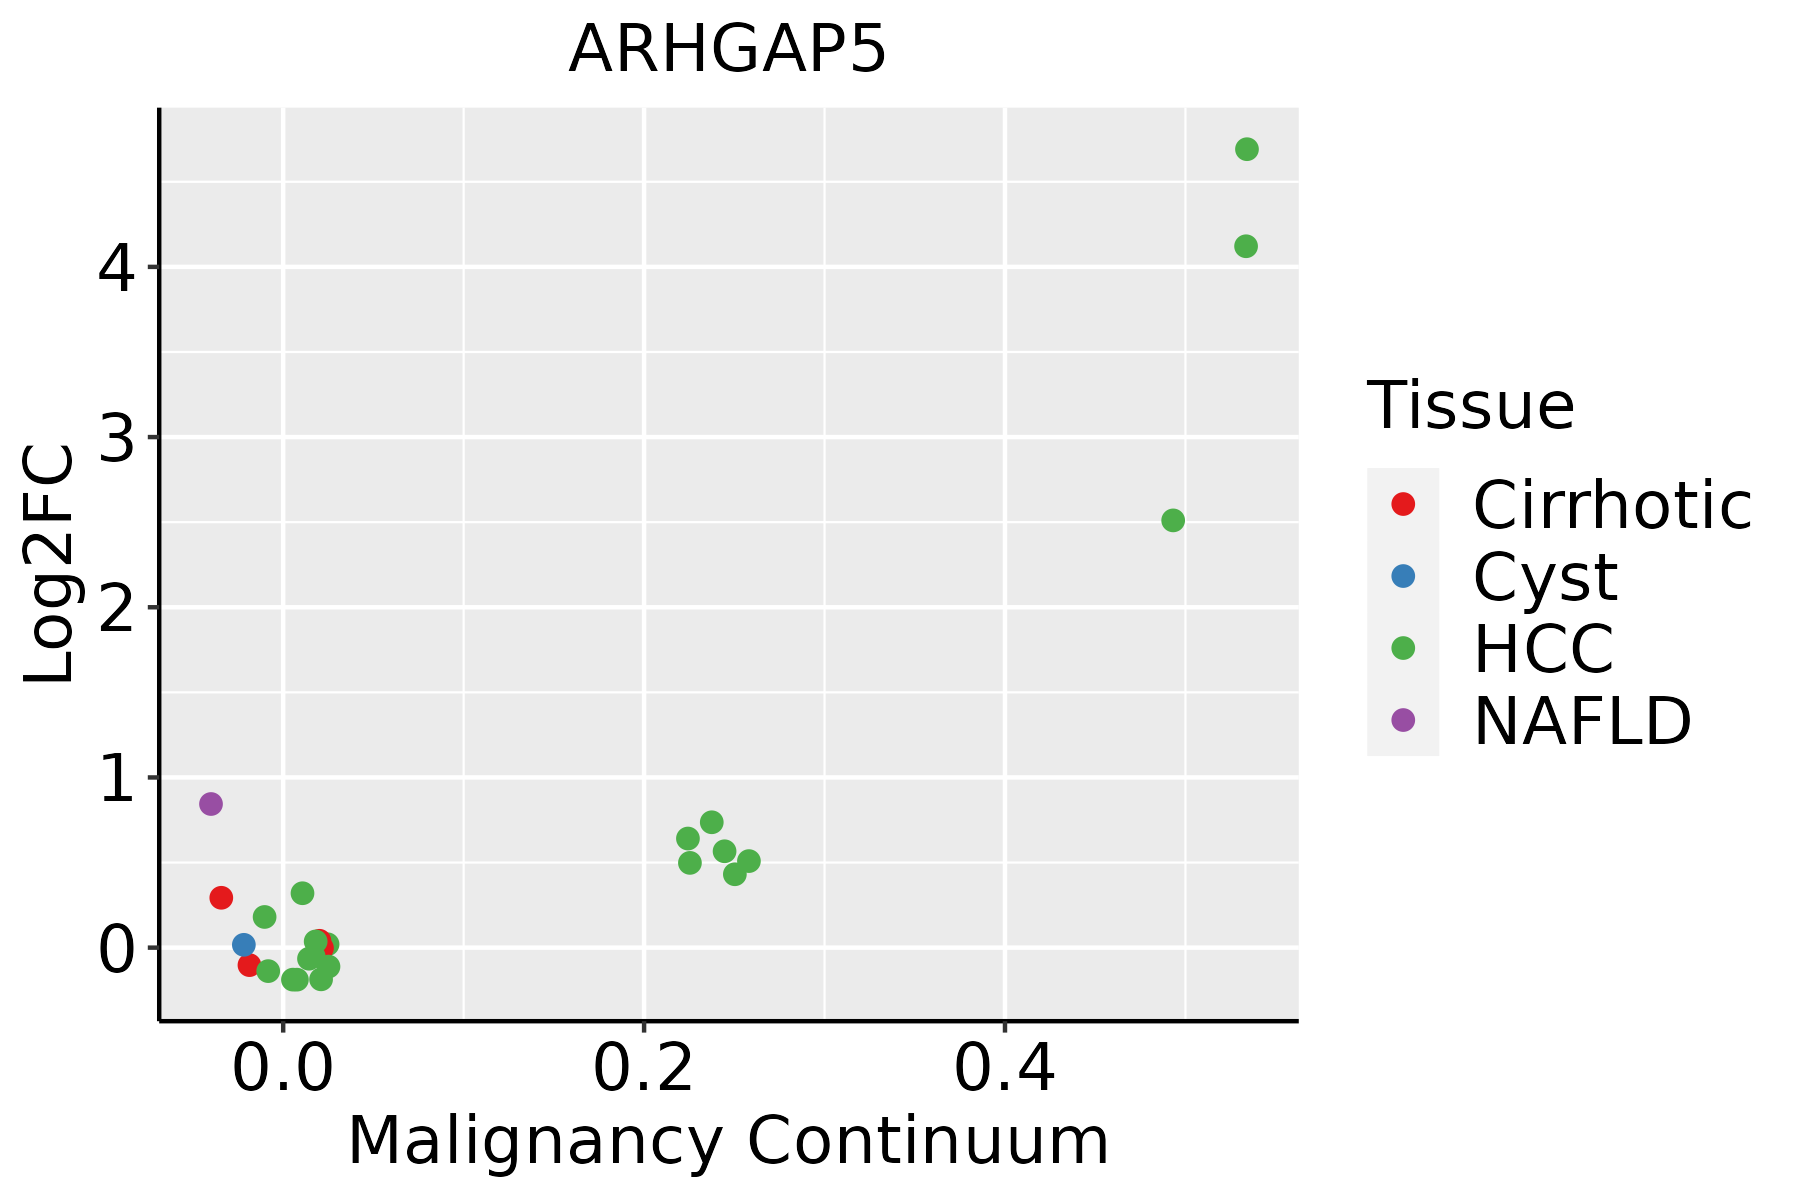 | HCC: Hepatocellular carcinoma |
| NAFLD: Non-alcoholic fatty liver disease |
| Lung |  | AAH: Atypical adenomatous hyperplasia |
| AIS: Adenocarcinoma in situ |
| IAC: Invasive lung adenocarcinoma |
| MIA: Minimally invasive adenocarcinoma |
| Oral Cavity | 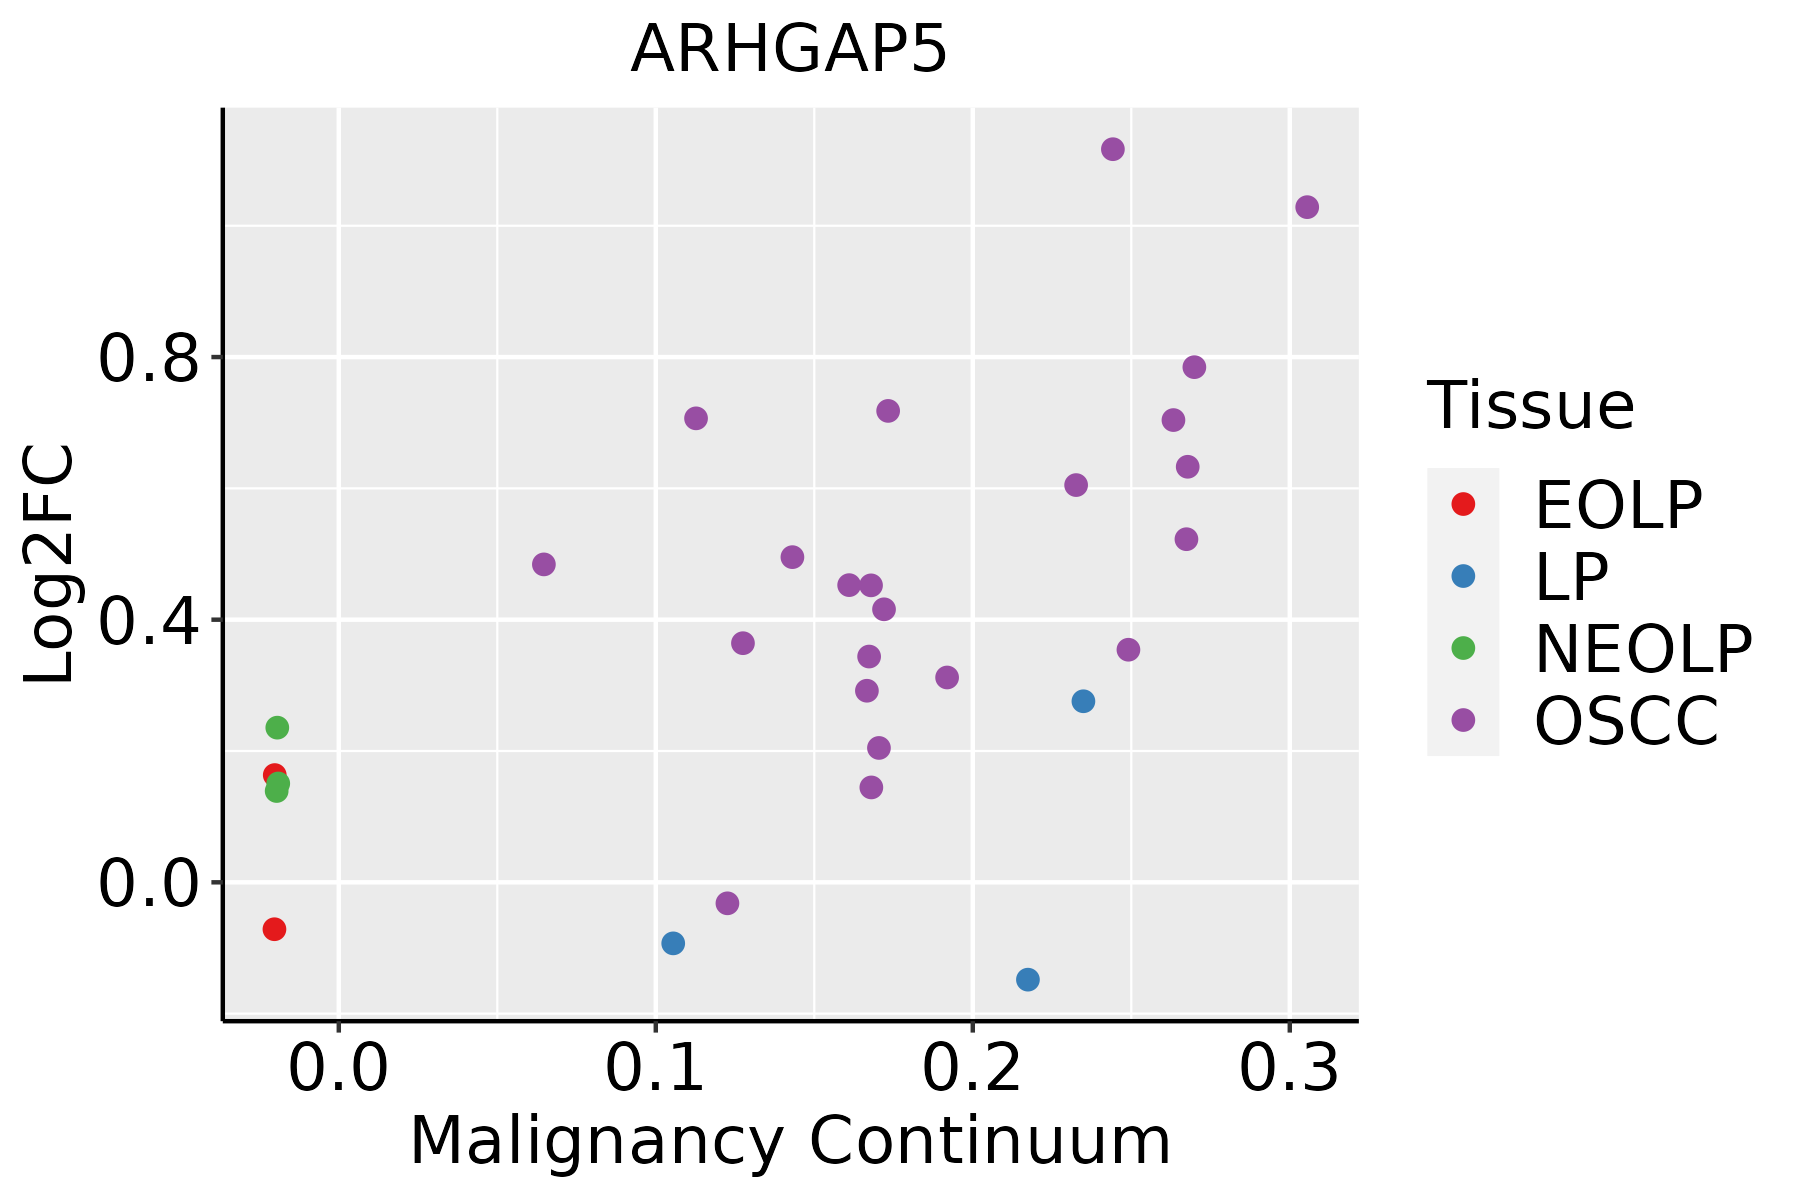 | EOLP: Erosive Oral lichen planus |
| LP: leukoplakia |
| NEOLP: Non-erosive oral lichen planus |
| OSCC: Oral squamous cell carcinoma |
| Prostate |  | BPH: Benign Prostatic Hyperplasia |
| Skin | 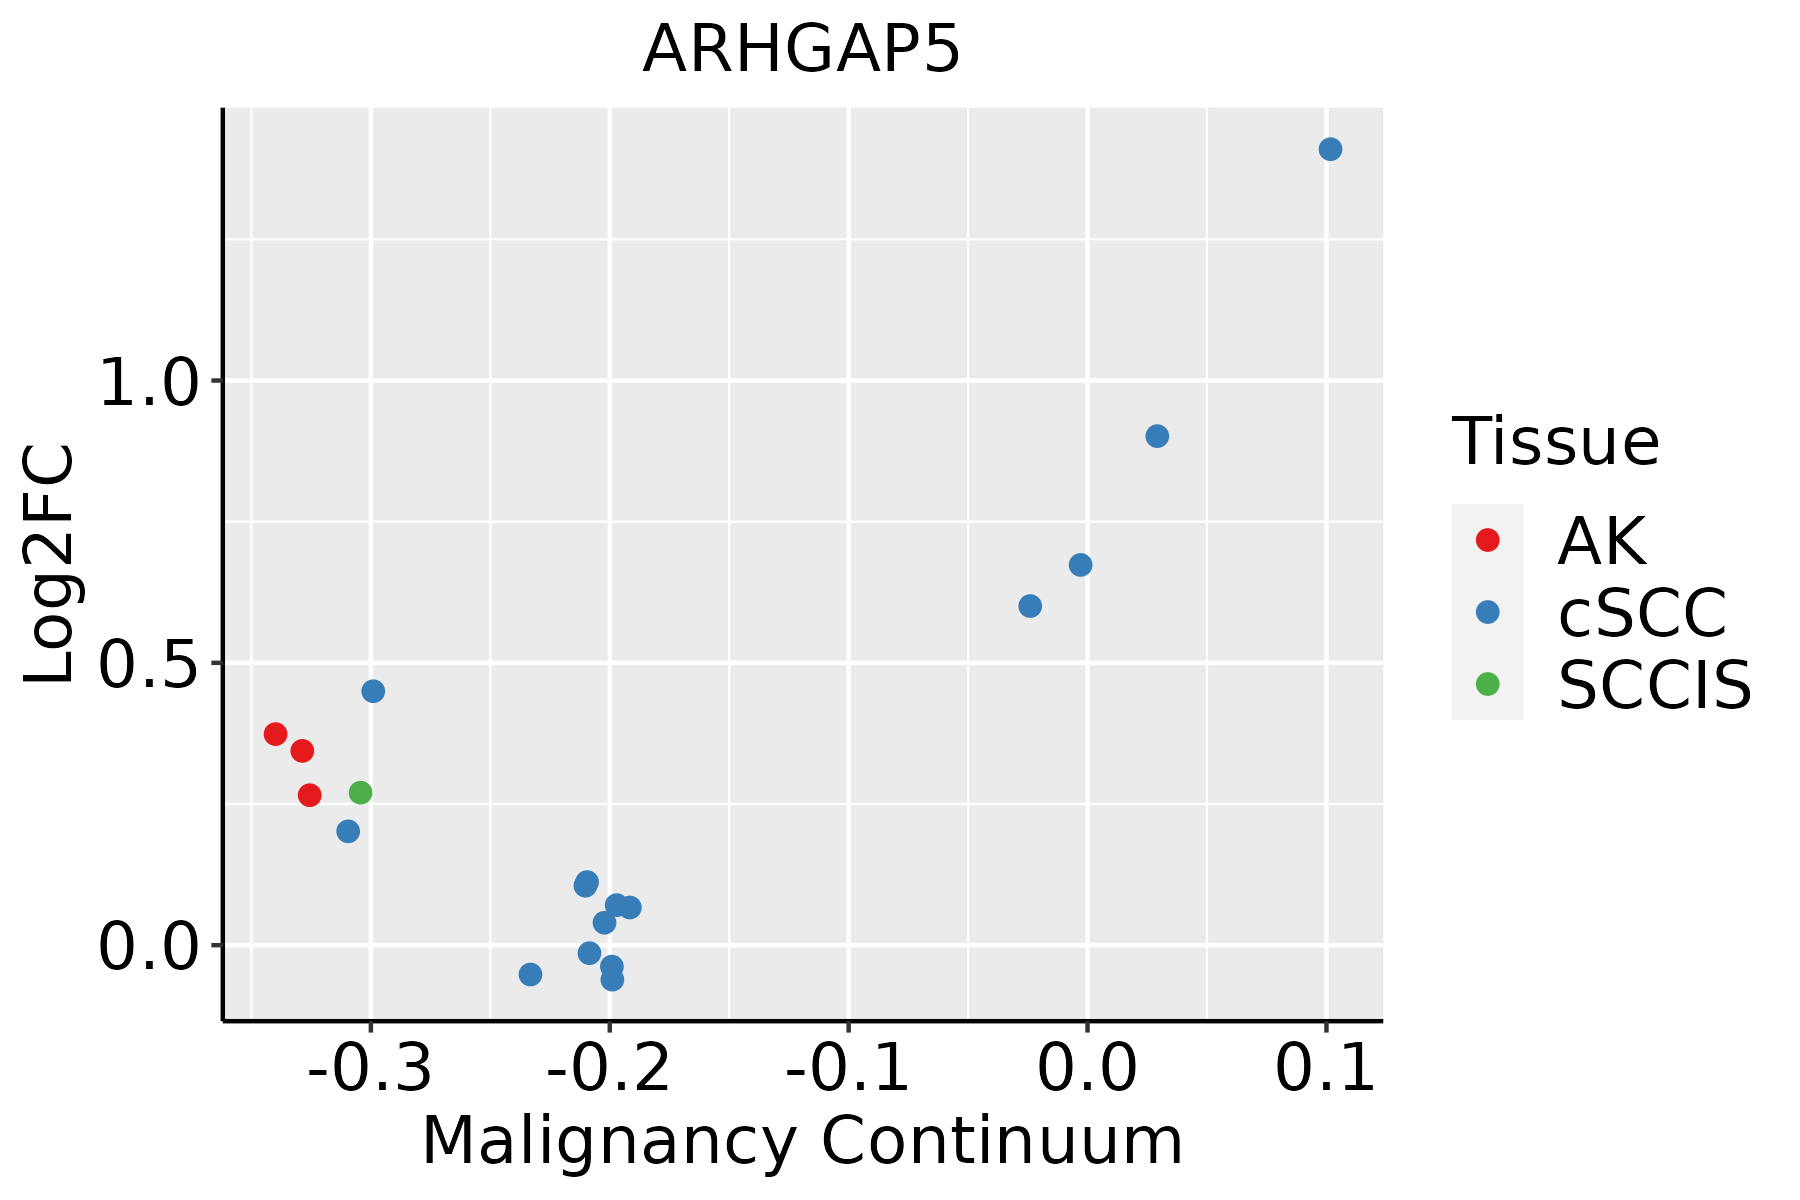 | AK: Actinic keratosis |
| cSCC: Cutaneous squamous cell carcinoma |
| SCCIS:squamous cell carcinoma in situ |
| Thyroid |  | ATC: Anaplastic thyroid cancer |
| HT: Hashimoto's thyroiditis |
| PTC: Papillary thyroid cancer |
| GO ID | Tissue | Disease Stage | Description | Gene Ratio | Bg Ratio | pvalue | p.adjust | Count |
| GO:00510566 | Cervix | CC | regulation of small GTPase mediated signal transduction | 75/2311 | 302/18723 | 1.54e-09 | 1.74e-07 | 75 |
| GO:00072656 | Cervix | CC | Ras protein signal transduction | 79/2311 | 337/18723 | 9.49e-09 | 7.77e-07 | 79 |
| GO:00072666 | Cervix | CC | Rho protein signal transduction | 35/2311 | 137/18723 | 1.77e-05 | 3.33e-04 | 35 |
| GO:004873210 | Cervix | CC | gland development | 84/2311 | 436/18723 | 1.93e-05 | 3.54e-04 | 84 |
| GO:00308797 | Cervix | CC | mammary gland development | 28/2311 | 137/18723 | 4.74e-03 | 2.83e-02 | 28 |
| GO:0048732 | Colorectum | AD | gland development | 149/3918 | 436/18723 | 6.07e-11 | 6.33e-09 | 149 |
| GO:0030879 | Colorectum | AD | mammary gland development | 53/3918 | 137/18723 | 1.46e-06 | 4.58e-05 | 53 |
| GO:0007265 | Colorectum | AD | Ras protein signal transduction | 104/3918 | 337/18723 | 1.01e-05 | 2.35e-04 | 104 |
| GO:0051056 | Colorectum | AD | regulation of small GTPase mediated signal transduction | 94/3918 | 302/18723 | 1.81e-05 | 3.76e-04 | 94 |
| GO:0007266 | Colorectum | AD | Rho protein signal transduction | 42/3918 | 137/18723 | 4.64e-03 | 3.16e-02 | 42 |
| GO:00487321 | Colorectum | SER | gland development | 112/2897 | 436/18723 | 1.75e-08 | 1.28e-06 | 112 |
| GO:00308791 | Colorectum | SER | mammary gland development | 37/2897 | 137/18723 | 3.61e-04 | 5.61e-03 | 37 |
| GO:00487322 | Colorectum | MSS | gland development | 143/3467 | 436/18723 | 3.85e-13 | 8.01e-11 | 143 |
| GO:00308792 | Colorectum | MSS | mammary gland development | 51/3467 | 137/18723 | 1.88e-07 | 8.26e-06 | 51 |
| GO:00072651 | Colorectum | MSS | Ras protein signal transduction | 91/3467 | 337/18723 | 7.20e-05 | 1.21e-03 | 91 |
| GO:00510561 | Colorectum | MSS | regulation of small GTPase mediated signal transduction | 82/3467 | 302/18723 | 1.31e-04 | 1.99e-03 | 82 |
| GO:00510562 | Colorectum | FAP | regulation of small GTPase mediated signal transduction | 78/2622 | 302/18723 | 3.25e-08 | 2.85e-06 | 78 |
| GO:00487324 | Colorectum | FAP | gland development | 103/2622 | 436/18723 | 3.61e-08 | 3.12e-06 | 103 |
| GO:00072652 | Colorectum | FAP | Ras protein signal transduction | 80/2622 | 337/18723 | 9.61e-07 | 4.33e-05 | 80 |
| GO:00072661 | Colorectum | FAP | Rho protein signal transduction | 34/2622 | 137/18723 | 5.11e-04 | 5.82e-03 | 34 |
| Pathway ID | Tissue | Disease Stage | Description | Gene Ratio | Bg Ratio | pvalue | p.adjust | qvalue | Count |
| hsa0451010 | Cervix | CC | Focal adhesion | 59/1267 | 203/8465 | 1.53e-07 | 1.84e-06 | 1.09e-06 | 59 |
| hsa0467020 | Cervix | CC | Leukocyte transendothelial migration | 36/1267 | 114/8465 | 5.22e-06 | 4.83e-05 | 2.86e-05 | 36 |
| hsa0451014 | Cervix | CC | Focal adhesion | 59/1267 | 203/8465 | 1.53e-07 | 1.84e-06 | 1.09e-06 | 59 |
| hsa04670110 | Cervix | CC | Leukocyte transendothelial migration | 36/1267 | 114/8465 | 5.22e-06 | 4.83e-05 | 2.86e-05 | 36 |
| hsa04510 | Colorectum | AD | Focal adhesion | 67/2092 | 203/8465 | 4.40e-03 | 2.17e-02 | 1.38e-02 | 67 |
| hsa04670 | Colorectum | AD | Leukocyte transendothelial migration | 41/2092 | 114/8465 | 4.60e-03 | 2.20e-02 | 1.40e-02 | 41 |
| hsa045101 | Colorectum | AD | Focal adhesion | 67/2092 | 203/8465 | 4.40e-03 | 2.17e-02 | 1.38e-02 | 67 |
| hsa046701 | Colorectum | AD | Leukocyte transendothelial migration | 41/2092 | 114/8465 | 4.60e-03 | 2.20e-02 | 1.40e-02 | 41 |
| hsa046702 | Colorectum | SER | Leukocyte transendothelial migration | 37/1580 | 114/8465 | 2.77e-04 | 2.56e-03 | 1.86e-03 | 37 |
| hsa046703 | Colorectum | SER | Leukocyte transendothelial migration | 37/1580 | 114/8465 | 2.77e-04 | 2.56e-03 | 1.86e-03 | 37 |
| hsa046704 | Colorectum | MSS | Leukocyte transendothelial migration | 36/1875 | 114/8465 | 1.21e-02 | 4.02e-02 | 2.46e-02 | 36 |
| hsa046705 | Colorectum | MSS | Leukocyte transendothelial migration | 36/1875 | 114/8465 | 1.21e-02 | 4.02e-02 | 2.46e-02 | 36 |
| hsa045102 | Colorectum | FAP | Focal adhesion | 61/1404 | 203/8465 | 1.03e-06 | 2.15e-05 | 1.31e-05 | 61 |
| hsa046706 | Colorectum | FAP | Leukocyte transendothelial migration | 37/1404 | 114/8465 | 2.12e-05 | 2.53e-04 | 1.54e-04 | 37 |
| hsa045103 | Colorectum | FAP | Focal adhesion | 61/1404 | 203/8465 | 1.03e-06 | 2.15e-05 | 1.31e-05 | 61 |
| hsa046707 | Colorectum | FAP | Leukocyte transendothelial migration | 37/1404 | 114/8465 | 2.12e-05 | 2.53e-04 | 1.54e-04 | 37 |
| hsa045104 | Colorectum | CRC | Focal adhesion | 51/1091 | 203/8465 | 1.29e-06 | 5.41e-05 | 3.66e-05 | 51 |
| hsa046708 | Colorectum | CRC | Leukocyte transendothelial migration | 25/1091 | 114/8465 | 4.82e-03 | 2.66e-02 | 1.80e-02 | 25 |
| hsa045105 | Colorectum | CRC | Focal adhesion | 51/1091 | 203/8465 | 1.29e-06 | 5.41e-05 | 3.66e-05 | 51 |
| hsa046709 | Colorectum | CRC | Leukocyte transendothelial migration | 25/1091 | 114/8465 | 4.82e-03 | 2.66e-02 | 1.80e-02 | 25 |
| Hugo Symbol | Variant Class | Variant Classification | dbSNP RS | HGVSc | HGVSp | HGVSp Short | SWISSPROT | BIOTYPE | SIFT | PolyPhen | Tumor Sample Barcode | Tissue | Histology | Sex | Age | Stage | Therapy Types | Drugs | Outcome |
| ARHGAP5 | SNV | Missense_Mutation | | c.1547G>A | p.Ser516Asn | p.S516N | Q13017 | protein_coding | deleterious(0.01) | possibly_damaging(0.9) | TCGA-A1-A0SF-01 | Breast | breast invasive carcinoma | Female | <65 | I/II | Chemotherapy | tc | SD |
| ARHGAP5 | SNV | Missense_Mutation | | c.1652A>G | p.His551Arg | p.H551R | Q13017 | protein_coding | deleterious(0.01) | probably_damaging(0.987) | TCGA-A2-A0D2-01 | Breast | breast invasive carcinoma | Female | <65 | I/II | Chemotherapy | adriamycin | SD |
| ARHGAP5 | SNV | Missense_Mutation | novel | c.2290N>C | p.Val764Leu | p.V764L | Q13017 | protein_coding | tolerated(0.91) | benign(0.001) | TCGA-A7-A4SE-01 | Breast | breast invasive carcinoma | Female | <65 | I/II | Chemotherapy | adriamycin | CR |
| ARHGAP5 | SNV | Missense_Mutation | | c.272A>T | p.His91Leu | p.H91L | Q13017 | protein_coding | deleterious(0.01) | possibly_damaging(0.669) | TCGA-A8-A09Z-01 | Breast | breast invasive carcinoma | Female | >=65 | I/II | Unknown | Unknown | SD |
| ARHGAP5 | SNV | Missense_Mutation | rs78337553 | c.1465G>A | p.Glu489Lys | p.E489K | Q13017 | protein_coding | deleterious(0.01) | possibly_damaging(0.689) | TCGA-AC-A23G-01 | Breast | breast invasive carcinoma | Female | >=65 | I/II | Chemotherapy | cytoxan | CR |
| ARHGAP5 | SNV | Missense_Mutation | rs747803256 | c.2545N>A | p.His849Asn | p.H849N | Q13017 | protein_coding | deleterious(0) | probably_damaging(0.999) | TCGA-AN-A046-01 | Breast | breast invasive carcinoma | Female | >=65 | I/II | Unknown | Unknown | SD |
| ARHGAP5 | SNV | Missense_Mutation | novel | c.4046N>A | p.Ser1349Tyr | p.S1349Y | Q13017 | protein_coding | deleterious(0.02) | possibly_damaging(0.905) | TCGA-AN-A046-01 | Breast | breast invasive carcinoma | Female | >=65 | I/II | Unknown | Unknown | SD |
| ARHGAP5 | SNV | Missense_Mutation | rs759492227 | c.3787N>T | p.Pro1263Ser | p.P1263S | Q13017 | protein_coding | deleterious(0.01) | possibly_damaging(0.718) | TCGA-AO-A128-01 | Breast | breast invasive carcinoma | Female | <65 | I/II | Chemotherapy | doxorubicin | SD |
| ARHGAP5 | SNV | Missense_Mutation | | c.882T>A | p.Ser294Arg | p.S294R | Q13017 | protein_coding | tolerated(0.14) | possibly_damaging(0.709) | TCGA-B6-A0RU-01 | Breast | breast invasive carcinoma | Female | <65 | I/II | Unknown | Unknown | PD |
| ARHGAP5 | SNV | Missense_Mutation | rs78337553 | c.1465G>A | p.Glu489Lys | p.E489K | Q13017 | protein_coding | deleterious(0.01) | possibly_damaging(0.689) | TCGA-BH-A0W7-01 | Breast | breast invasive carcinoma | Female | <65 | I/II | Chemotherapy | taxotere | CR |


