
|
|||||
|
 | |
| |
| |
| |
| |
| |
|
Gene: ARHGAP44 |
Gene summary for ARHGAP44 |
| Gene information | Species | Human | Gene symbol | ARHGAP44 | Gene ID | 9912 |
| Gene name | Rho GTPase activating protein 44 | |
| Gene Alias | NPC-A-10 | |
| Cytomap | 17p12 | |
| Gene Type | protein-coding | GO ID | GO:0000902 | UniProtAcc | Q69Z00 |
Top |
Malignant transformation analysis |
| Identification of the aberrant gene expression in precancerous and cancerous lesions by comparing the gene expression of stem-like cells in diseased tissues with normal stem cells |
| Entrez ID | Symbol | Replicates | Species | Organ | Tissue | Adj P-value | Log2FC | Malignancy |
| 9912 | ARHGAP44 | HTA11_3410_2000001011 | Human | Colorectum | AD | 4.38e-06 | -3.83e-01 | 0.0155 |
| 9912 | ARHGAP44 | HTA11_347_2000001011 | Human | Colorectum | AD | 3.54e-26 | 1.01e+00 | -0.1954 |
| 9912 | ARHGAP44 | HTA11_411_2000001011 | Human | Colorectum | SER | 6.66e-03 | 3.99e-01 | -0.2602 |
| 9912 | ARHGAP44 | HTA11_7862_2000001011 | Human | Colorectum | AD | 2.37e-04 | 5.44e-01 | -0.0179 |
| 9912 | ARHGAP44 | HTA11_10623_2000001011 | Human | Colorectum | AD | 3.77e-07 | 7.01e-01 | -0.0177 |
| 9912 | ARHGAP44 | HTA11_6818_2000001021 | Human | Colorectum | AD | 3.43e-11 | -7.62e-01 | 0.0588 |
| 9912 | ARHGAP44 | HTA11_99999970781_79442 | Human | Colorectum | MSS | 8.16e-07 | -4.35e-01 | 0.294 |
| 9912 | ARHGAP44 | HTA11_99999965104_69814 | Human | Colorectum | MSS | 8.34e-21 | -1.06e+00 | 0.281 |
| 9912 | ARHGAP44 | HTA11_99999971662_82457 | Human | Colorectum | MSS | 1.19e-05 | -4.99e-01 | 0.3859 |
| 9912 | ARHGAP44 | HTA11_99999973899_84307 | Human | Colorectum | MSS | 1.98e-09 | -8.54e-01 | 0.2585 |
| 9912 | ARHGAP44 | HTA11_99999974143_84620 | Human | Colorectum | MSS | 5.19e-50 | -1.04e+00 | 0.3005 |
| 9912 | ARHGAP44 | F007 | Human | Colorectum | FAP | 4.31e-03 | -2.32e-01 | 0.1176 |
| 9912 | ARHGAP44 | A001-C-207 | Human | Colorectum | FAP | 4.25e-06 | -4.36e-01 | 0.1278 |
| 9912 | ARHGAP44 | A015-C-203 | Human | Colorectum | FAP | 4.83e-26 | -4.28e-01 | -0.1294 |
| 9912 | ARHGAP44 | A015-C-204 | Human | Colorectum | FAP | 5.89e-10 | -4.93e-01 | -0.0228 |
| 9912 | ARHGAP44 | A014-C-040 | Human | Colorectum | FAP | 2.73e-07 | -5.73e-01 | -0.1184 |
| 9912 | ARHGAP44 | A002-C-201 | Human | Colorectum | FAP | 2.64e-20 | -5.40e-01 | 0.0324 |
| 9912 | ARHGAP44 | A002-C-203 | Human | Colorectum | FAP | 1.83e-03 | -4.06e-01 | 0.2786 |
| 9912 | ARHGAP44 | A001-C-119 | Human | Colorectum | FAP | 1.17e-24 | -8.75e-01 | -0.1557 |
| 9912 | ARHGAP44 | A001-C-108 | Human | Colorectum | FAP | 1.93e-17 | -5.75e-01 | -0.0272 |
| Page: 1 2 3 |
| Tissue | Expression Dynamics | Abbreviation |
| Colorectum (GSE201348) |  | FAP: Familial adenomatous polyposis |
| CRC: Colorectal cancer | ||
| Colorectum (HTA11) |  | AD: Adenomas |
| SER: Sessile serrated lesions | ||
| MSI-H: Microsatellite-high colorectal cancer | ||
| MSS: Microsatellite stable colorectal cancer | ||
| Lung | 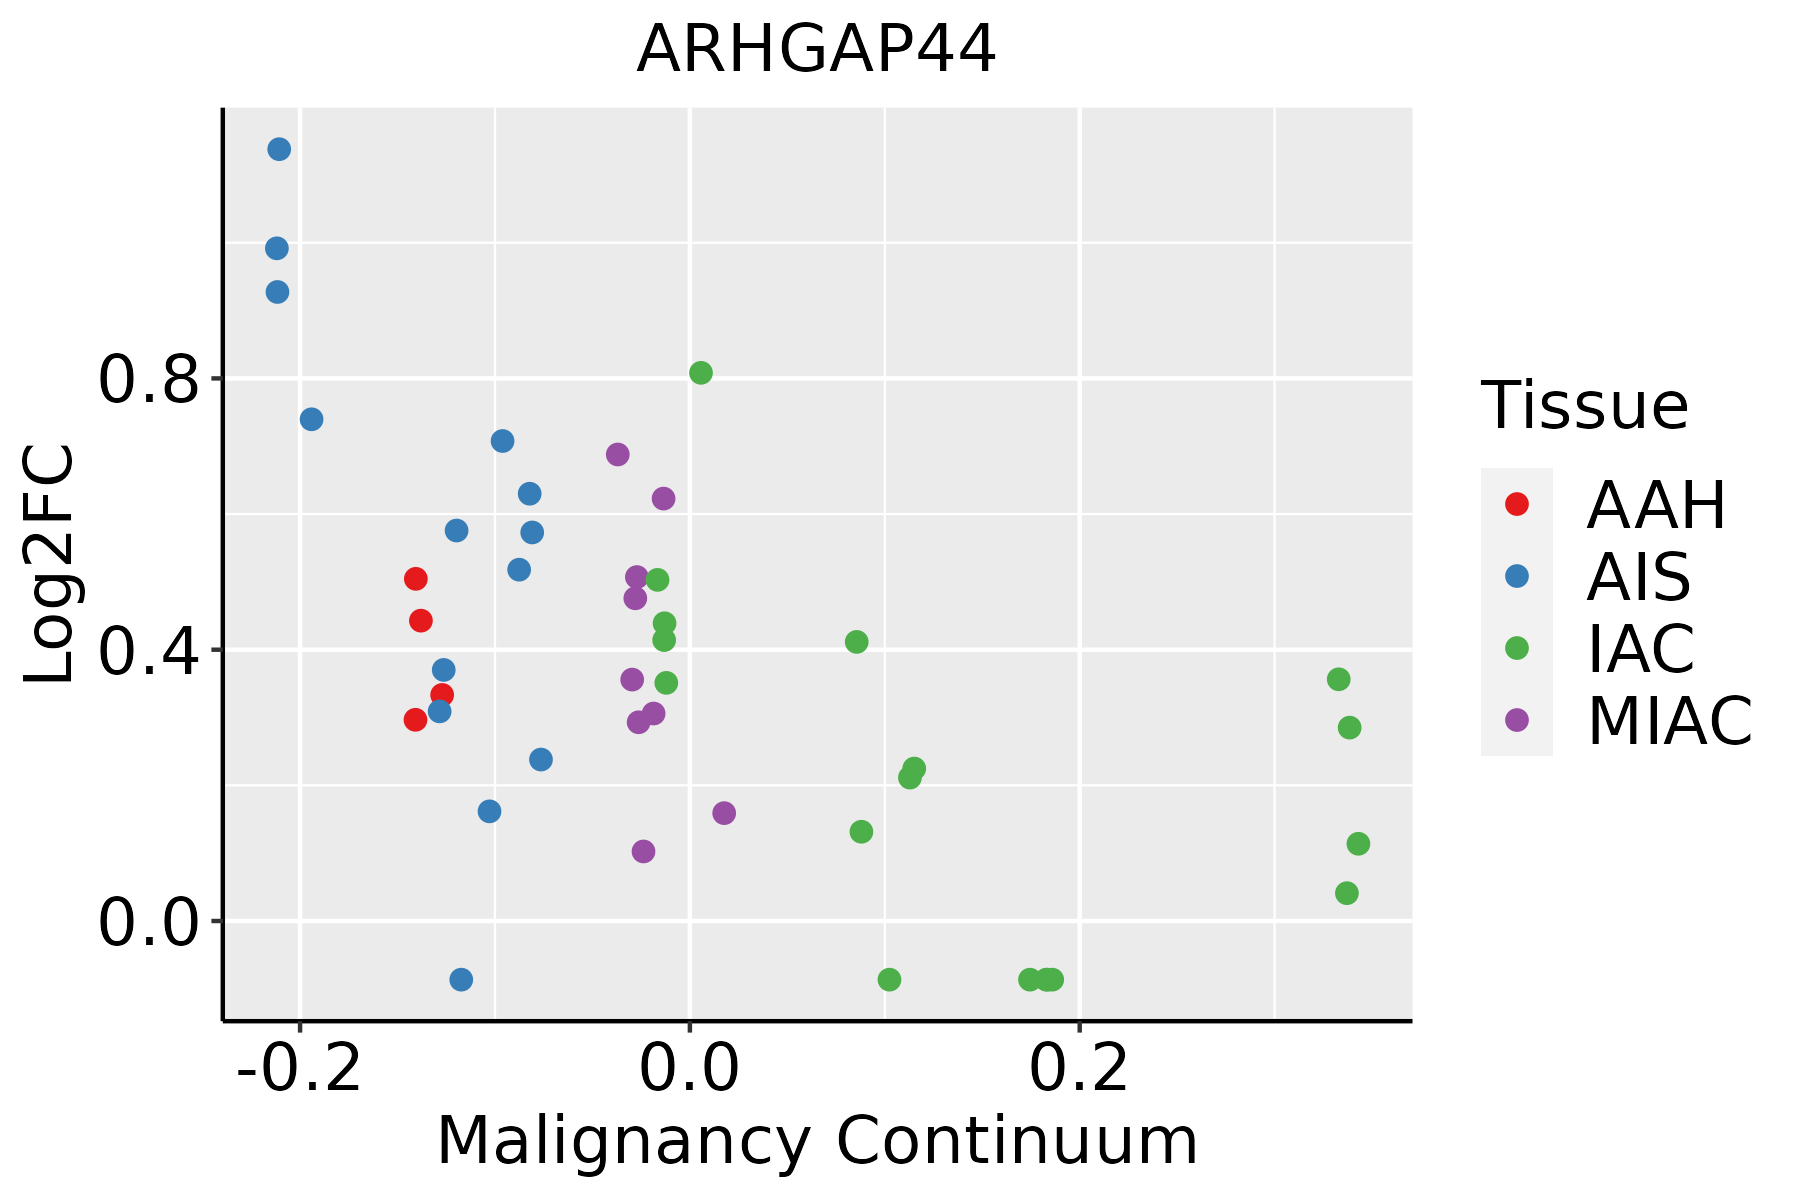 | AAH: Atypical adenomatous hyperplasia |
| AIS: Adenocarcinoma in situ | ||
| IAC: Invasive lung adenocarcinoma | ||
| MIA: Minimally invasive adenocarcinoma |
| ∗log2FC in expression of this searched gene in stem-like cells from each diseased tissue sample relative to stem-like cells in normal samples in each tissue plotted against the malignancy continuum. Samples are colored based on if they are from different disease stage. |
Top |
Malignant transformation related pathway analysis |
| Find out the enriched GO biological processes and KEGG pathways involved in transition from healthy to precancer to cancer |
| Tissue | Disease Stage | Enriched GO biological Processes |
| Colorectum | AD |  |
| Colorectum | SER |  |
| Colorectum | MSS |  |
| Colorectum | MSI-H |  |
| Colorectum | FAP |  |
| ∗Top 15 enriched GO BP terms are showed in the bar plot of each disease state in each tissue. Each row represents a significant GO biological process which is colored according to the -log10(p.adjust). |
| Page: 1 2 3 4 5 6 7 8 9 |
| GO ID | Tissue | Disease Stage | Description | Gene Ratio | Bg Ratio | pvalue | p.adjust | Count |
| GO:0072659 | Colorectum | AD | protein localization to plasma membrane | 122/3918 | 284/18723 | 2.86e-17 | 1.49e-14 | 122 |
| GO:1990778 | Colorectum | AD | protein localization to cell periphery | 129/3918 | 333/18723 | 5.51e-14 | 1.15e-11 | 129 |
| GO:0032970 | Colorectum | AD | regulation of actin filament-based process | 142/3918 | 397/18723 | 4.05e-12 | 5.90e-10 | 142 |
| GO:0090150 | Colorectum | AD | establishment of protein localization to membrane | 100/3918 | 260/18723 | 6.01e-11 | 6.33e-09 | 100 |
| GO:0032956 | Colorectum | AD | regulation of actin cytoskeleton organization | 127/3918 | 358/18723 | 1.03e-10 | 1.04e-08 | 127 |
| GO:0016197 | Colorectum | AD | endosomal transport | 90/3918 | 230/18723 | 1.88e-10 | 1.73e-08 | 90 |
| GO:1905475 | Colorectum | AD | regulation of protein localization to membrane | 73/3918 | 175/18723 | 3.37e-10 | 2.93e-08 | 73 |
| GO:1903076 | Colorectum | AD | regulation of protein localization to plasma membrane | 48/3918 | 104/18723 | 7.17e-09 | 4.36e-07 | 48 |
| GO:1904375 | Colorectum | AD | regulation of protein localization to cell periphery | 54/3918 | 125/18723 | 1.52e-08 | 9.00e-07 | 54 |
| GO:0098876 | Colorectum | AD | vesicle-mediated transport to the plasma membrane | 57/3918 | 136/18723 | 2.30e-08 | 1.27e-06 | 57 |
| GO:0061951 | Colorectum | AD | establishment of protein localization to plasma membrane | 31/3918 | 60/18723 | 1.37e-07 | 6.42e-06 | 31 |
| GO:0032386 | Colorectum | AD | regulation of intracellular transport | 109/3918 | 337/18723 | 5.33e-07 | 1.95e-05 | 109 |
| GO:0033157 | Colorectum | AD | regulation of intracellular protein transport | 80/3918 | 229/18723 | 5.81e-07 | 2.09e-05 | 80 |
| GO:0043087 | Colorectum | AD | regulation of GTPase activity | 110/3918 | 348/18723 | 1.64e-06 | 5.03e-05 | 110 |
| GO:0007265 | Colorectum | AD | Ras protein signal transduction | 104/3918 | 337/18723 | 1.01e-05 | 2.35e-04 | 104 |
| GO:0051056 | Colorectum | AD | regulation of small GTPase mediated signal transduction | 94/3918 | 302/18723 | 1.81e-05 | 3.76e-04 | 94 |
| GO:0010975 | Colorectum | AD | regulation of neuron projection development | 129/3918 | 445/18723 | 2.88e-05 | 5.37e-04 | 129 |
| GO:0106027 | Colorectum | AD | neuron projection organization | 36/3918 | 93/18723 | 6.58e-05 | 1.07e-03 | 36 |
| GO:0016601 | Colorectum | AD | Rac protein signal transduction | 20/3918 | 42/18723 | 1.02e-04 | 1.53e-03 | 20 |
| GO:0032456 | Colorectum | AD | endocytic recycling | 28/3918 | 73/18723 | 4.87e-04 | 5.30e-03 | 28 |
| Page: 1 2 3 4 5 6 7 8 9 10 11 12 |
| Pathway ID | Tissue | Disease Stage | Description | Gene Ratio | Bg Ratio | pvalue | p.adjust | qvalue | Count |
| Page: 1 |
Top |
Cell-cell communication analysis |
| Identification of potential cell-cell interactions between two cell types and their ligand-receptor pairs for different disease states |
| Ligand | Receptor | LRpair | Pathway | Tissue | Disease Stage |
| Page: 1 |
Top |
Single-cell gene regulatory network inference analysis |
| Find out the significant the regulons (TFs) and the target genes of each regulon across cell types for different disease states |
| TF | Cell Type | Tissue | Disease Stage | Target Gene | RSS | Regulon Activity |
| ∗The dot plots of a searched regulon are shown for all cell subpopulations in each disease state of each tissue based on the regulon specific score inferred using pySCENIC and by calculating the average expression. |
| Page: 1 |
Top |
Somatic mutation of malignant transformation related genes |
| Annotation of somatic variants for genes involved in malignant transformation |
| Hugo Symbol | Variant Class | Variant Classification | dbSNP RS | HGVSc | HGVSp | HGVSp Short | SWISSPROT | BIOTYPE | SIFT | PolyPhen | Tumor Sample Barcode | Tissue | Histology | Sex | Age | Stage | Therapy Types | Drugs | Outcome |
| ARHGAP44 | SNV | Missense_Mutation | novel | c.569N>G | p.Val190Gly | p.V190G | Q17R89 | protein_coding | deleterious(0) | probably_damaging(0.93) | TCGA-A2-A4RW-01 | Breast | breast invasive carcinoma | Female | <65 | III/IV | Unknown | Unknown | SD |
| ARHGAP44 | SNV | Missense_Mutation | novel | c.1462G>C | p.Ala488Pro | p.A488P | Q17R89 | protein_coding | deleterious(0.01) | benign(0.303) | TCGA-E2-A15M-01 | Breast | breast invasive carcinoma | Female | >=65 | I/II | Hormone Therapy | arimidex | SD |
| ARHGAP44 | insertion | Nonsense_Mutation | novel | c.2407_2408insACTCAGAGACGTCCAGACACTGAGCTGT | p.Val803AspfsTer8 | p.V803Dfs*8 | Q17R89 | protein_coding | TCGA-AN-A046-01 | Breast | breast invasive carcinoma | Female | >=65 | I/II | Unknown | Unknown | SD | ||
| ARHGAP44 | insertion | In_Frame_Ins | novel | c.197_198insTCTCACTCATAGGTGGGAATTGAACAATGAGAA | p.Ser66_Lys67insLeuThrHisArgTrpGluLeuAsnAsnGluAsn | p.S66_K67insLTHRWELNNEN | Q17R89 | protein_coding | TCGA-E9-A1NI-01 | Breast | breast invasive carcinoma | Female | <65 | I/II | Chemotherapy | doxorubicin | CR | ||
| ARHGAP44 | deletion | Frame_Shift_Del | novel | c.234delG | p.Met79TrpfsTer17 | p.M79Wfs*17 | Q17R89 | protein_coding | TCGA-EW-A2FV-01 | Breast | breast invasive carcinoma | Female | <65 | III/IV | Chemotherapy | docetaxel | SD | ||
| ARHGAP44 | SNV | Missense_Mutation | rs768572384 | c.2105N>T | p.Ser702Leu | p.S702L | Q17R89 | protein_coding | deleterious_low_confidence(0.01) | benign(0.079) | TCGA-C5-A2LV-01 | Cervix | cervical & endocervical cancer | Female | <65 | I/II | Unknown | Unknown | SD |
| ARHGAP44 | SNV | Missense_Mutation | novel | c.155N>T | p.Ala52Val | p.A52V | Q17R89 | protein_coding | deleterious(0.01) | possibly_damaging(0.475) | TCGA-C5-A8XH-01 | Cervix | cervical & endocervical cancer | Female | <65 | I/II | Unknown | Unknown | SD |
| ARHGAP44 | SNV | Missense_Mutation | c.2332N>C | p.Asp778His | p.D778H | Q17R89 | protein_coding | deleterious_low_confidence(0) | benign(0.401) | TCGA-DR-A0ZM-01 | Cervix | cervical & endocervical cancer | Female | <65 | III/IV | Unspecific | Cisplatin | SD | |
| ARHGAP44 | SNV | Missense_Mutation | c.598G>A | p.Asp200Asn | p.D200N | Q17R89 | protein_coding | deleterious(0) | probably_damaging(0.992) | TCGA-MU-A51Y-01 | Cervix | cervical & endocervical cancer | Female | <65 | I/II | Unknown | Unknown | SD | |
| ARHGAP44 | SNV | Missense_Mutation | novel | c.1205N>C | p.Met402Thr | p.M402T | Q17R89 | protein_coding | deleterious(0) | benign(0.207) | TCGA-VS-A9UB-01 | Cervix | cervical & endocervical cancer | Female | <65 | I/II | Chemotherapy | cisplatin | CR |
| Page: 1 2 3 4 5 6 7 8 9 |
Top |
Related drugs of malignant transformation related genes |
| Identification of chemicals and drugs interact with genes involved in malignant transfromation |
| (DGIdb 4.0) |
| Entrez ID | Symbol | Category | Interaction Types | Drug Claim Name | Drug Name | PMIDs |
| Page: 1 |

Copyright 2023-Present -The University of Texas Health Science Center at Houston |