Schematic overview of the cellular and molecular mechanisms involved in the cancer progression, including the proposed cellular and molecular mechanisms in cancer cells trajectory. AT1: alveolar type 1 cells; AT2: alveolar type 2 cells; AAH: atypical adenomatous hyperplasia; AIS: adenocarcinoma in situ; MIA: minimally invasive adenocarcinoma; IA: invasive adenocarcinoma; EMT: epithelial-mesenchymal transition

Home

Download

Statistics

Help

Contact

Center for Computational Systems Medicine
leaf

Gene summary

leaf

Malignant transformation analysis

leaf

Malignant transformation related pathway analysis

leaf

Cell-cell communication analysis

leaf

Single-cell gene regulatory network inference analysis

leaf

Somatic mutation of malignant transformation related genes

leaf

Related drugs of malignant transformation related genes

Gene: ARHGAP42

Gene summary for ARHGAP42

check button Gene summary.

Gene informationSpeciesHuman
Gene symbol

ARHGAP42

Gene ID

143872

Gene nameRho GTPase activating protein 42
Gene AliasAD031
Cytomap11q22.1
Gene Typeprotein-coding
GO ID

GO:0003008

UniProtAcc

A6NI28


Top

Malignant transformation analysis

check button Identification of the aberrant gene expression in precancerous and cancerous lesions by comparing the gene expression of stem-like cells in diseased tissues with normal stem cells
check button Malignant transformation involving gene list.
Entrez IDSymbolReplicatesSpeciesOrganTissueAdj P-valueLog2FCMalignancy
143872ARHGAP42AEH-subject1HumanEndometriumAEH8.23e-113.65e-01-0.3059
143872ARHGAP42AEH-subject2HumanEndometriumAEH2.15e-124.13e-01-0.2525
143872ARHGAP42AEH-subject4HumanEndometriumAEH9.81e-144.62e-01-0.2657
143872ARHGAP42AEH-subject5HumanEndometriumAEH5.58e-093.54e-01-0.2953
143872ARHGAP42EEC-subject1HumanEndometriumEEC8.51e-032.13e-01-0.2682
143872ARHGAP42EEC-subject2HumanEndometriumEEC1.75e-104.37e-01-0.2607
143872ARHGAP42NAFLD1HumanLiverNAFLD6.97e-077.39e-01-0.04
143872ARHGAP42S41HumanLiverCirrhotic9.20e-036.04e-01-0.0343
143872ARHGAP42HCC1_MengHumanLiverHCC3.58e-14-1.54e-010.0246
143872ARHGAP42HCC2_MengHumanLiverHCC7.54e-03-1.27e-010.0107
143872ARHGAP42HCC5HumanLiverHCC3.21e-353.91e-010.4932
143872ARHGAP42TD9HumanLungIAC9.99e-057.54e-010.088
143872ARHGAP42RNA-P17T-P17T-4HumanLungIAC3.73e-024.86e-010.343
143872ARHGAP42RNA-P25T1-P25T1-1HumanLungAIS1.51e-044.17e-01-0.2116
143872ARHGAP42RNA-P25T1-P25T1-2HumanLungAIS4.60e-035.39e-01-0.1941
143872ARHGAP42RNA-P25T1-P25T1-3HumanLungAIS4.31e-024.00e-01-0.2107
143872ARHGAP42RNA-P25T1-P25T1-4HumanLungAIS2.62e-043.99e-01-0.2119
143872ARHGAP42RNA-P3T-P3T-2HumanLungIAC1.69e-024.51e-010.1835
143872ARHGAP42RNA-P3T-P3T-4HumanLungIAC3.28e-034.71e-010.1859
143872ARHGAP42RNA-P6T1-P6T1-1HumanLungMIAC1.89e-101.49e+00-0.0238
Page: 1 2 3 4 

check button Transcriptomic changes along malignancy continuum.
TissueExpression DynamicsAbbreviation
EndometriumThe image shows the transcriptomic changes along malignancy continuum.log2FC in expression of this searched gene in stem-like cells from each diseased tissue sample relative to stem-like cells in normal samples in each tissue plotted against the malignancy continuum. Samples are colored based on if they are from different disease stage.AEH: Atypical endometrial hyperplasia
EEC: Endometrioid Cancer
GCThe image shows the transcriptomic changes along malignancy continuum.log2FC in expression of this searched gene in stem-like cells from each diseased tissue sample relative to stem-like cells in normal samples in each tissue plotted against the malignancy continuum. Samples are colored based on if they are from different disease stage.
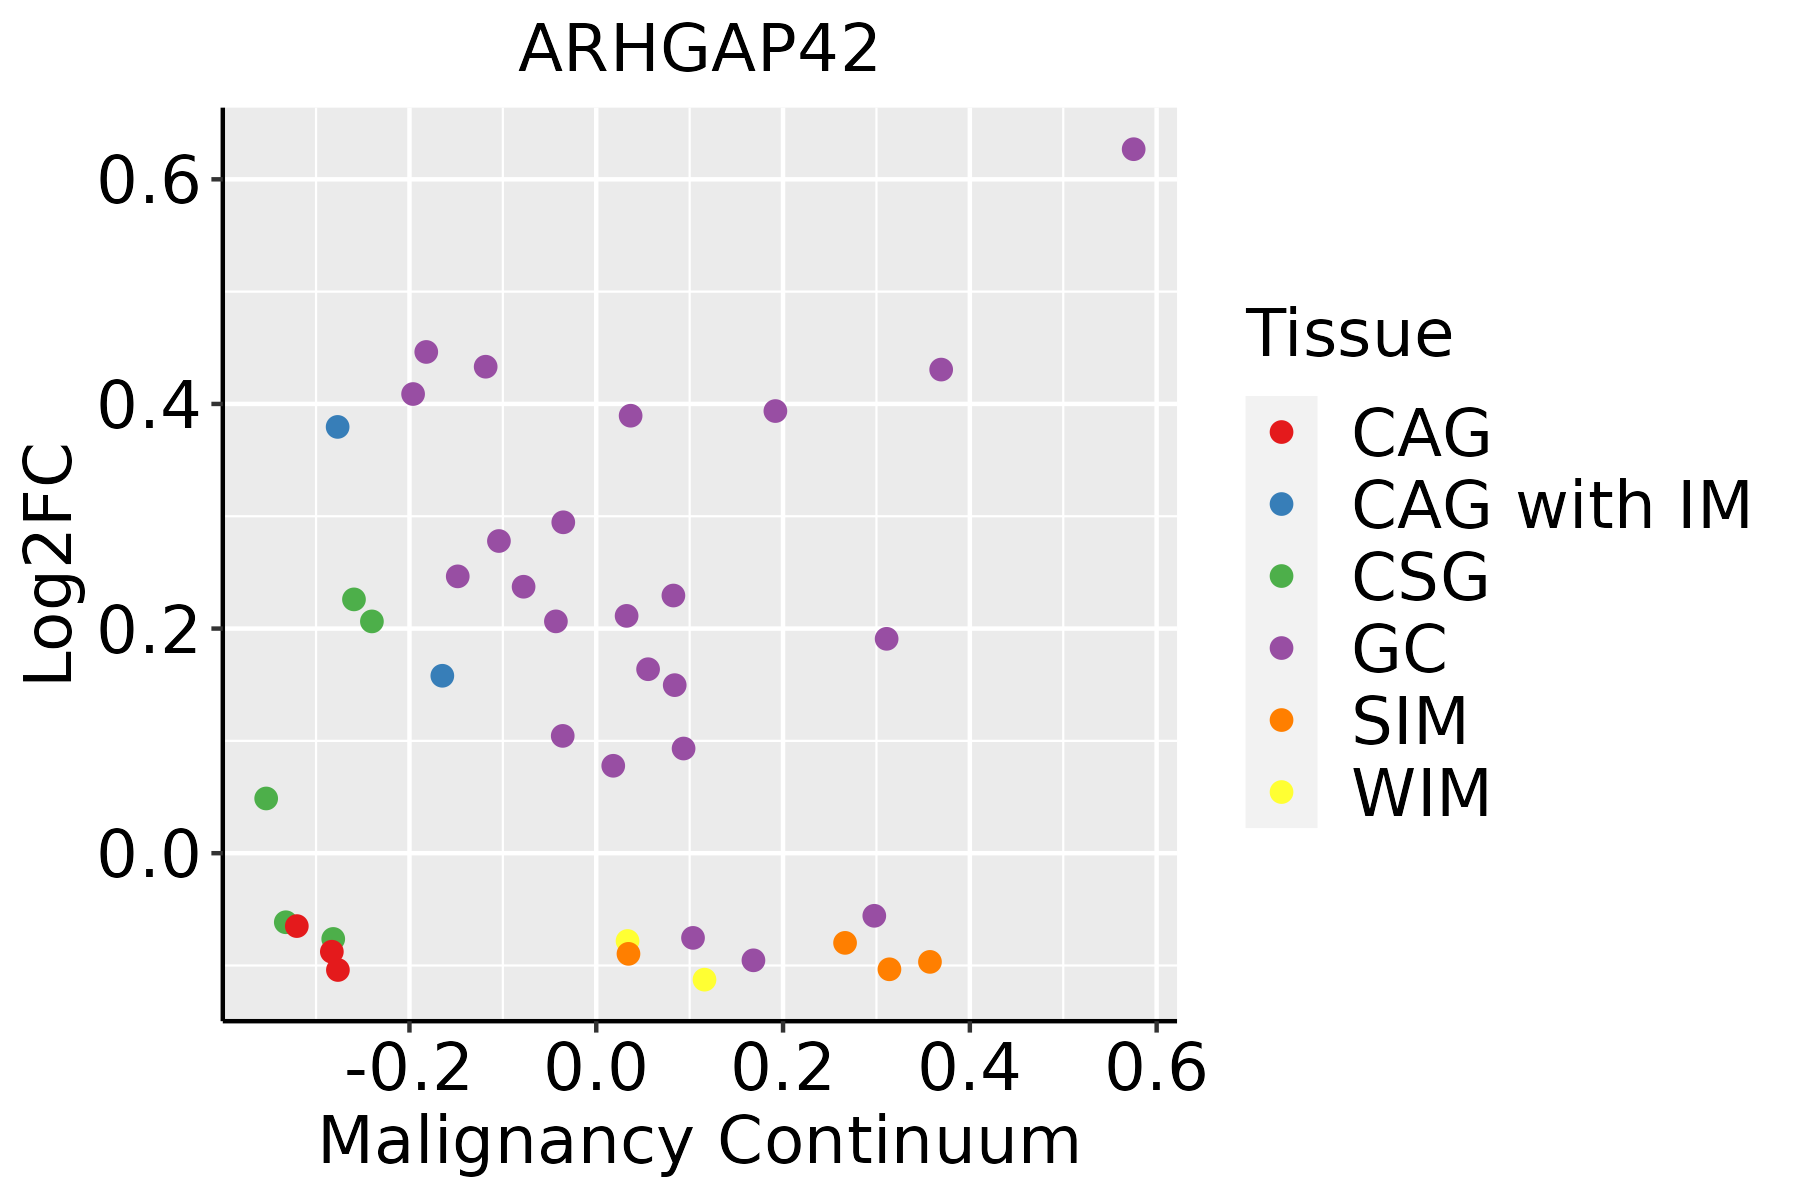
CAG: Chronic atrophic gastritis
CAG with IM: Chronic atrophic gastritis with intestinal metaplasia
CSG: Chronic superficial gastritis
GC: Gastric cancer
SIM: Severe intestinal metaplasia
WIM: Wild intestinal metaplasia
LiverThe image shows the transcriptomic changes along malignancy continuum.log2FC in expression of this searched gene in stem-like cells from each diseased tissue sample relative to stem-like cells in normal samples in each tissue plotted against the malignancy continuum. Samples are colored based on if they are from different disease stage.
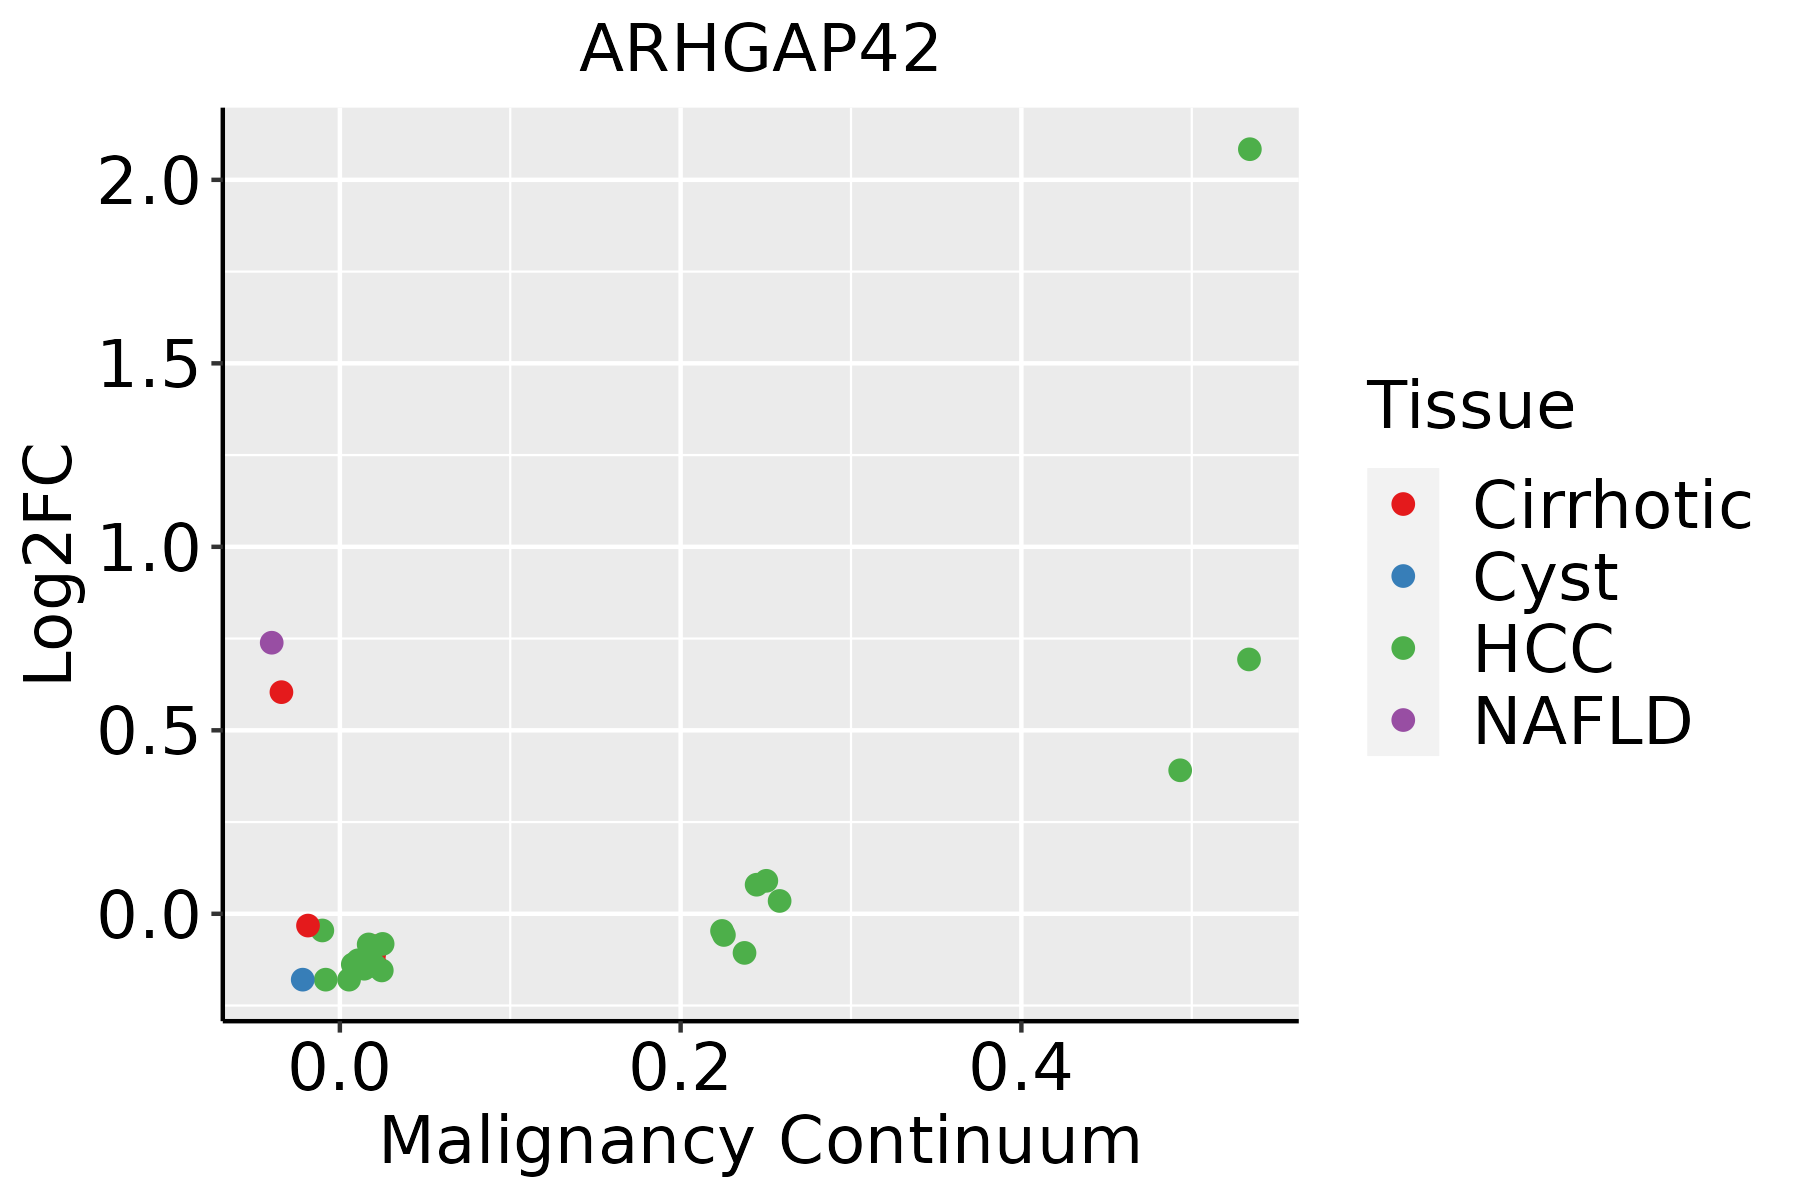
HCC: Hepatocellular carcinoma
NAFLD: Non-alcoholic fatty liver disease
LungThe image shows the transcriptomic changes along malignancy continuum.log2FC in expression of this searched gene in stem-like cells from each diseased tissue sample relative to stem-like cells in normal samples in each tissue plotted against the malignancy continuum. Samples are colored based on if they are from different disease stage.AAH: Atypical adenomatous hyperplasia
AIS: Adenocarcinoma in situ
IAC: Invasive lung adenocarcinoma
MIA: Minimally invasive adenocarcinoma
Oral CavityThe image shows the transcriptomic changes along malignancy continuum.log2FC in expression of this searched gene in stem-like cells from each diseased tissue sample relative to stem-like cells in normal samples in each tissue plotted against the malignancy continuum. Samples are colored based on if they are from different disease stage.
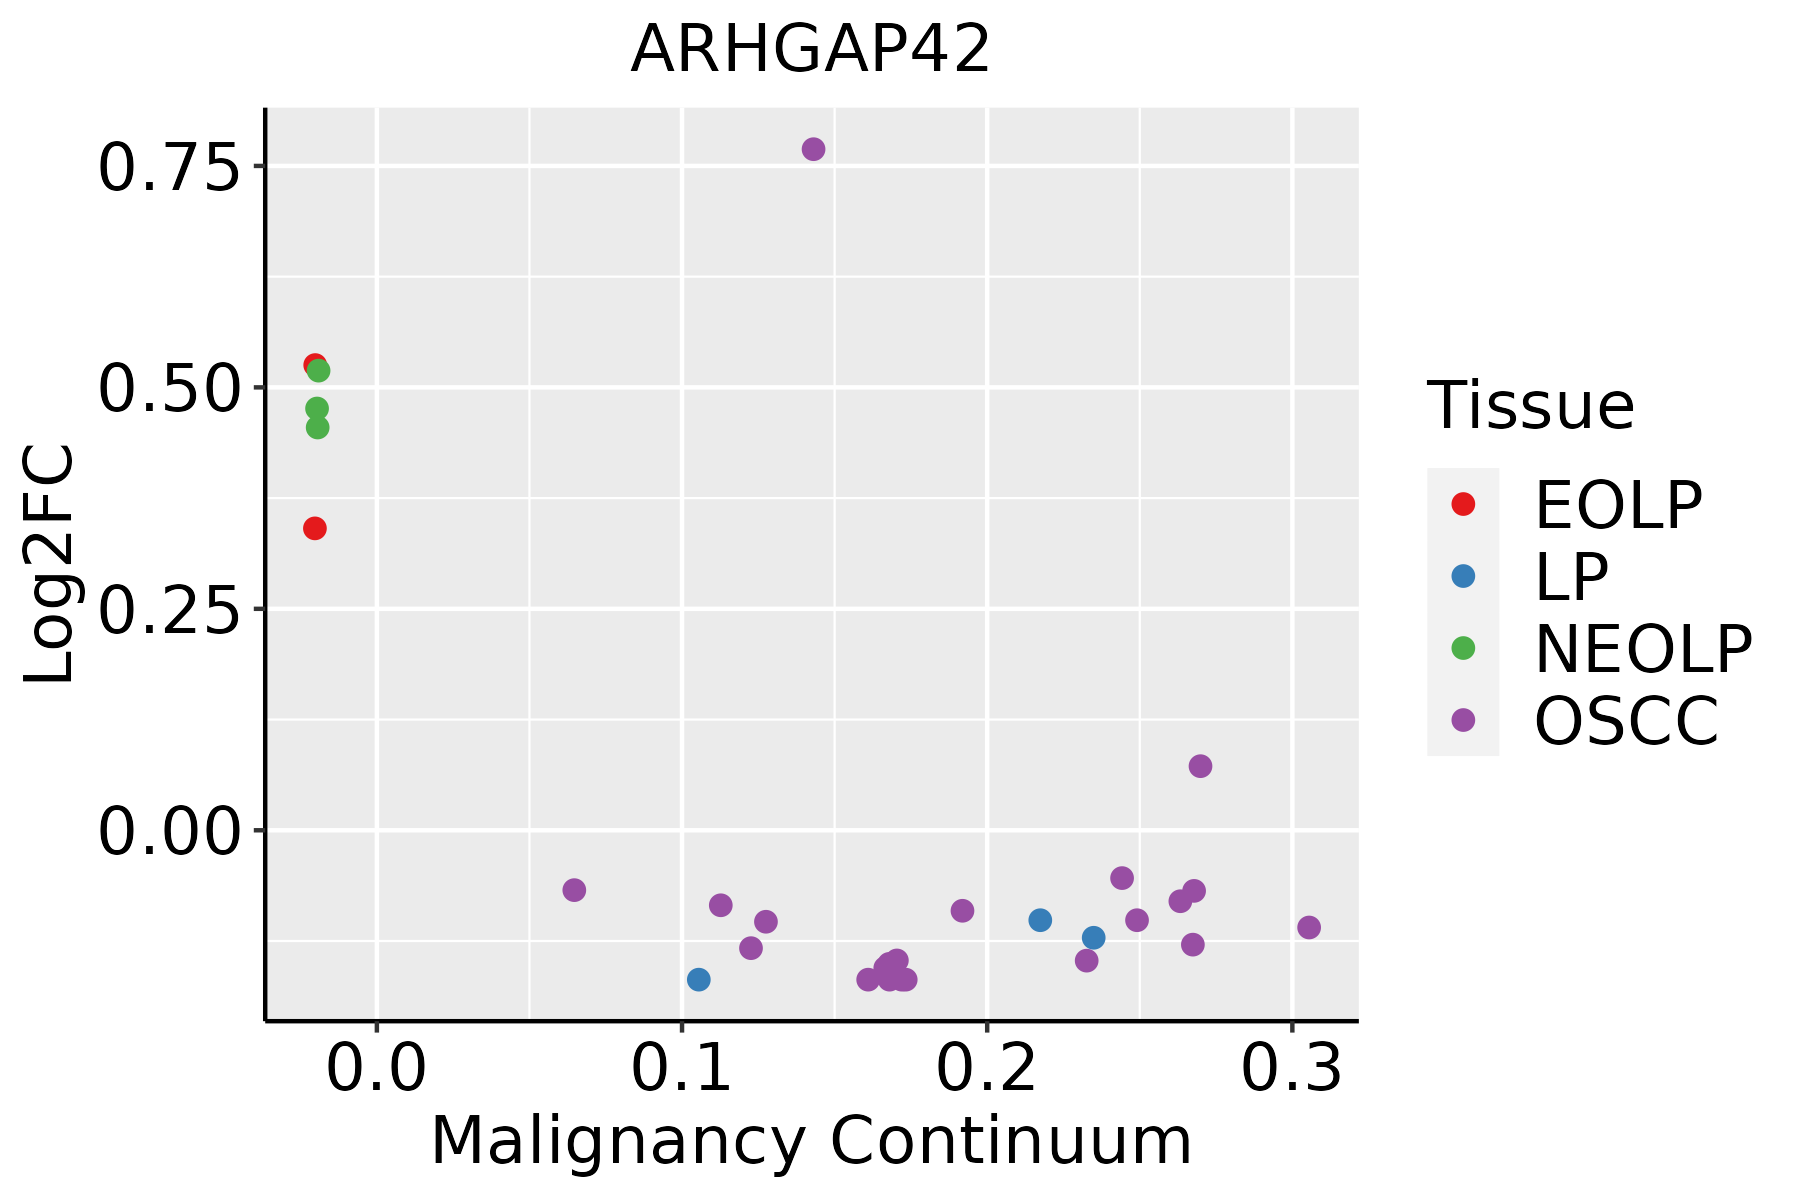
EOLP: Erosive Oral lichen planus
LP: leukoplakia
NEOLP: Non-erosive oral lichen planus
OSCC: Oral squamous cell carcinoma
ThyroidThe image shows the transcriptomic changes along malignancy continuum.log2FC in expression of this searched gene in stem-like cells from each diseased tissue sample relative to stem-like cells in normal samples in each tissue plotted against the malignancy continuum. Samples are colored based on if they are from different disease stage.ATC: Anaplastic thyroid cancer
HT: Hashimoto's thyroiditis
PTC: Papillary thyroid cancer
∗log2FC in expression of this searched gene in stem-like cells from each diseased tissue sample relative to stem-like cells in normal samples in each tissue plotted against the malignancy continuum. Samples are colored based on if they are from different disease stage.

Top

Malignant transformation related pathway analysis

check buttonFind out the enriched GO biological processes and KEGG pathways involved in transition from healthy to precancer to cancer
check button Figure of enriched GO biological processes.
TissueDisease StageEnriched GO biological Processes
ColorectumADGO analysis - Figure of enriched GO biological processes: Top 15 enriched GO BP terms are showed in the bar plot of each disease state in each tissue. Each row represents a significant GO biological process which is colored according to the -log10(p.adjust).
ColorectumSERGO analysis - Figure of enriched GO biological processes: Top 15 enriched GO BP terms are showed in the bar plot of each disease state in each tissue. Each row represents a significant GO biological process which is colored according to the -log10(p.adjust).
ColorectumMSSGO analysis - Figure of enriched GO biological processes: Top 15 enriched GO BP terms are showed in the bar plot of each disease state in each tissue. Each row represents a significant GO biological process which is colored according to the -log10(p.adjust).
ColorectumMSI-HGO analysis - Figure of enriched GO biological processes: Top 15 enriched GO BP terms are showed in the bar plot of each disease state in each tissue. Each row represents a significant GO biological process which is colored according to the -log10(p.adjust).
ColorectumFAPGO analysis - Figure of enriched GO biological processes: Top 15 enriched GO BP terms are showed in the bar plot of each disease state in each tissue. Each row represents a significant GO biological process which is colored according to the -log10(p.adjust).
∗Top 15 enriched GO BP terms are showed in the bar plot of each disease state in each tissue. Each row represents a significant GO biological process which is colored according to the -log10(p.adjust).
Page: 1 2 3 4 5 6 7 8 9 

check button Enriched GO biological processes.
GO IDTissueDisease StageDescriptionGene RatioBg Ratiopvaluep.adjustCount
GO:00430878EndometriumAEHregulation of GTPase activity66/2100348/187231.26e-052.77e-0466
GO:00510567EndometriumAEHregulation of small GTPase mediated signal transduction59/2100302/187231.43e-053.03e-0459
GO:00072657EndometriumAEHRas protein signal transduction63/2100337/187233.09e-055.66e-0463
GO:00030126EndometriumAEHmuscle system process78/2100452/187236.89e-051.06e-0378
GO:00435477EndometriumAEHpositive regulation of GTPase activity48/2100255/187232.18e-042.67e-0348
GO:0006936EndometriumAEHmuscle contraction59/2100347/187237.32e-046.99e-0359
GO:00465786EndometriumAEHregulation of Ras protein signal transduction36/2100189/187231.01e-038.97e-0336
GO:00072667EndometriumAEHRho protein signal transduction28/2100137/187231.17e-031.01e-0228
GO:00902579EndometriumAEHregulation of muscle system process44/2100252/187231.92e-031.51e-0244
GO:00069374EndometriumAEHregulation of muscle contraction32/2100169/187232.06e-031.60e-0232
GO:0045986EndometriumAEHnegative regulation of smooth muscle contraction6/210015/187234.03e-032.69e-026
GO:00350236EndometriumAEHregulation of Rho protein signal transduction18/210086/187236.39e-033.79e-0218
GO:00906304EndometriumAEHactivation of GTPase activity22/2100115/187238.42e-034.60e-0222
GO:005105612EndometriumEECregulation of small GTPase mediated signal transduction61/2168302/187239.42e-062.08e-0461
GO:004308712EndometriumEECregulation of GTPase activity67/2168348/187231.84e-053.43e-0467
GO:000726513EndometriumEECRas protein signal transduction64/2168337/187234.31e-057.10e-0464
GO:000301213EndometriumEECmuscle system process79/2168452/187231.16e-041.55e-0379
GO:004354712EndometriumEECpositive regulation of GTPase activity50/2168255/187231.26e-041.66e-0350
GO:000726613EndometriumEECRho protein signal transduction30/2168137/187234.05e-044.31e-0330
GO:004657813EndometriumEECregulation of Ras protein signal transduction37/2168189/187239.23e-048.32e-0337
Page: 1 2 3 4 5 6 7 

check button Enriched KEGG pathways.
Pathway IDTissueDisease StageDescriptionGene RatioBg Ratiopvaluep.adjustqvalueCount
Page: 1 

Top

Cell-cell communication analysis

check buttonIdentification of potential cell-cell interactions between two cell types and their ligand-receptor pairs for different disease states
LigandReceptorLRpairPathwayTissueDisease Stage
Page: 1 

Top

Single-cell gene regulatory network inference analysis

check buttonFind out the significant the regulons (TFs) and the target genes of each regulon across cell types for different disease states
TFCell TypeTissueDisease StageTarget GeneRSSRegulon Activity
∗The dot plots of a searched regulon are shown for all cell subpopulations in each disease state of each tissue based on the regulon specific score inferred using pySCENIC and by calculating the average expression.
Page: 1 

Top

Somatic mutation of malignant transformation related genes

check buttonAnnotation of somatic variants for genes involved in malignant transformation
Hugo SymbolVariant ClassVariant ClassificationdbSNP RSHGVScHGVSpHGVSp ShortSWISSPROTBIOTYPESIFTPolyPhenTumor Sample BarcodeTissueHistologySexAgeStageTherapy TypesDrugsOutcome
ARHGAP42SNVMissense_Mutationc.1849N>Tp.Pro617Serp.P617SA6NI28protein_codingtolerated(0.65)benign(0.112)TCGA-A1-A0SK-01Breastbreast invasive carcinomaFemale<65I/IIUnknownUnknownPD
ARHGAP42SNVMissense_Mutationrs367900224c.2456N>Ap.Arg819Hisp.R819HA6NI28protein_codingdeleterious(0)possibly_damaging(0.511)TCGA-A2-A4S1-01Breastbreast invasive carcinomaFemale>=65I/IIUnknownUnknownSD
ARHGAP42SNVMissense_Mutationc.568G>Cp.Glu190Glnp.E190QA6NI28protein_codingdeleterious(0.02)possibly_damaging(0.893)TCGA-AC-A23H-01Breastbreast invasive carcinomaFemale>=65I/IIUnknownUnknownPD
ARHGAP42SNVMissense_Mutationnovelc.2318A>Cp.Asp773Alap.D773AA6NI28protein_codingtolerated_low_confidence(0.16)benign(0.272)TCGA-AN-A0AT-01Breastbreast invasive carcinomaFemale<65I/IIUnknownUnknownSD
ARHGAP42SNVMissense_Mutationc.565C>Gp.Gln189Glup.Q189EA6NI28protein_codingdeleterious(0.01)benign(0.264)TCGA-AO-A124-01Breastbreast invasive carcinomaFemale<65I/IIChemotherapydoxorubicinSD
ARHGAP42SNVMissense_Mutationrs774941750c.2402N>Gp.Ala801Glyp.A801GA6NI28protein_codingtolerated(0.06)probably_damaging(0.935)TCGA-AQ-A1H3-01Breastbreast invasive carcinomaFemale<65III/IVChemotherapyadriamycinSD
ARHGAP42SNVMissense_Mutationrs746263248c.940C>Tp.Leu314Phep.L314FA6NI28protein_codingtolerated(0.09)possibly_damaging(0.621)TCGA-AR-A251-01Breastbreast invasive carcinomaFemale<65III/IVChemotherapydoxorubicinSD
ARHGAP42SNVMissense_Mutationc.1979G>Cp.Gly660Alap.G660AA6NI28protein_codingtolerated(0.33)benign(0)TCGA-BH-A18P-01Breastbreast invasive carcinomaFemale<65I/IIUnknownUnknownPD
ARHGAP42SNVMissense_Mutationc.1852G>Cp.Asp618Hisp.D618HA6NI28protein_codingtolerated(0.08)possibly_damaging(0.707)TCGA-C8-A8HQ-01Breastbreast invasive carcinomaFemale<65I/IIUnknownUnknownSD
ARHGAP42SNVMissense_Mutationc.303N>Tp.Arg101Serp.R101SA6NI28protein_codingdeleterious(0)possibly_damaging(0.852)TCGA-E9-A1R4-01Breastbreast invasive carcinomaFemale>=65I/IIChemotherapy5-fluorouracilSD
Page: 1 2 3 4 5 6 7 8 

Top

Related drugs of malignant transformation related genes

check buttonIdentification of chemicals and drugs interact with genes involved in malignant transfromation
(DGIdb 4.0)
Entrez IDSymbolCategoryInteraction TypesDrug Claim NameDrug NamePMIDs
Page: 1