Schematic overview of the cellular and molecular mechanisms involved in the cancer progression, including the proposed cellular and molecular mechanisms in cancer cells trajectory. AT1: alveolar type 1 cells; AT2: alveolar type 2 cells; AAH: atypical adenomatous hyperplasia; AIS: adenocarcinoma in situ; MIA: minimally invasive adenocarcinoma; IA: invasive adenocarcinoma; EMT: epithelial-mesenchymal transition

Home

Download

Statistics

Help

Contact

Center for Computational Systems Medicine
leaf

Gene summary

leaf

Malignant transformation analysis

leaf

Malignant transformation related pathway analysis

leaf

Cell-cell communication analysis

leaf

Single-cell gene regulatory network inference analysis

leaf

Somatic mutation of malignant transformation related genes

leaf

Related drugs of malignant transformation related genes

Gene: ARHGAP4

Gene summary for ARHGAP4

check button Gene summary.

Gene informationSpeciesHuman
Gene symbol

ARHGAP4

Gene ID

393

Gene nameRho GTPase activating protein 4
Gene AliasC1
CytomapXq28
Gene Typeprotein-coding
GO ID

GO:0000902

UniProtAcc

P98171


Top

Malignant transformation analysis

check button Identification of the aberrant gene expression in precancerous and cancerous lesions by comparing the gene expression of stem-like cells in diseased tissues with normal stem cells
check button Malignant transformation involving gene list.
Entrez IDSymbolReplicatesSpeciesOrganTissueAdj P-valueLog2FCMalignancy
393ARHGAP4HTA11_1938_2000001011HumanColorectumAD2.97e-124.57e-01-0.0811
393ARHGAP4HTA11_78_2000001011HumanColorectumAD2.40e-042.30e-01-0.1088
393ARHGAP4HTA11_83_2000001011HumanColorectumSER9.94e-104.44e-01-0.1526
393ARHGAP4HTA11_866_2000001011HumanColorectumAD2.61e-032.30e-01-0.1001
393ARHGAP4HTA11_1391_2000001011HumanColorectumAD7.63e-145.26e-01-0.059
393ARHGAP4HTA11_8622_2000001021HumanColorectumSER1.31e-053.88e-010.0528
393ARHGAP4HTA11_10711_2000001011HumanColorectumAD1.54e-052.96e-010.0338
393ARHGAP4HTA11_7696_3000711011HumanColorectumAD1.37e-255.93e-010.0674
393ARHGAP4HTA11_6818_2000001021HumanColorectumAD2.12e-104.67e-010.0588
393ARHGAP4HTA11_99999970781_79442HumanColorectumMSS9.27e-073.02e-010.294
393ARHGAP4HTA11_99999971662_82457HumanColorectumMSS2.50e-103.75e-010.3859
393ARHGAP4HCC1_MengHumanLiverHCC4.84e-156.46e-020.0246
393ARHGAP4HCC2HumanLiverHCC2.51e-102.37e+000.5341
393ARHGAP4HCC5HumanLiverHCC4.17e-023.62e-010.4932
393ARHGAP4S014HumanLiverHCC2.80e-185.28e-010.2254
393ARHGAP4S015HumanLiverHCC6.27e-144.91e-010.2375
393ARHGAP4S016HumanLiverHCC5.36e-255.66e-010.2243
393ARHGAP4S027HumanLiverHCC3.49e-231.48e+000.2446
393ARHGAP4S028HumanLiverHCC1.68e-441.39e+000.2503
393ARHGAP4S029HumanLiverHCC4.94e-381.32e+000.2581
Page: 1 2 

check button Transcriptomic changes along malignancy continuum.
TissueExpression DynamicsAbbreviation
Colorectum (GSE201348)The image shows the transcriptomic changes along malignancy continuum.log2FC in expression of this searched gene in stem-like cells from each diseased tissue sample relative to stem-like cells in normal samples in each tissue plotted against the malignancy continuum. Samples are colored based on if they are from different disease stage.FAP: Familial adenomatous polyposis
CRC: Colorectal cancer
Colorectum (HTA11)The image shows the transcriptomic changes along malignancy continuum.log2FC in expression of this searched gene in stem-like cells from each diseased tissue sample relative to stem-like cells in normal samples in each tissue plotted against the malignancy continuum. Samples are colored based on if they are from different disease stage.AD: Adenomas
SER: Sessile serrated lesions
MSI-H: Microsatellite-high colorectal cancer
MSS: Microsatellite stable colorectal cancer
LiverThe image shows the transcriptomic changes along malignancy continuum.log2FC in expression of this searched gene in stem-like cells from each diseased tissue sample relative to stem-like cells in normal samples in each tissue plotted against the malignancy continuum. Samples are colored based on if they are from different disease stage.
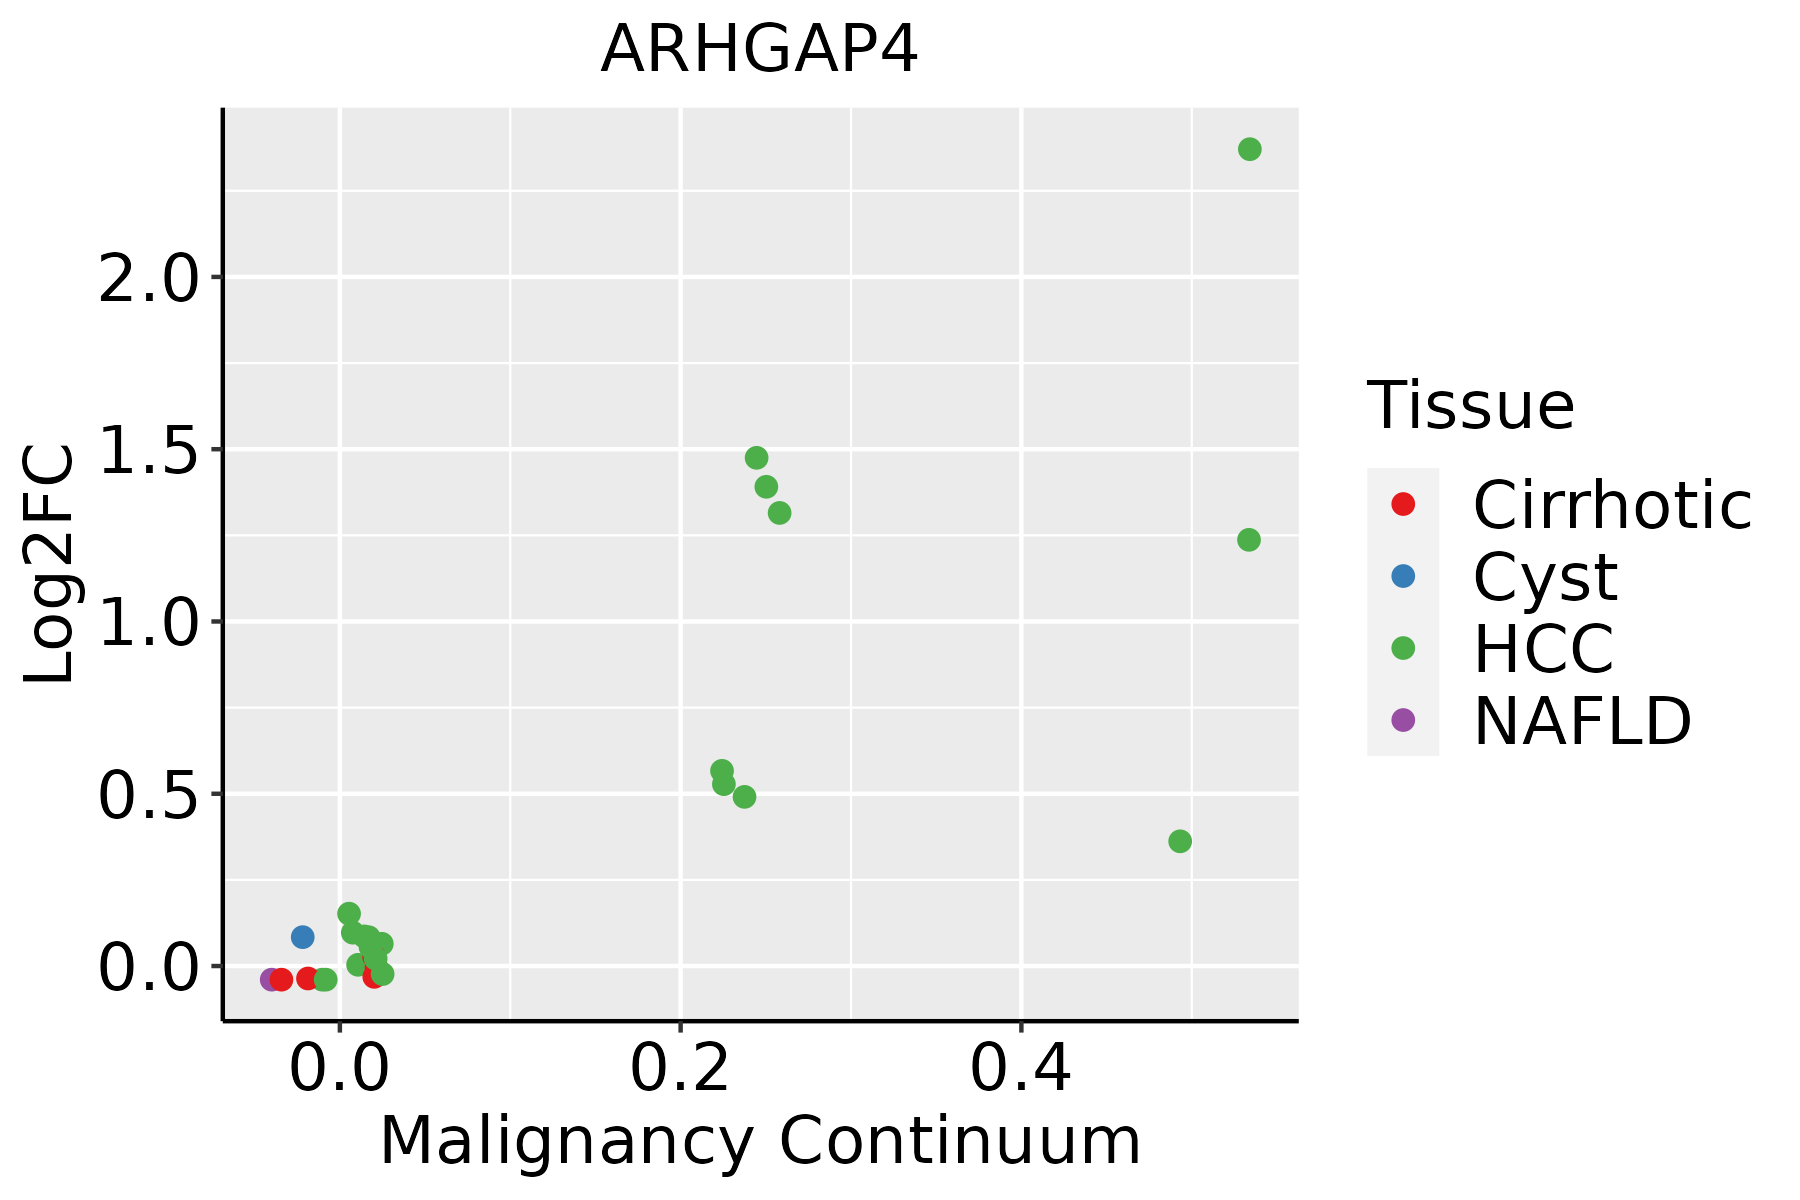
HCC: Hepatocellular carcinoma
NAFLD: Non-alcoholic fatty liver disease
Oral CavityThe image shows the transcriptomic changes along malignancy continuum.log2FC in expression of this searched gene in stem-like cells from each diseased tissue sample relative to stem-like cells in normal samples in each tissue plotted against the malignancy continuum. Samples are colored based on if they are from different disease stage.
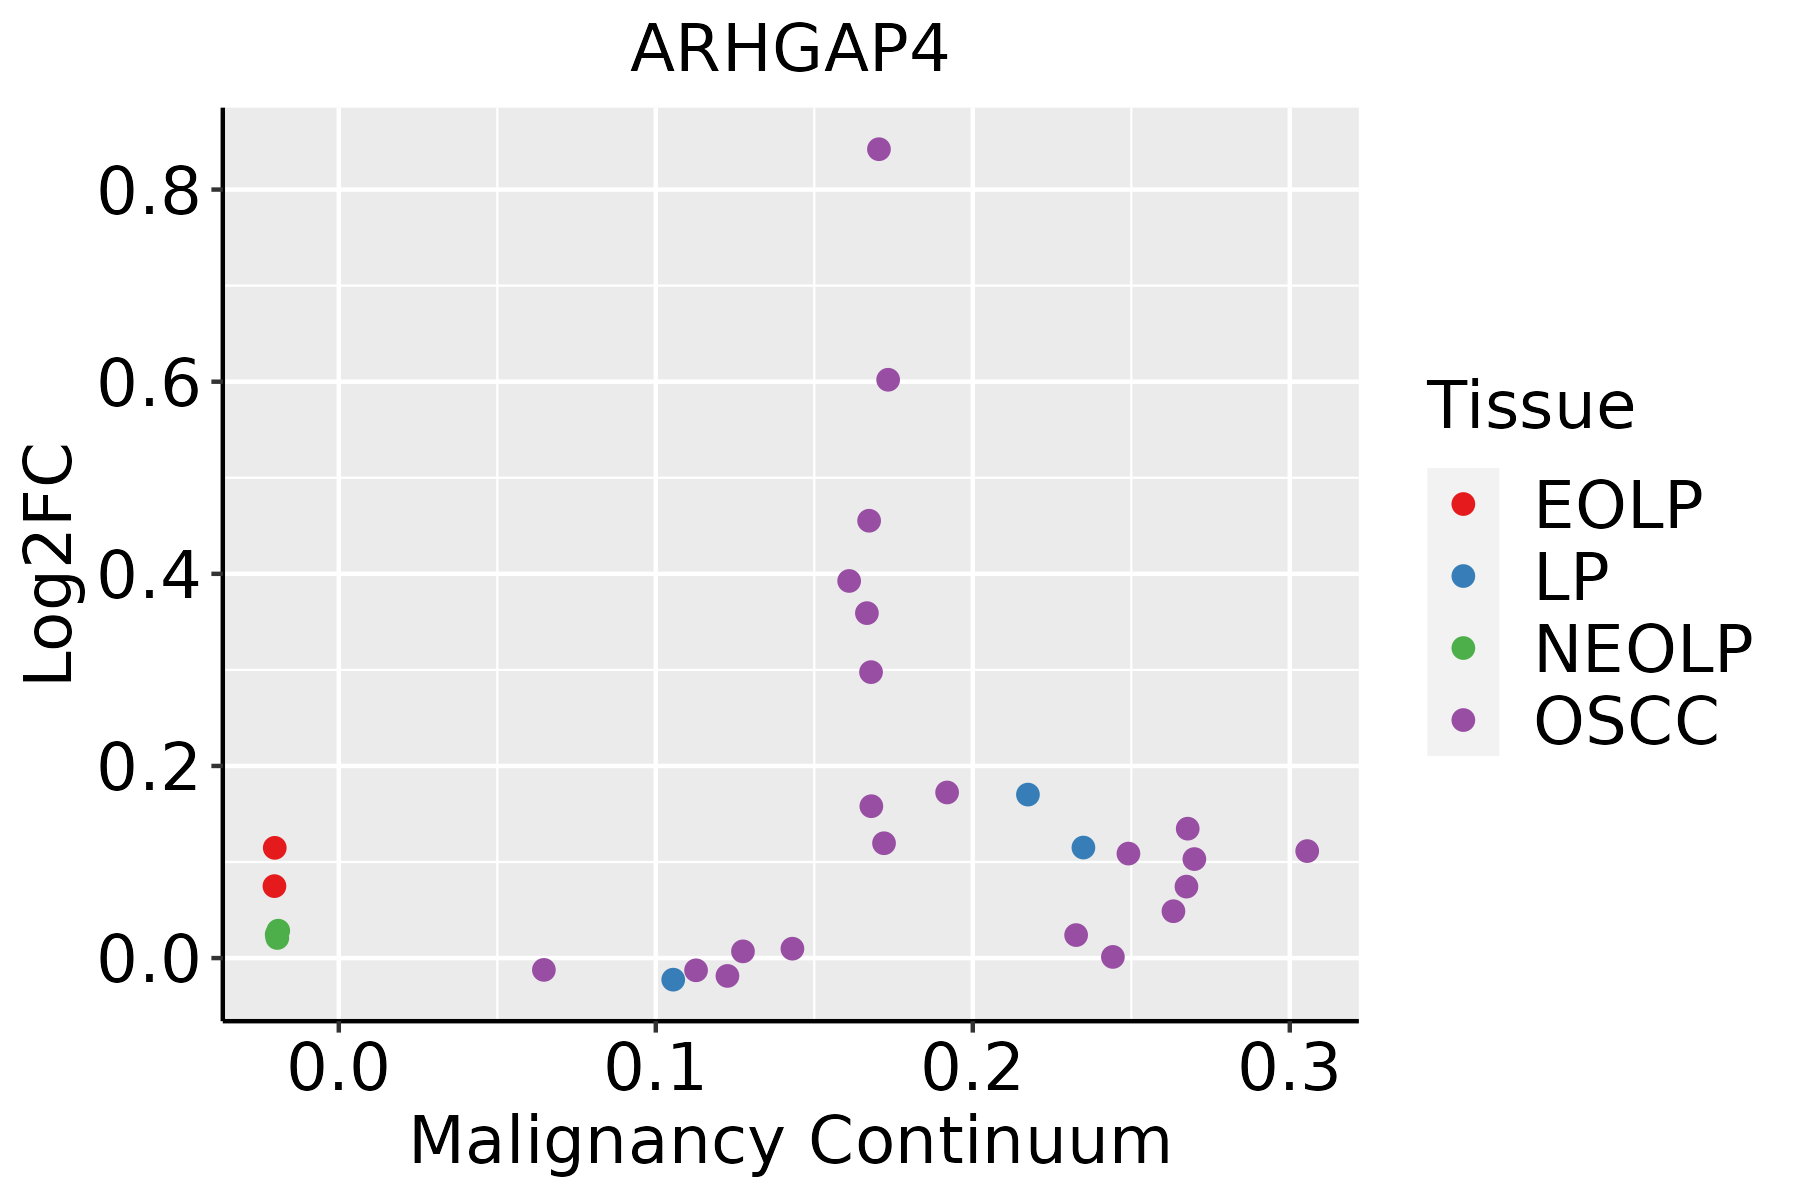
EOLP: Erosive Oral lichen planus
LP: leukoplakia
NEOLP: Non-erosive oral lichen planus
OSCC: Oral squamous cell carcinoma
∗log2FC in expression of this searched gene in stem-like cells from each diseased tissue sample relative to stem-like cells in normal samples in each tissue plotted against the malignancy continuum. Samples are colored based on if they are from different disease stage.

Top

Malignant transformation related pathway analysis

check buttonFind out the enriched GO biological processes and KEGG pathways involved in transition from healthy to precancer to cancer
check button Figure of enriched GO biological processes.
TissueDisease StageEnriched GO biological Processes
ColorectumADGO analysis - Figure of enriched GO biological processes: Top 15 enriched GO BP terms are showed in the bar plot of each disease state in each tissue. Each row represents a significant GO biological process which is colored according to the -log10(p.adjust).
ColorectumSERGO analysis - Figure of enriched GO biological processes: Top 15 enriched GO BP terms are showed in the bar plot of each disease state in each tissue. Each row represents a significant GO biological process which is colored according to the -log10(p.adjust).
ColorectumMSSGO analysis - Figure of enriched GO biological processes: Top 15 enriched GO BP terms are showed in the bar plot of each disease state in each tissue. Each row represents a significant GO biological process which is colored according to the -log10(p.adjust).
ColorectumMSI-HGO analysis - Figure of enriched GO biological processes: Top 15 enriched GO BP terms are showed in the bar plot of each disease state in each tissue. Each row represents a significant GO biological process which is colored according to the -log10(p.adjust).
ColorectumFAPGO analysis - Figure of enriched GO biological processes: Top 15 enriched GO BP terms are showed in the bar plot of each disease state in each tissue. Each row represents a significant GO biological process which is colored according to the -log10(p.adjust).
∗Top 15 enriched GO BP terms are showed in the bar plot of each disease state in each tissue. Each row represents a significant GO biological process which is colored according to the -log10(p.adjust).
Page: 1 2 3 4 5 6 7 8 9 

check button Enriched GO biological processes.
GO IDTissueDisease StageDescriptionGene RatioBg Ratiopvaluep.adjustCount
GO:0072659ColorectumADprotein localization to plasma membrane122/3918284/187232.86e-171.49e-14122
GO:1990778ColorectumADprotein localization to cell periphery129/3918333/187235.51e-141.15e-11129
GO:0032535ColorectumADregulation of cellular component size142/3918383/187231.74e-133.41e-11142
GO:0032970ColorectumADregulation of actin filament-based process142/3918397/187234.05e-125.90e-10142
GO:0090150ColorectumADestablishment of protein localization to membrane100/3918260/187236.01e-116.33e-09100
GO:0032956ColorectumADregulation of actin cytoskeleton organization127/3918358/187231.03e-101.04e-08127
GO:0016197ColorectumADendosomal transport90/3918230/187231.88e-101.73e-0890
GO:1905475ColorectumADregulation of protein localization to membrane73/3918175/187233.37e-102.93e-0873
GO:1903076ColorectumADregulation of protein localization to plasma membrane48/3918104/187237.17e-094.36e-0748
GO:1904375ColorectumADregulation of protein localization to cell periphery54/3918125/187231.52e-089.00e-0754
GO:0098876ColorectumADvesicle-mediated transport to the plasma membrane57/3918136/187232.30e-081.27e-0657
GO:0061951ColorectumADestablishment of protein localization to plasma membrane31/391860/187231.37e-076.42e-0631
GO:0032386ColorectumADregulation of intracellular transport109/3918337/187235.33e-071.95e-05109
GO:0033157ColorectumADregulation of intracellular protein transport80/3918229/187235.81e-072.09e-0580
GO:0043087ColorectumADregulation of GTPase activity110/3918348/187231.64e-065.03e-05110
GO:0016049ColorectumADcell growth143/3918482/187232.83e-068.09e-05143
GO:0001558ColorectumADregulation of cell growth124/3918414/187237.67e-061.86e-04124
GO:0007265ColorectumADRas protein signal transduction104/3918337/187231.01e-052.35e-04104
GO:0051056ColorectumADregulation of small GTPase mediated signal transduction94/3918302/187231.81e-053.76e-0494
GO:0001667ColorectumADameboidal-type cell migration137/3918475/187232.17e-054.33e-04137
Page: 1 2 3 4 5 6 7 8 9 10 11 12 13 14 15 16 17 18 19 20 21 22 

check button Enriched KEGG pathways.
Pathway IDTissueDisease StageDescriptionGene RatioBg Ratiopvaluep.adjustqvalueCount
Page: 1 

Top

Cell-cell communication analysis

check buttonIdentification of potential cell-cell interactions between two cell types and their ligand-receptor pairs for different disease states
LigandReceptorLRpairPathwayTissueDisease Stage
Page: 1 

Top

Single-cell gene regulatory network inference analysis

check buttonFind out the significant the regulons (TFs) and the target genes of each regulon across cell types for different disease states
TFCell TypeTissueDisease StageTarget GeneRSSRegulon Activity
∗The dot plots of a searched regulon are shown for all cell subpopulations in each disease state of each tissue based on the regulon specific score inferred using pySCENIC and by calculating the average expression.
Page: 1 

Top

Somatic mutation of malignant transformation related genes

check buttonAnnotation of somatic variants for genes involved in malignant transformation
Hugo SymbolVariant ClassVariant ClassificationdbSNP RSHGVScHGVSpHGVSp ShortSWISSPROTBIOTYPESIFTPolyPhenTumor Sample BarcodeTissueHistologySexAgeStageTherapy TypesDrugsOutcome
ARHGAP4SNVMissense_Mutationnovelc.2188C>Ap.Gln730Lysp.Q730KP98171protein_codingdeleterious(0.03)benign(0.069)TCGA-AC-A2FM-01Breastbreast invasive carcinomaFemale>=65I/IIUnknownUnknownPD
ARHGAP4SNVMissense_Mutationc.884N>Tp.Ala295Valp.A295VP98171protein_codingdeleterious(0)possibly_damaging(0.632)TCGA-BH-A18G-01Breastbreast invasive carcinomaFemale>=65I/IIUnknownUnknownSD
ARHGAP4SNVMissense_Mutationnovelc.2551N>Tp.Val851Leup.V851LP98171protein_codingtolerated(0.43)benign(0.039)TCGA-E9-A1RC-01Breastbreast invasive carcinomaFemale<65III/IVHormone TherapytamoxiphenSD
ARHGAP4insertionIn_Frame_Insnovelc.820_821insTACp.Glu274delinsValGlnp.E274delinsVQP98171protein_codingTCGA-AO-A0J5-01Breastbreast invasive carcinomaFemale<65III/IVOther, specify in notesBisphosphonatezoledronicPD
ARHGAP4insertionNonsense_Mutationnovelc.819_820insCGTGGCTAAGATTTp.Glu274ArgfsTer3p.E274Rfs*3P98171protein_codingTCGA-AO-A0J5-01Breastbreast invasive carcinomaFemale<65III/IVOther, specify in notesBisphosphonatezoledronicPD
ARHGAP4SNVMissense_Mutationc.1121N>Ap.Arg374Hisp.R374HP98171protein_codingdeleterious(0)probably_damaging(0.98)TCGA-2W-A8YY-01Cervixcervical & endocervical cancerFemale<65I/IIChemotherapycisplatinCR
ARHGAP4SNVMissense_Mutationnovelc.567N>Tp.Glu189Aspp.E189DP98171protein_codingdeleterious(0)benign(0.345)TCGA-2W-A8YY-01Cervixcervical & endocervical cancerFemale<65I/IIChemotherapycisplatinCR
ARHGAP4SNVMissense_Mutationnovelc.1145N>Ap.Gly382Glup.G382EP98171protein_codingdeleterious(0.01)probably_damaging(0.961)TCGA-C5-A1M5-01Cervixcervical & endocervical cancerFemale<65I/IIUnknownUnknownPD
ARHGAP4SNVMissense_Mutationnovelc.1091N>Cp.Val364Alap.V364AP98171protein_codingtolerated(0.37)benign(0.003)TCGA-C5-A1ME-01Cervixcervical & endocervical cancerFemale<65I/IIUnknownUnknownSD
ARHGAP4SNVMissense_Mutationnovelc.787N>Tp.Pro263Serp.P263SP98171protein_codingtolerated_low_confidence(0.79)benign(0.025)TCGA-EA-A3HS-01Cervixcervical & endocervical cancerFemale<65I/IIUnknownUnknownSD
Page: 1 2 3 4 5 6 7 8 9 10 11 

Top

Related drugs of malignant transformation related genes

check buttonIdentification of chemicals and drugs interact with genes involved in malignant transfromation
(DGIdb 4.0)
Entrez IDSymbolCategoryInteraction TypesDrug Claim NameDrug NamePMIDs
Page: 1