
|
|||||
|
 | |
| |
| |
| |
| |
| |
|
Gene: ARHGAP30 |
Gene summary for ARHGAP30 |
| Gene information | Species | Human | Gene symbol | ARHGAP30 | Gene ID | 257106 |
| Gene name | Rho GTPase activating protein 30 | |
| Gene Alias | ARHGAP30 | |
| Cytomap | 1q23.3 | |
| Gene Type | protein-coding | GO ID | GO:0007154 | UniProtAcc | Q7Z6I6 |
Top |
Malignant transformation analysis |
| Identification of the aberrant gene expression in precancerous and cancerous lesions by comparing the gene expression of stem-like cells in diseased tissues with normal stem cells |
| Entrez ID | Symbol | Replicates | Species | Organ | Tissue | Adj P-value | Log2FC | Malignancy |
| 257106 | ARHGAP30 | C21 | Human | Oral cavity | OSCC | 7.83e-05 | 1.75e-01 | 0.2678 |
| 257106 | ARHGAP30 | C38 | Human | Oral cavity | OSCC | 7.06e-07 | 6.15e-01 | 0.172 |
| 257106 | ARHGAP30 | C46 | Human | Oral cavity | OSCC | 1.78e-04 | 1.60e-01 | 0.1673 |
| 257106 | ARHGAP30 | C57 | Human | Oral cavity | OSCC | 1.43e-12 | 2.87e-01 | 0.1679 |
| 257106 | ARHGAP30 | C06 | Human | Oral cavity | OSCC | 1.76e-03 | 5.21e-01 | 0.2699 |
| 257106 | ARHGAP30 | LN46 | Human | Oral cavity | OSCC | 2.08e-04 | 1.20e-01 | 0.1666 |
| Page: 1 |
| Tissue | Expression Dynamics | Abbreviation |
| Oral Cavity | 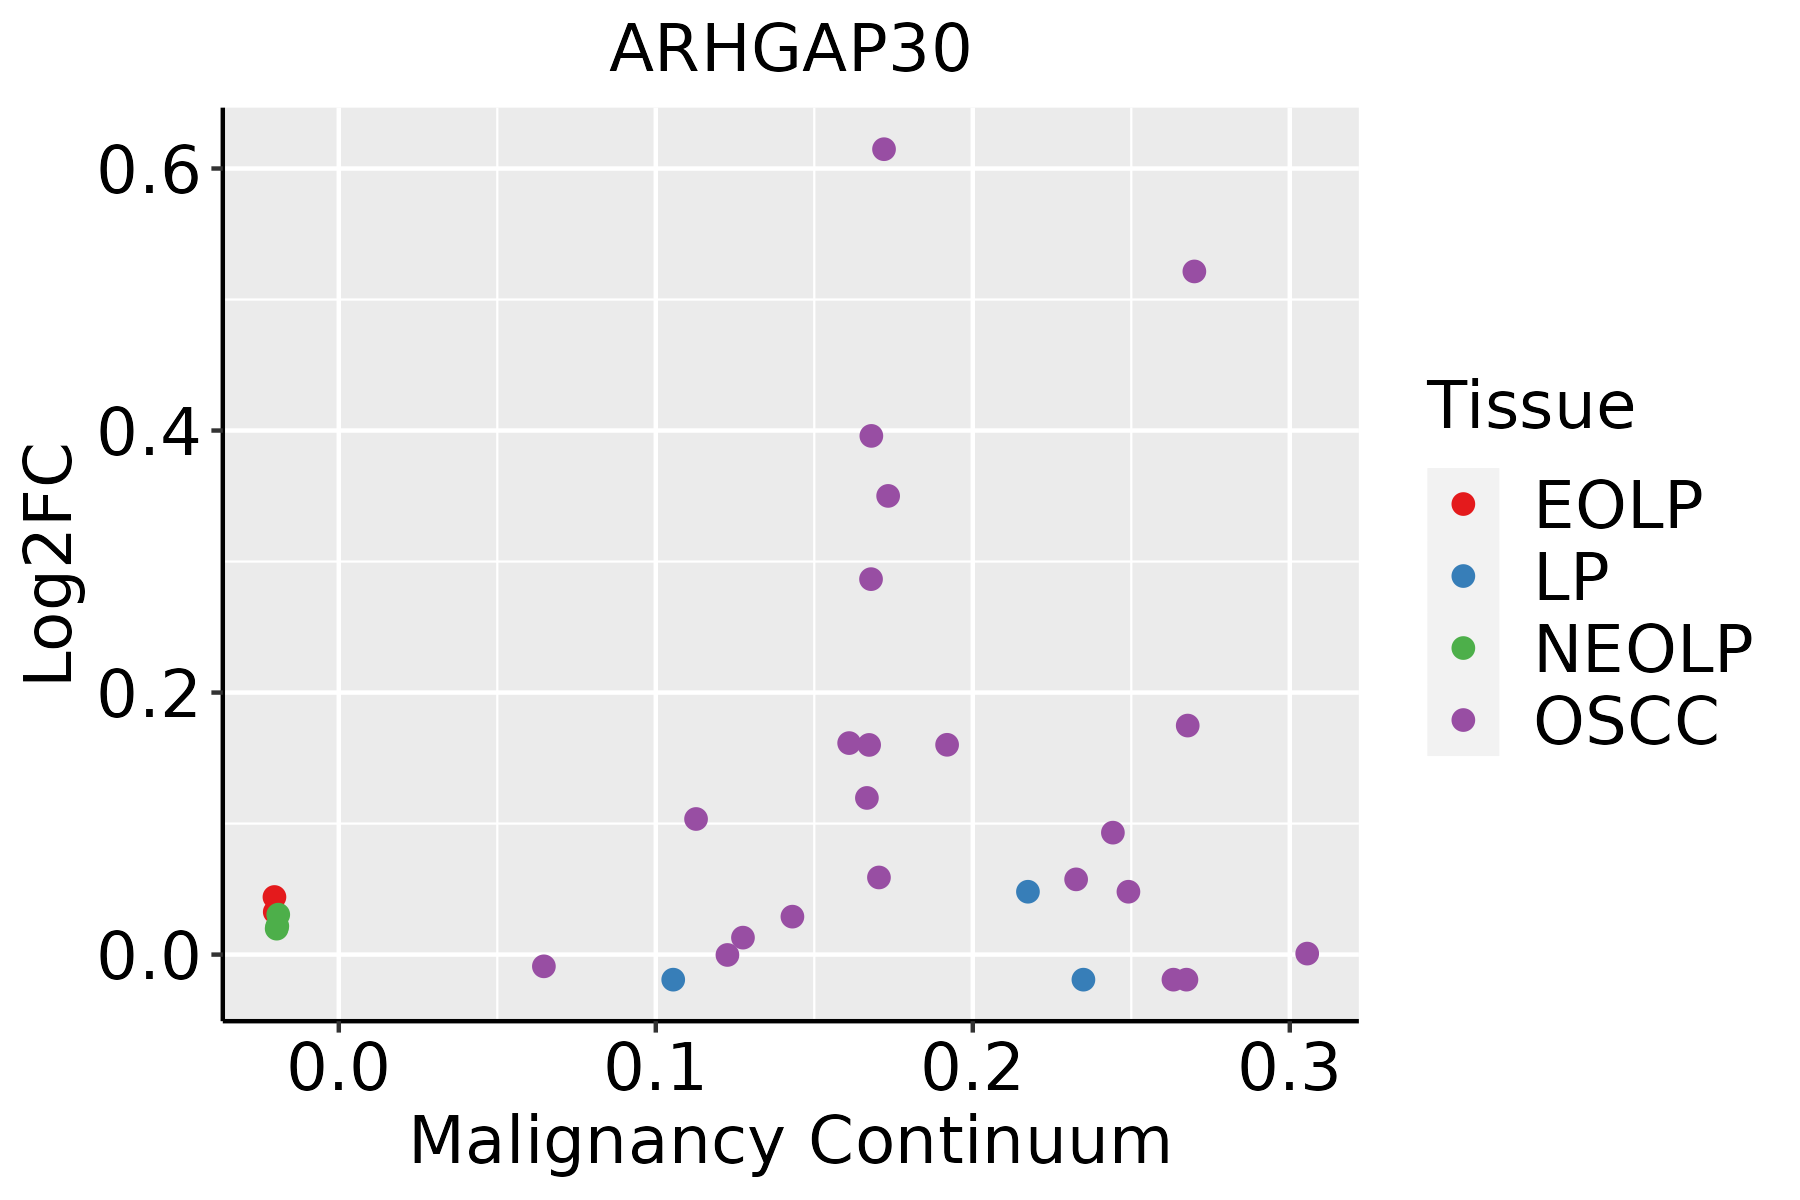 | EOLP: Erosive Oral lichen planus |
| LP: leukoplakia | ||
| NEOLP: Non-erosive oral lichen planus | ||
| OSCC: Oral squamous cell carcinoma |
| ∗log2FC in expression of this searched gene in stem-like cells from each diseased tissue sample relative to stem-like cells in normal samples in each tissue plotted against the malignancy continuum. Samples are colored based on if they are from different disease stage. |
Top |
Malignant transformation related pathway analysis |
| Find out the enriched GO biological processes and KEGG pathways involved in transition from healthy to precancer to cancer |
| Tissue | Disease Stage | Enriched GO biological Processes |
| Colorectum | AD |  |
| Colorectum | SER |  |
| Colorectum | MSS |  |
| Colorectum | MSI-H |  |
| Colorectum | FAP |  |
| ∗Top 15 enriched GO BP terms are showed in the bar plot of each disease state in each tissue. Each row represents a significant GO biological process which is colored according to the -log10(p.adjust). |
| Page: 1 2 3 4 5 6 7 8 9 |
| GO ID | Tissue | Disease Stage | Description | Gene Ratio | Bg Ratio | pvalue | p.adjust | Count |
| Page: 1 |
| Pathway ID | Tissue | Disease Stage | Description | Gene Ratio | Bg Ratio | pvalue | p.adjust | qvalue | Count |
| Page: 1 |
Top |
Cell-cell communication analysis |
| Identification of potential cell-cell interactions between two cell types and their ligand-receptor pairs for different disease states |
| Ligand | Receptor | LRpair | Pathway | Tissue | Disease Stage |
| Page: 1 |
Top |
Single-cell gene regulatory network inference analysis |
| Find out the significant the regulons (TFs) and the target genes of each regulon across cell types for different disease states |
| TF | Cell Type | Tissue | Disease Stage | Target Gene | RSS | Regulon Activity |
| ∗The dot plots of a searched regulon are shown for all cell subpopulations in each disease state of each tissue based on the regulon specific score inferred using pySCENIC and by calculating the average expression. |
| Page: 1 |
Top |
Somatic mutation of malignant transformation related genes |
| Annotation of somatic variants for genes involved in malignant transformation |
| Hugo Symbol | Variant Class | Variant Classification | dbSNP RS | HGVSc | HGVSp | HGVSp Short | SWISSPROT | BIOTYPE | SIFT | PolyPhen | Tumor Sample Barcode | Tissue | Histology | Sex | Age | Stage | Therapy Types | Drugs | Outcome |
| ARHGAP30 | SNV | Missense_Mutation | novel | c.2455N>A | p.Asp819Asn | p.D819N | Q7Z6I6 | protein_coding | deleterious_low_confidence(0.01) | benign(0.18) | TCGA-AC-A3BB-01 | Breast | breast invasive carcinoma | Female | <65 | III/IV | Chemotherapy | cytoxan | CR |
| ARHGAP30 | SNV | Missense_Mutation | novel | c.215C>T | p.Ser72Leu | p.S72L | Q7Z6I6 | protein_coding | deleterious(0.04) | benign(0.026) | TCGA-AC-A5EH-01 | Breast | breast invasive carcinoma | Female | >=65 | I/II | Unknown | Unknown | SD |
| ARHGAP30 | SNV | Missense_Mutation | c.2467N>T | p.Pro823Ser | p.P823S | Q7Z6I6 | protein_coding | tolerated_low_confidence(0.29) | benign(0.003) | TCGA-AO-A0J4-01 | Breast | breast invasive carcinoma | Female | <65 | I/II | Chemotherapy | doxorubicin | SD | |
| ARHGAP30 | SNV | Missense_Mutation | novel | c.748C>G | p.Pro250Ala | p.P250A | Q7Z6I6 | protein_coding | tolerated(0.06) | benign(0.059) | TCGA-BH-A0H0-01 | Breast | breast invasive carcinoma | Female | >=65 | I/II | Hormone Therapy | arimidex | SD |
| ARHGAP30 | SNV | Missense_Mutation | c.574G>A | p.Ala192Thr | p.A192T | Q7Z6I6 | protein_coding | deleterious(0) | probably_damaging(0.987) | TCGA-D8-A1XQ-01 | Breast | breast invasive carcinoma | Female | >=65 | I/II | Unknown | Unknown | SD | |
| ARHGAP30 | SNV | Missense_Mutation | c.911N>A | p.Arg304His | p.R304H | Q7Z6I6 | protein_coding | deleterious(0.01) | probably_damaging(0.948) | TCGA-LL-A9Q3-01 | Breast | breast invasive carcinoma | Female | >=65 | III/IV | Immunotherapy | herceptin | CR | |
| ARHGAP30 | insertion | Frame_Shift_Ins | novel | c.2869_2870insCATTCTTTTTCTTCTTCTTGTTTGGGTGCTCTTCC | p.Ile957ThrfsTer59 | p.I957Tfs*59 | Q7Z6I6 | protein_coding | TCGA-A8-A07J-01 | Breast | breast invasive carcinoma | Female | <65 | I/II | Chemotherapy | 5-fluorouracil | CR | ||
| ARHGAP30 | insertion | In_Frame_Ins | novel | c.596_597insCAATAATTTCAAAAAATATTTAATGAGTGCCTATTATATACC | p.Val199_Gln200insAsnAsnPheLysLysTyrLeuMetSerAlaTyrTyrIlePro | p.V199_Q200insNNFKKYLMSAYYIP | Q7Z6I6 | protein_coding | TCGA-AN-A0FS-01 | Breast | breast invasive carcinoma | Female | <65 | I/II | Unknown | Unknown | SD | ||
| ARHGAP30 | insertion | In_Frame_Ins | novel | c.3255_3256insAGATTCCCAAGAAAGTCAACAAGATCTTGT | p.Arg1085_Ser1086insArgPheProArgLysSerThrArgSerCys | p.R1085_S1086insRFPRKSTRSC | Q7Z6I6 | protein_coding | TCGA-AO-A03T-01 | Breast | breast invasive carcinoma | Female | <65 | I/II | Chemotherapy | cyclophosphamide | SD | ||
| ARHGAP30 | insertion | Frame_Shift_Ins | novel | c.3253_3254insCTTATCTCTTA | p.Arg1085ThrfsTer23 | p.R1085Tfs*23 | Q7Z6I6 | protein_coding | TCGA-AO-A03T-01 | Breast | breast invasive carcinoma | Female | <65 | I/II | Chemotherapy | cyclophosphamide | SD |
| Page: 1 2 3 4 5 6 7 8 9 10 11 12 13 14 |
Top |
Related drugs of malignant transformation related genes |
| Identification of chemicals and drugs interact with genes involved in malignant transfromation |
| (DGIdb 4.0) |
| Entrez ID | Symbol | Category | Interaction Types | Drug Claim Name | Drug Name | PMIDs |
| Page: 1 |

Copyright 2023-Present -The University of Texas Health Science Center at Houston |