
|
|||||
|
 | |
| |
| |
| |
| |
| |
|
Gene: ARHGAP29 |
Gene summary for ARHGAP29 |
| Gene information | Species | Human | Gene symbol | ARHGAP29 | Gene ID | 9411 |
| Gene name | Rho GTPase activating protein 29 | |
| Gene Alias | PARG1 | |
| Cytomap | 1p22.1 | |
| Gene Type | protein-coding | GO ID | GO:0007154 | UniProtAcc | Q52LW3 |
Top |
Malignant transformation analysis |
| Identification of the aberrant gene expression in precancerous and cancerous lesions by comparing the gene expression of stem-like cells in diseased tissues with normal stem cells |
| Entrez ID | Symbol | Replicates | Species | Organ | Tissue | Adj P-value | Log2FC | Malignancy |
| 9411 | ARHGAP29 | GSM4909281 | Human | Breast | IDC | 1.31e-14 | -5.18e-01 | 0.21 |
| 9411 | ARHGAP29 | GSM4909282 | Human | Breast | IDC | 7.67e-11 | -4.71e-01 | -0.0288 |
| 9411 | ARHGAP29 | GSM4909285 | Human | Breast | IDC | 8.10e-31 | -6.77e-01 | 0.21 |
| 9411 | ARHGAP29 | GSM4909286 | Human | Breast | IDC | 3.21e-31 | -6.94e-01 | 0.1081 |
| 9411 | ARHGAP29 | GSM4909287 | Human | Breast | IDC | 3.82e-15 | -5.04e-01 | 0.2057 |
| 9411 | ARHGAP29 | GSM4909288 | Human | Breast | IDC | 1.38e-09 | -6.45e-01 | 0.0988 |
| 9411 | ARHGAP29 | GSM4909290 | Human | Breast | IDC | 3.30e-18 | -6.11e-01 | 0.2096 |
| 9411 | ARHGAP29 | GSM4909293 | Human | Breast | IDC | 2.06e-10 | -4.21e-01 | 0.1581 |
| 9411 | ARHGAP29 | GSM4909294 | Human | Breast | IDC | 5.95e-10 | -4.44e-01 | 0.2022 |
| 9411 | ARHGAP29 | GSM4909296 | Human | Breast | IDC | 2.19e-19 | -5.43e-01 | 0.1524 |
| 9411 | ARHGAP29 | GSM4909297 | Human | Breast | IDC | 1.73e-12 | -4.50e-01 | 0.1517 |
| 9411 | ARHGAP29 | GSM4909298 | Human | Breast | IDC | 8.72e-25 | -6.16e-01 | 0.1551 |
| 9411 | ARHGAP29 | GSM4909301 | Human | Breast | IDC | 1.27e-20 | -5.98e-01 | 0.1577 |
| 9411 | ARHGAP29 | GSM4909302 | Human | Breast | IDC | 1.78e-14 | -4.97e-01 | 0.1545 |
| 9411 | ARHGAP29 | GSM4909304 | Human | Breast | IDC | 2.08e-16 | -5.64e-01 | 0.1636 |
| 9411 | ARHGAP29 | GSM4909306 | Human | Breast | IDC | 3.79e-07 | -4.02e-01 | 0.1564 |
| 9411 | ARHGAP29 | GSM4909308 | Human | Breast | IDC | 3.08e-14 | -4.83e-01 | 0.158 |
| 9411 | ARHGAP29 | GSM4909309 | Human | Breast | IDC | 7.43e-10 | -4.45e-01 | 0.0483 |
| 9411 | ARHGAP29 | GSM4909311 | Human | Breast | IDC | 7.89e-23 | -5.23e-01 | 0.1534 |
| 9411 | ARHGAP29 | GSM4909312 | Human | Breast | IDC | 1.03e-03 | -2.80e-01 | 0.1552 |
| Page: 1 2 3 4 5 6 7 |
| Tissue | Expression Dynamics | Abbreviation |
| Breast |  | IDC: Invasive ductal carcinoma |
| DCIS: Ductal carcinoma in situ | ||
| Precancer(BRCA1-mut): Precancerous lesion from BRCA1 mutation carriers | ||
| Esophagus | 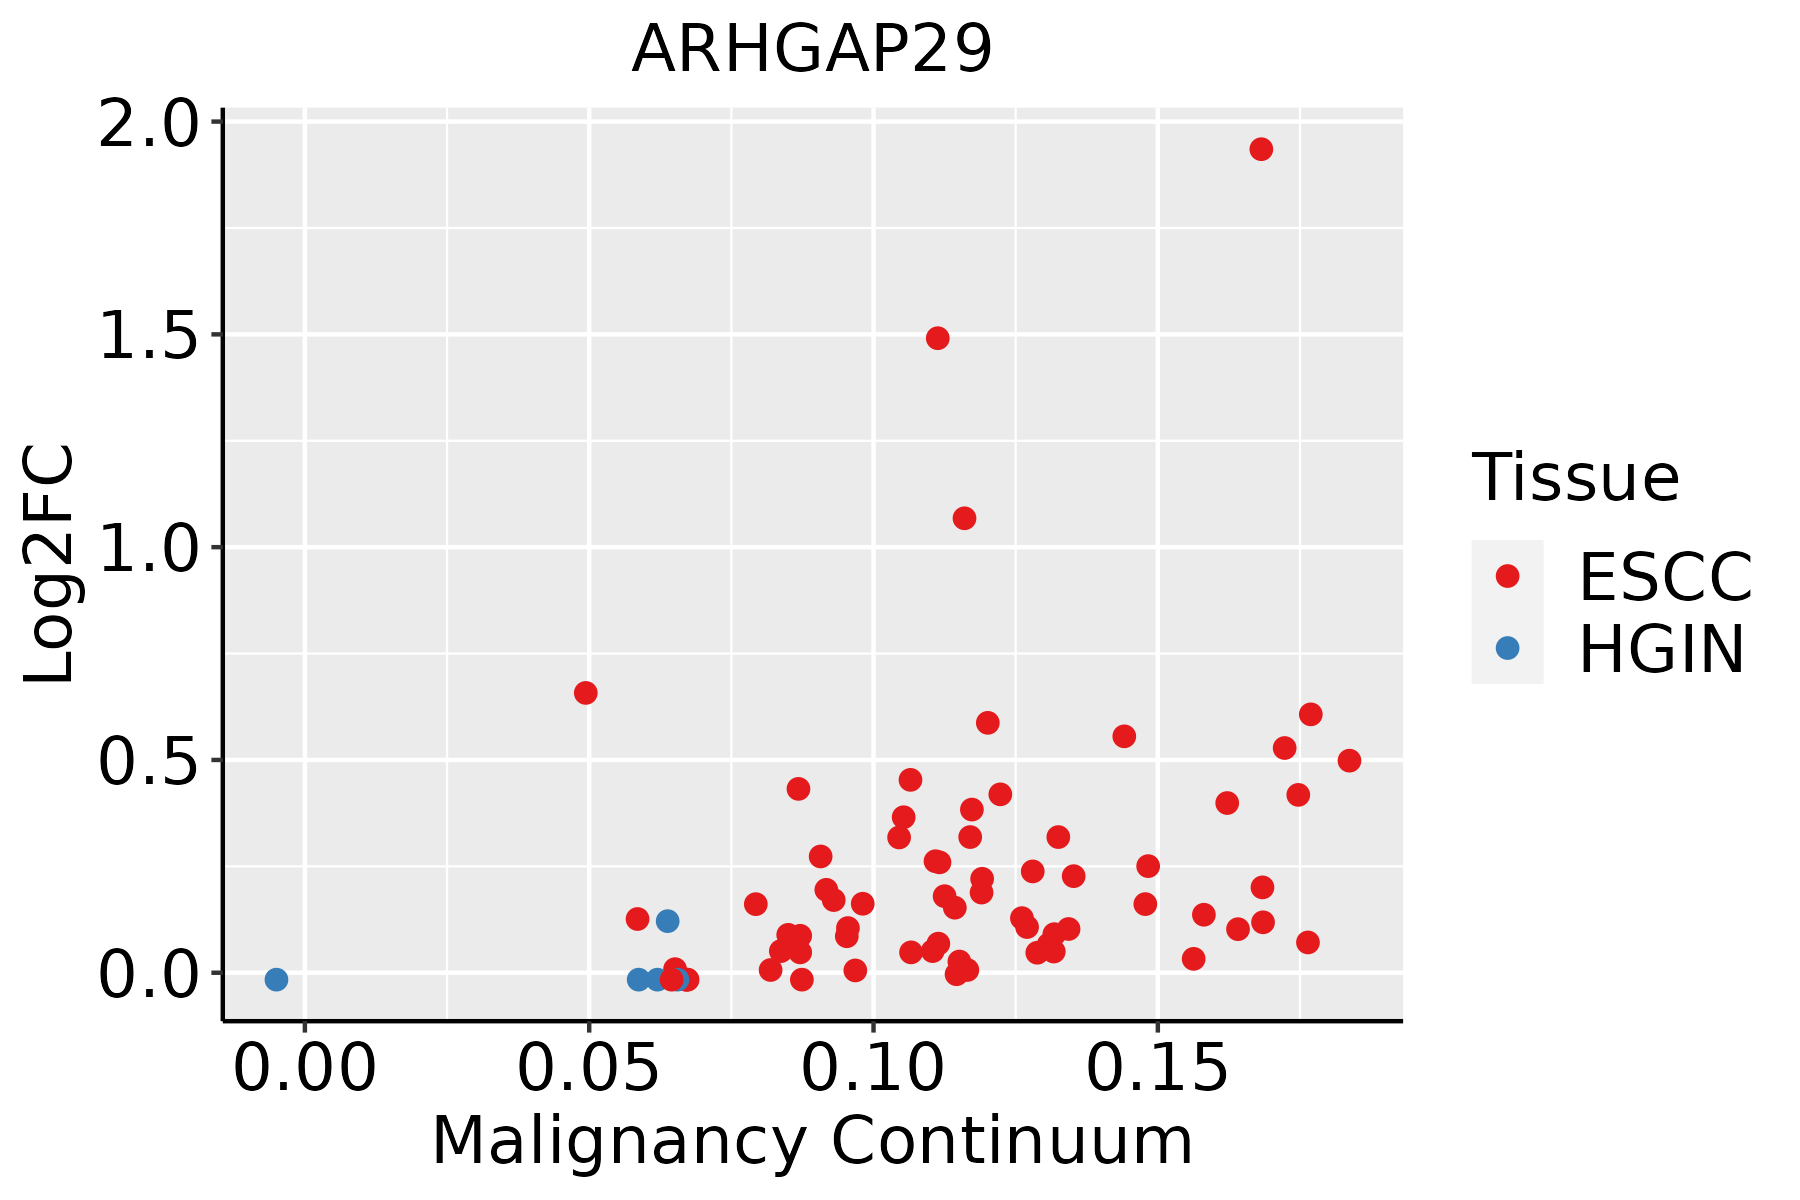 | ESCC: Esophageal squamous cell carcinoma |
| HGIN: High-grade intraepithelial neoplasias | ||
| LGIN: Low-grade intraepithelial neoplasias | ||
| Liver |  | HCC: Hepatocellular carcinoma |
| NAFLD: Non-alcoholic fatty liver disease | ||
| Lung | 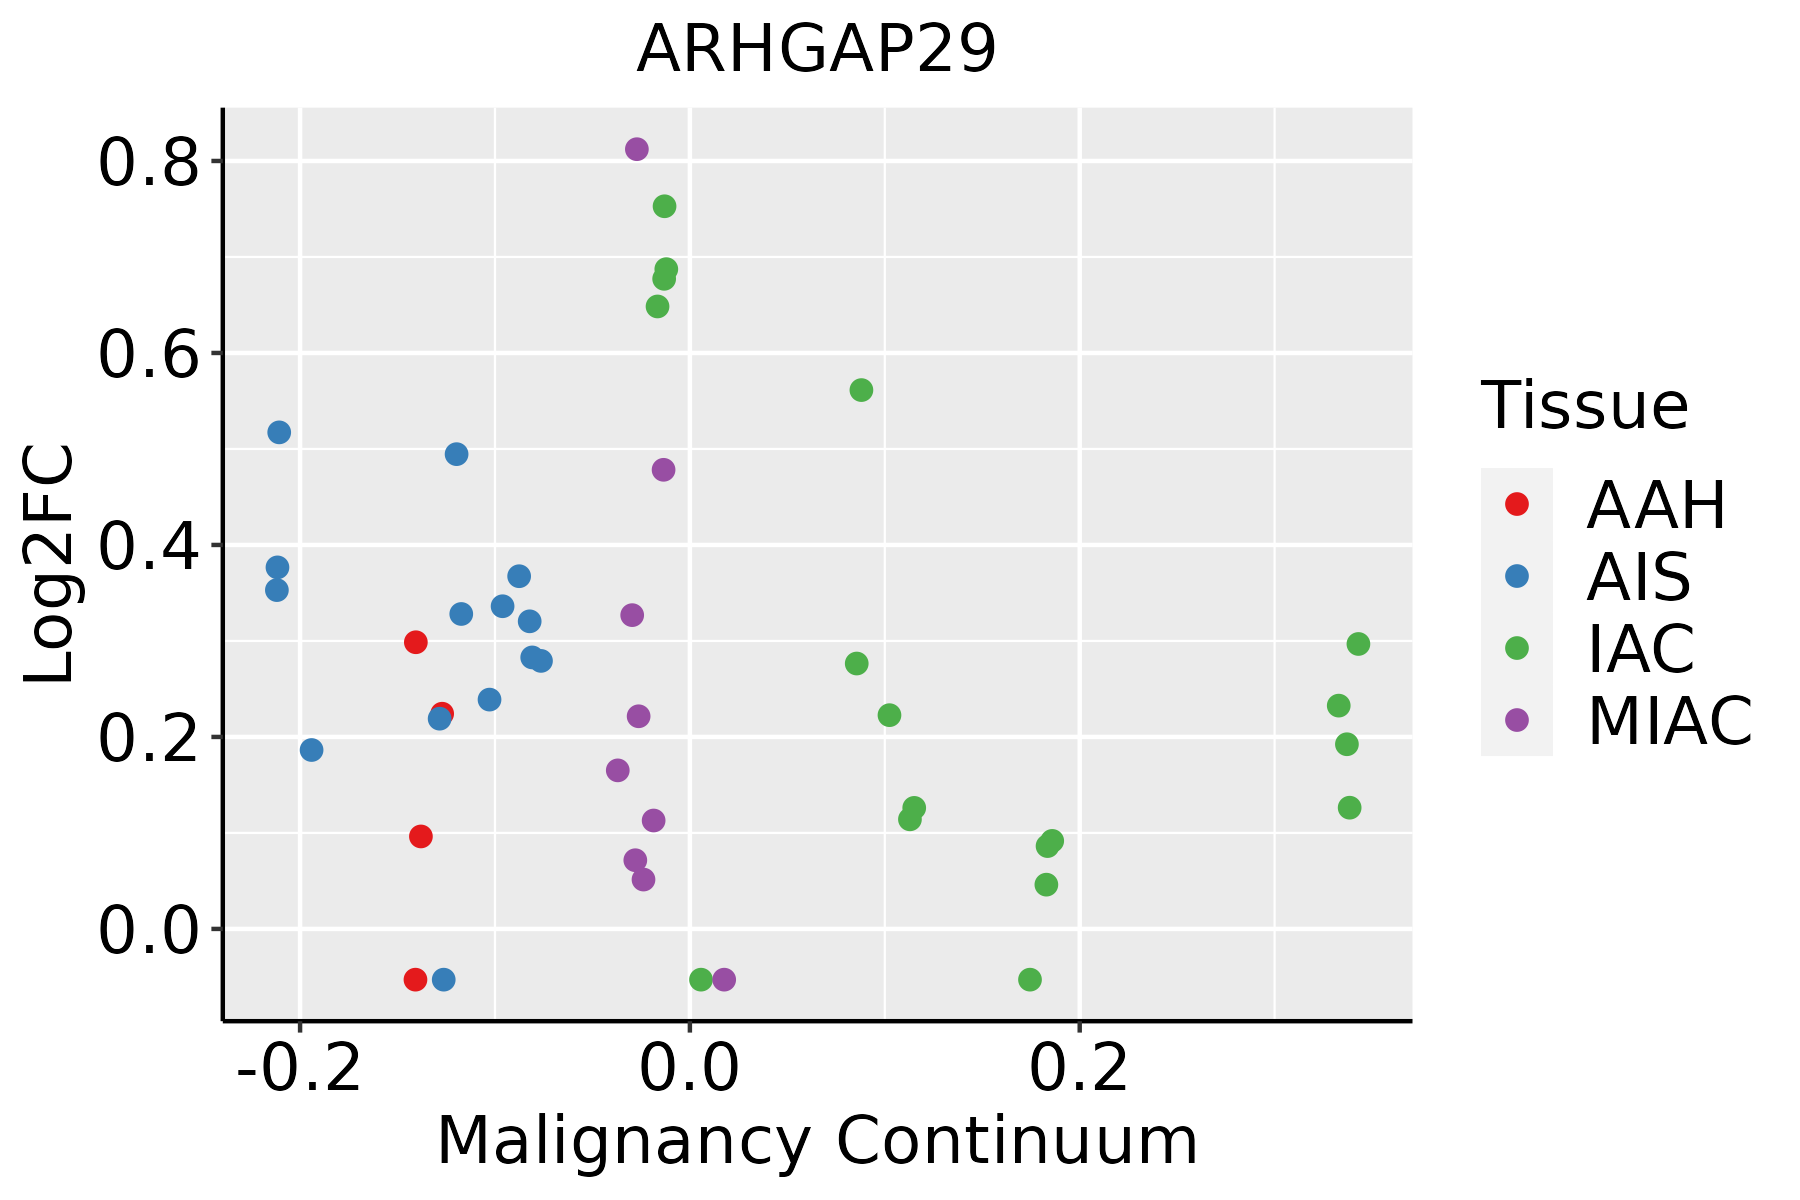 | AAH: Atypical adenomatous hyperplasia |
| AIS: Adenocarcinoma in situ | ||
| IAC: Invasive lung adenocarcinoma | ||
| MIA: Minimally invasive adenocarcinoma | ||
| Oral Cavity | 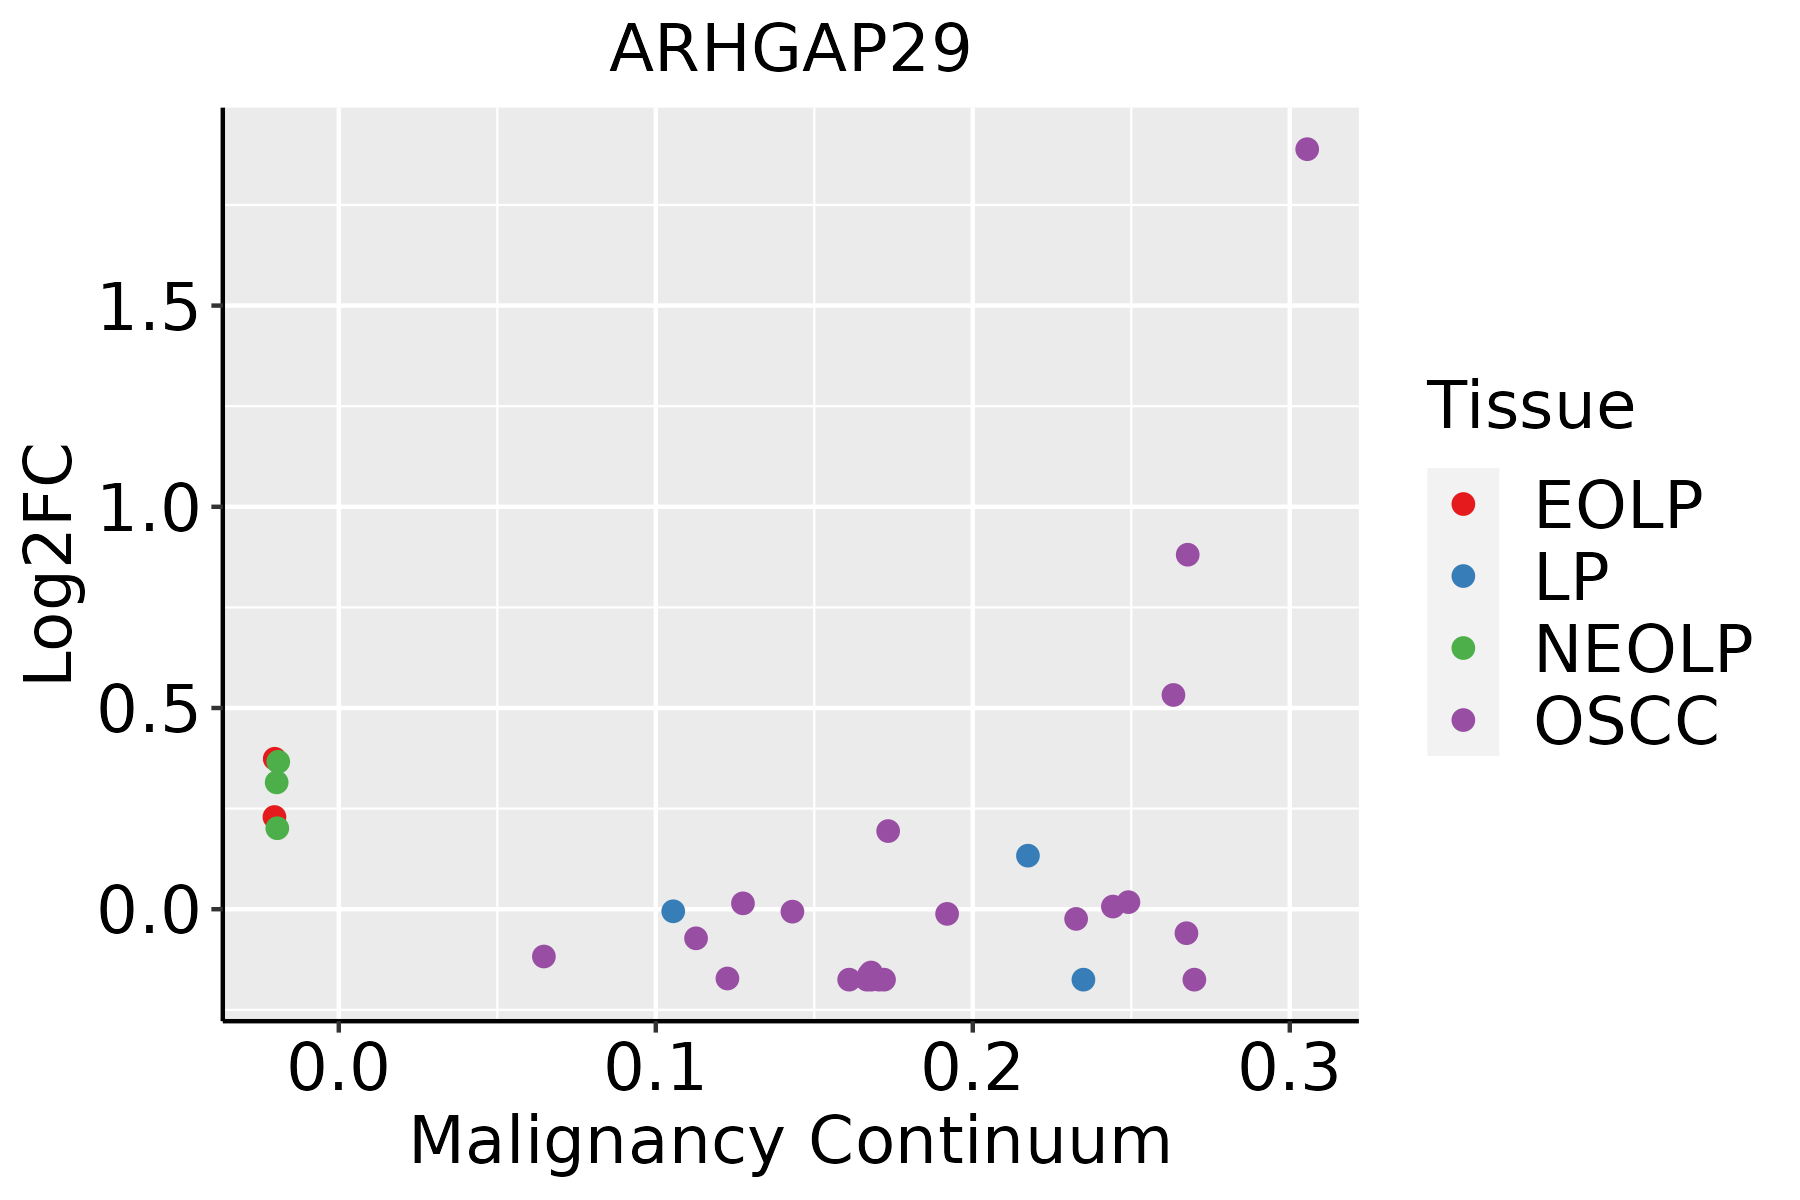 | EOLP: Erosive Oral lichen planus |
| LP: leukoplakia | ||
| NEOLP: Non-erosive oral lichen planus | ||
| OSCC: Oral squamous cell carcinoma | ||
| Prostate |  | BPH: Benign Prostatic Hyperplasia |
| Skin |  | AK: Actinic keratosis |
| cSCC: Cutaneous squamous cell carcinoma | ||
| SCCIS:squamous cell carcinoma in situ | ||
| Thyroid | 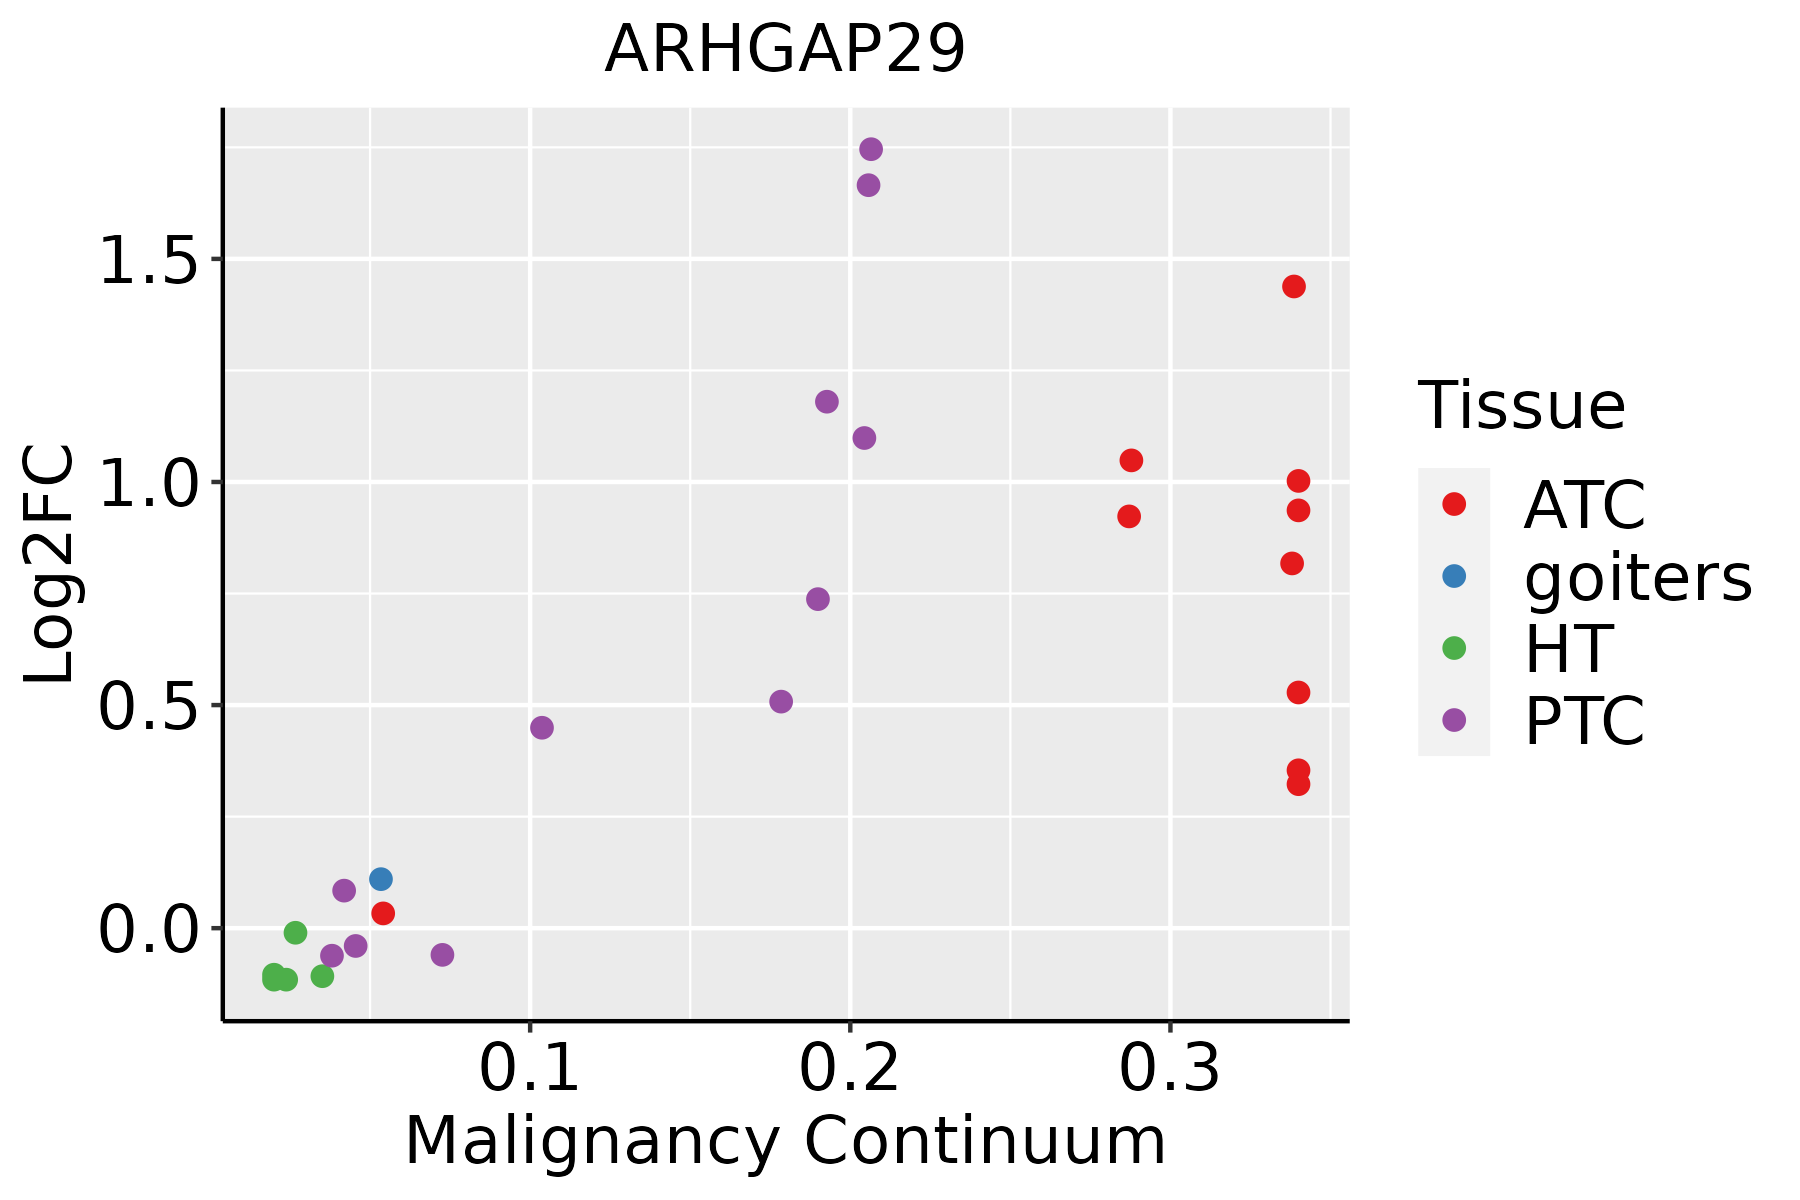 | ATC: Anaplastic thyroid cancer |
| HT: Hashimoto's thyroiditis | ||
| PTC: Papillary thyroid cancer |
| ∗log2FC in expression of this searched gene in stem-like cells from each diseased tissue sample relative to stem-like cells in normal samples in each tissue plotted against the malignancy continuum. Samples are colored based on if they are from different disease stage. |
Top |
Malignant transformation related pathway analysis |
| Find out the enriched GO biological processes and KEGG pathways involved in transition from healthy to precancer to cancer |
| Tissue | Disease Stage | Enriched GO biological Processes |
| Colorectum | AD |  |
| Colorectum | SER |  |
| Colorectum | MSS |  |
| Colorectum | MSI-H |  |
| Colorectum | FAP |  |
| ∗Top 15 enriched GO BP terms are showed in the bar plot of each disease state in each tissue. Each row represents a significant GO biological process which is colored according to the -log10(p.adjust). |
| Page: 1 2 3 4 5 6 7 8 9 |
| GO ID | Tissue | Disease Stage | Description | Gene Ratio | Bg Ratio | pvalue | p.adjust | Count |
| GO:000726510 | Esophagus | ESCC | Ras protein signal transduction | 201/8552 | 337/18723 | 1.44e-07 | 2.30e-06 | 201 |
| GO:000726610 | Esophagus | ESCC | Rho protein signal transduction | 81/8552 | 137/18723 | 1.03e-03 | 5.20e-03 | 81 |
| GO:004308715 | Esophagus | ESCC | regulation of GTPase activity | 183/8552 | 348/18723 | 5.34e-03 | 2.00e-02 | 183 |
| GO:005105610 | Esophagus | ESCC | regulation of small GTPase mediated signal transduction | 157/8552 | 302/18723 | 1.55e-02 | 4.98e-02 | 157 |
| GO:000726511 | Liver | Cirrhotic | Ras protein signal transduction | 119/4634 | 337/18723 | 8.16e-06 | 1.22e-04 | 119 |
| GO:000726611 | Liver | Cirrhotic | Rho protein signal transduction | 53/4634 | 137/18723 | 2.05e-04 | 1.89e-03 | 53 |
| GO:000726521 | Liver | HCC | Ras protein signal transduction | 187/7958 | 337/18723 | 8.89e-07 | 1.35e-05 | 187 |
| GO:000726621 | Liver | HCC | Rho protein signal transduction | 76/7958 | 137/18723 | 1.46e-03 | 7.75e-03 | 76 |
| GO:00510565 | Lung | IAC | regulation of small GTPase mediated signal transduction | 70/2061 | 302/18723 | 9.44e-10 | 1.87e-07 | 70 |
| GO:00430876 | Lung | IAC | regulation of GTPase activity | 67/2061 | 348/18723 | 3.43e-06 | 1.44e-04 | 67 |
| GO:00072655 | Lung | IAC | Ras protein signal transduction | 65/2061 | 337/18723 | 4.48e-06 | 1.81e-04 | 65 |
| GO:00072665 | Lung | IAC | Rho protein signal transduction | 32/2061 | 137/18723 | 2.75e-05 | 7.26e-04 | 32 |
| GO:00435475 | Lung | IAC | positive regulation of GTPase activity | 48/2061 | 255/18723 | 1.40e-04 | 2.60e-03 | 48 |
| GO:00906303 | Lung | IAC | activation of GTPase activity | 22/2061 | 115/18723 | 6.80e-03 | 4.73e-02 | 22 |
| GO:005105611 | Lung | AIS | regulation of small GTPase mediated signal transduction | 66/1849 | 302/18723 | 4.26e-10 | 9.53e-08 | 66 |
| GO:004308711 | Lung | AIS | regulation of GTPase activity | 65/1849 | 348/18723 | 3.35e-07 | 2.83e-05 | 65 |
| GO:000726512 | Lung | AIS | Ras protein signal transduction | 60/1849 | 337/18723 | 4.68e-06 | 2.31e-04 | 60 |
| GO:000726612 | Lung | AIS | Rho protein signal transduction | 28/1849 | 137/18723 | 1.51e-04 | 3.22e-03 | 28 |
| GO:004354711 | Lung | AIS | positive regulation of GTPase activity | 44/1849 | 255/18723 | 1.74e-04 | 3.64e-03 | 44 |
| GO:009063011 | Lung | AIS | activation of GTPase activity | 21/1849 | 115/18723 | 4.07e-03 | 3.65e-02 | 21 |
| Page: 1 2 3 |
| Pathway ID | Tissue | Disease Stage | Description | Gene Ratio | Bg Ratio | pvalue | p.adjust | qvalue | Count |
| hsa0452018 | Breast | Precancer | Adherens junction | 17/684 | 93/8465 | 1.11e-03 | 7.57e-03 | 5.80e-03 | 17 |
| hsa0452019 | Breast | Precancer | Adherens junction | 17/684 | 93/8465 | 1.11e-03 | 7.57e-03 | 5.80e-03 | 17 |
| hsa0452030 | Esophagus | ESCC | Adherens junction | 69/4205 | 93/8465 | 1.08e-06 | 6.83e-06 | 3.50e-06 | 69 |
| hsa04520114 | Esophagus | ESCC | Adherens junction | 69/4205 | 93/8465 | 1.08e-06 | 6.83e-06 | 3.50e-06 | 69 |
| hsa0452022 | Liver | Cirrhotic | Adherens junction | 52/2530 | 93/8465 | 1.36e-07 | 1.97e-06 | 1.21e-06 | 52 |
| hsa0452032 | Liver | Cirrhotic | Adherens junction | 52/2530 | 93/8465 | 1.36e-07 | 1.97e-06 | 1.21e-06 | 52 |
| hsa0452042 | Liver | HCC | Adherens junction | 68/4020 | 93/8465 | 3.99e-07 | 4.46e-06 | 2.48e-06 | 68 |
| hsa0452052 | Liver | HCC | Adherens junction | 68/4020 | 93/8465 | 3.99e-07 | 4.46e-06 | 2.48e-06 | 68 |
| hsa0452016 | Lung | IAC | Adherens junction | 37/1053 | 93/8465 | 1.99e-11 | 2.16e-09 | 1.43e-09 | 37 |
| hsa0452017 | Lung | IAC | Adherens junction | 37/1053 | 93/8465 | 1.99e-11 | 2.16e-09 | 1.43e-09 | 37 |
| hsa0452023 | Lung | AIS | Adherens junction | 34/961 | 93/8465 | 1.59e-10 | 1.29e-08 | 8.26e-09 | 34 |
| hsa0452033 | Lung | AIS | Adherens junction | 34/961 | 93/8465 | 1.59e-10 | 1.29e-08 | 8.26e-09 | 34 |
| hsa0452029 | Oral cavity | OSCC | Adherens junction | 62/3704 | 93/8465 | 6.34e-06 | 3.12e-05 | 1.59e-05 | 62 |
| hsa04520113 | Oral cavity | OSCC | Adherens junction | 62/3704 | 93/8465 | 6.34e-06 | 3.12e-05 | 1.59e-05 | 62 |
| hsa04520210 | Oral cavity | EOLP | Adherens junction | 31/1218 | 93/8465 | 2.94e-06 | 2.16e-05 | 1.28e-05 | 31 |
| hsa0452037 | Oral cavity | EOLP | Adherens junction | 31/1218 | 93/8465 | 2.94e-06 | 2.16e-05 | 1.28e-05 | 31 |
| hsa0452044 | Oral cavity | NEOLP | Adherens junction | 33/1112 | 93/8465 | 3.02e-08 | 5.34e-07 | 3.36e-07 | 33 |
| hsa0452054 | Oral cavity | NEOLP | Adherens junction | 33/1112 | 93/8465 | 3.02e-08 | 5.34e-07 | 3.36e-07 | 33 |
| hsa0452027 | Prostate | BPH | Adherens junction | 55/1718 | 93/8465 | 1.90e-16 | 4.18e-15 | 2.59e-15 | 55 |
| hsa04520112 | Prostate | BPH | Adherens junction | 55/1718 | 93/8465 | 1.90e-16 | 4.18e-15 | 2.59e-15 | 55 |
| Page: 1 2 |
Top |
Cell-cell communication analysis |
| Identification of potential cell-cell interactions between two cell types and their ligand-receptor pairs for different disease states |
| Ligand | Receptor | LRpair | Pathway | Tissue | Disease Stage |
| Page: 1 |
Top |
Single-cell gene regulatory network inference analysis |
| Find out the significant the regulons (TFs) and the target genes of each regulon across cell types for different disease states |
| TF | Cell Type | Tissue | Disease Stage | Target Gene | RSS | Regulon Activity |
| ∗The dot plots of a searched regulon are shown for all cell subpopulations in each disease state of each tissue based on the regulon specific score inferred using pySCENIC and by calculating the average expression. |
| Page: 1 |
Top |
Somatic mutation of malignant transformation related genes |
| Annotation of somatic variants for genes involved in malignant transformation |
| Hugo Symbol | Variant Class | Variant Classification | dbSNP RS | HGVSc | HGVSp | HGVSp Short | SWISSPROT | BIOTYPE | SIFT | PolyPhen | Tumor Sample Barcode | Tissue | Histology | Sex | Age | Stage | Therapy Types | Drugs | Outcome |
| ARHGAP29 | SNV | Missense_Mutation | rs753990016 | c.3652N>A | p.Gln1218Lys | p.Q1218K | Q52LW3 | protein_coding | tolerated_low_confidence(0.06) | benign(0.014) | TCGA-A2-A0CS-01 | Breast | breast invasive carcinoma | Female | >=65 | III/IV | Hormone Therapy | anastrozole | SD |
| ARHGAP29 | SNV | Missense_Mutation | rs757039419 | c.2617N>T | p.Arg873Cys | p.R873C | Q52LW3 | protein_coding | deleterious(0.02) | benign(0.304) | TCGA-A8-A09A-01 | Breast | breast invasive carcinoma | Female | <65 | I/II | Hormone Therapy | tamoxiphen | SD |
| ARHGAP29 | SNV | Missense_Mutation | c.2611C>G | p.Gln871Glu | p.Q871E | Q52LW3 | protein_coding | deleterious(0) | probably_damaging(0.998) | TCGA-AC-A23H-01 | Breast | breast invasive carcinoma | Female | >=65 | I/II | Unknown | Unknown | PD | |
| ARHGAP29 | SNV | Missense_Mutation | c.1741G>A | p.Asp581Asn | p.D581N | Q52LW3 | protein_coding | deleterious(0) | probably_damaging(0.986) | TCGA-AC-A2B8-01 | Breast | breast invasive carcinoma | Female | >=65 | I/II | Chemotherapy | chemo | PD | |
| ARHGAP29 | SNV | Missense_Mutation | novel | c.2599G>C | p.Glu867Gln | p.E867Q | Q52LW3 | protein_coding | deleterious(0.01) | benign(0.254) | TCGA-AC-A3W6-01 | Breast | breast invasive carcinoma | Female | >=65 | III/IV | Unknown | Unknown | SD |
| ARHGAP29 | SNV | Missense_Mutation | novel | c.3178G>T | p.Asp1060Tyr | p.D1060Y | Q52LW3 | protein_coding | deleterious(0.01) | possibly_damaging(0.854) | TCGA-AN-A046-01 | Breast | breast invasive carcinoma | Female | >=65 | I/II | Unknown | Unknown | SD |
| ARHGAP29 | SNV | Missense_Mutation | novel | c.2273G>A | p.Arg758Gln | p.R758Q | Q52LW3 | protein_coding | deleterious(0.02) | probably_damaging(0.997) | TCGA-AN-A046-01 | Breast | breast invasive carcinoma | Female | >=65 | I/II | Unknown | Unknown | SD |
| ARHGAP29 | SNV | Missense_Mutation | rs757995655 | c.1004G>A | p.Arg335His | p.R335H | Q52LW3 | protein_coding | deleterious(0.02) | probably_damaging(0.939) | TCGA-AN-A046-01 | Breast | breast invasive carcinoma | Female | >=65 | I/II | Unknown | Unknown | SD |
| ARHGAP29 | SNV | Missense_Mutation | c.1503N>C | p.Glu501Asp | p.E501D | Q52LW3 | protein_coding | tolerated(0.6) | benign(0.007) | TCGA-AN-A0FL-01 | Breast | breast invasive carcinoma | Female | <65 | I/II | Unknown | Unknown | SD | |
| ARHGAP29 | SNV | Missense_Mutation | c.3676N>T | p.Asp1226Tyr | p.D1226Y | Q52LW3 | protein_coding | deleterious_low_confidence(0.01) | benign(0) | TCGA-AR-A0TS-01 | Breast | breast invasive carcinoma | Female | <65 | I/II | Chemotherapy | doxorubicin | SD |
| Page: 1 2 3 4 5 6 7 8 9 10 11 12 13 |
Top |
Related drugs of malignant transformation related genes |
| Identification of chemicals and drugs interact with genes involved in malignant transfromation |
| (DGIdb 4.0) |
| Entrez ID | Symbol | Category | Interaction Types | Drug Claim Name | Drug Name | PMIDs |
| Page: 1 |

Copyright 2023-Present -The University of Texas Health Science Center at Houston |