
|
|||||
|
 | |
| |
| |
| |
| |
| |
|
Gene: ARHGAP27 |
Gene summary for ARHGAP27 |
| Gene information | Species | Human | Gene symbol | ARHGAP27 | Gene ID | 201176 |
| Gene name | Rho GTPase activating protein 27 | |
| Gene Alias | CAMGAP1 | |
| Cytomap | 17q21.31 | |
| Gene Type | protein-coding | GO ID | GO:0006810 | UniProtAcc | Q6ZUM4 |
Top |
Malignant transformation analysis |
| Identification of the aberrant gene expression in precancerous and cancerous lesions by comparing the gene expression of stem-like cells in diseased tissues with normal stem cells |
| Entrez ID | Symbol | Replicates | Species | Organ | Tissue | Adj P-value | Log2FC | Malignancy |
| 201176 | ARHGAP27 | HTA11_3410_2000001011 | Human | Colorectum | AD | 2.37e-02 | -2.46e-01 | 0.0155 |
| 201176 | ARHGAP27 | HTA11_2487_2000001011 | Human | Colorectum | SER | 4.84e-05 | 5.07e-01 | -0.1808 |
| 201176 | ARHGAP27 | HTA11_347_2000001011 | Human | Colorectum | AD | 1.64e-04 | 3.37e-01 | -0.1954 |
| 201176 | ARHGAP27 | HTA11_1391_2000001011 | Human | Colorectum | AD | 2.19e-02 | 4.41e-01 | -0.059 |
| 201176 | ARHGAP27 | A002-C-010 | Human | Colorectum | FAP | 2.34e-03 | -1.85e-01 | 0.242 |
| 201176 | ARHGAP27 | A015-C-203 | Human | Colorectum | FAP | 1.24e-14 | -1.27e-01 | -0.1294 |
| 201176 | ARHGAP27 | A002-C-201 | Human | Colorectum | FAP | 2.78e-03 | -1.25e-01 | 0.0324 |
| 201176 | ARHGAP27 | A001-C-119 | Human | Colorectum | FAP | 2.43e-05 | -3.53e-01 | -0.1557 |
| 201176 | ARHGAP27 | A001-C-108 | Human | Colorectum | FAP | 4.72e-08 | -1.63e-01 | -0.0272 |
| 201176 | ARHGAP27 | A002-C-205 | Human | Colorectum | FAP | 3.58e-09 | -2.10e-01 | -0.1236 |
| 201176 | ARHGAP27 | A015-C-006 | Human | Colorectum | FAP | 6.13e-06 | -2.81e-01 | -0.0994 |
| 201176 | ARHGAP27 | A015-C-106 | Human | Colorectum | FAP | 1.30e-04 | -1.24e-01 | -0.0511 |
| 201176 | ARHGAP27 | A002-C-114 | Human | Colorectum | FAP | 6.41e-07 | -8.13e-02 | -0.1561 |
| 201176 | ARHGAP27 | A015-C-104 | Human | Colorectum | FAP | 3.54e-16 | -2.66e-01 | -0.1899 |
| 201176 | ARHGAP27 | A001-C-014 | Human | Colorectum | FAP | 3.99e-04 | -1.25e-01 | 0.0135 |
| 201176 | ARHGAP27 | A002-C-016 | Human | Colorectum | FAP | 1.70e-15 | -2.94e-01 | 0.0521 |
| 201176 | ARHGAP27 | A015-C-002 | Human | Colorectum | FAP | 1.16e-02 | -5.99e-02 | -0.0763 |
| 201176 | ARHGAP27 | A001-C-203 | Human | Colorectum | FAP | 4.24e-05 | -5.81e-02 | -0.0481 |
| 201176 | ARHGAP27 | A002-C-116 | Human | Colorectum | FAP | 2.54e-19 | -2.66e-01 | -0.0452 |
| 201176 | ARHGAP27 | A014-C-008 | Human | Colorectum | FAP | 1.11e-05 | -2.59e-01 | -0.191 |
| Page: 1 2 3 |
| Tissue | Expression Dynamics | Abbreviation |
| Colorectum (GSE201348) | 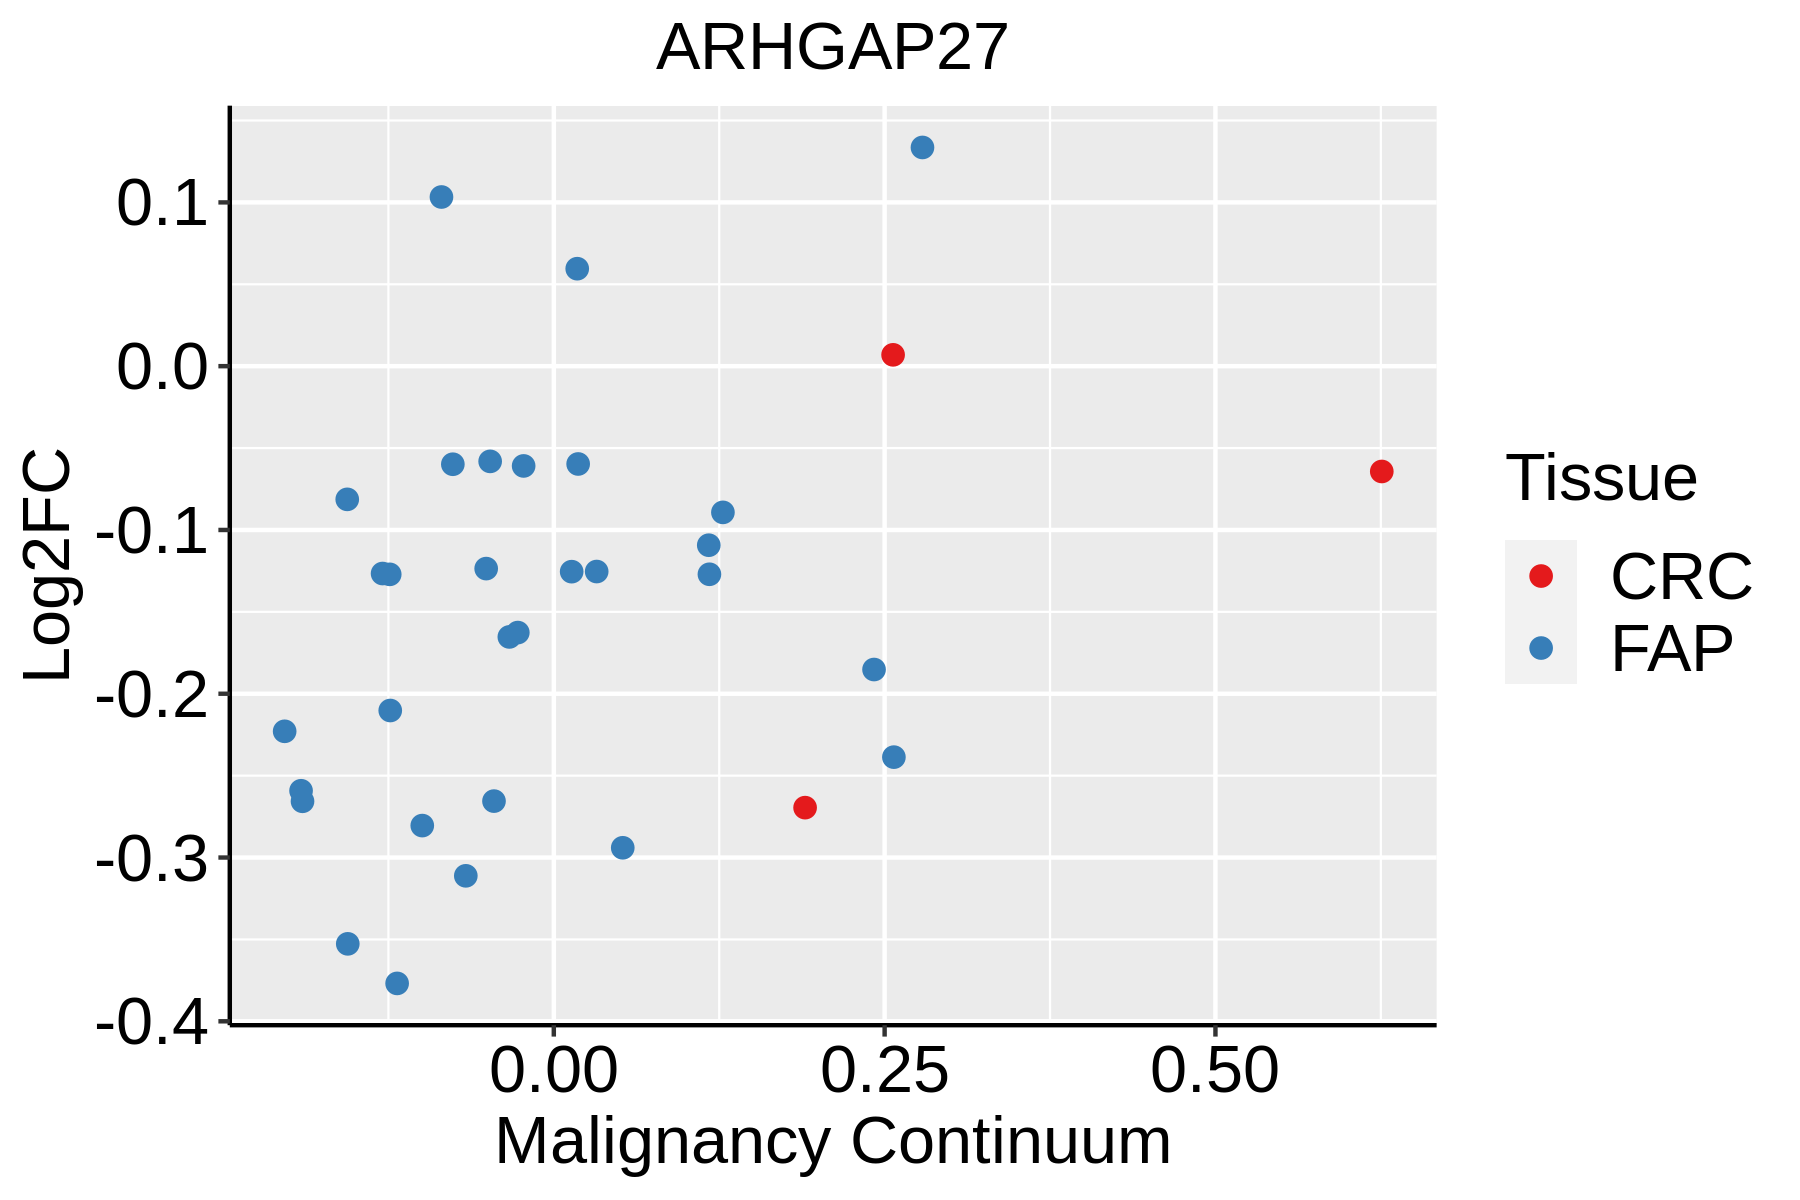 | FAP: Familial adenomatous polyposis |
| CRC: Colorectal cancer | ||
| Colorectum (HTA11) |  | AD: Adenomas |
| SER: Sessile serrated lesions | ||
| MSI-H: Microsatellite-high colorectal cancer | ||
| MSS: Microsatellite stable colorectal cancer | ||
| GC | 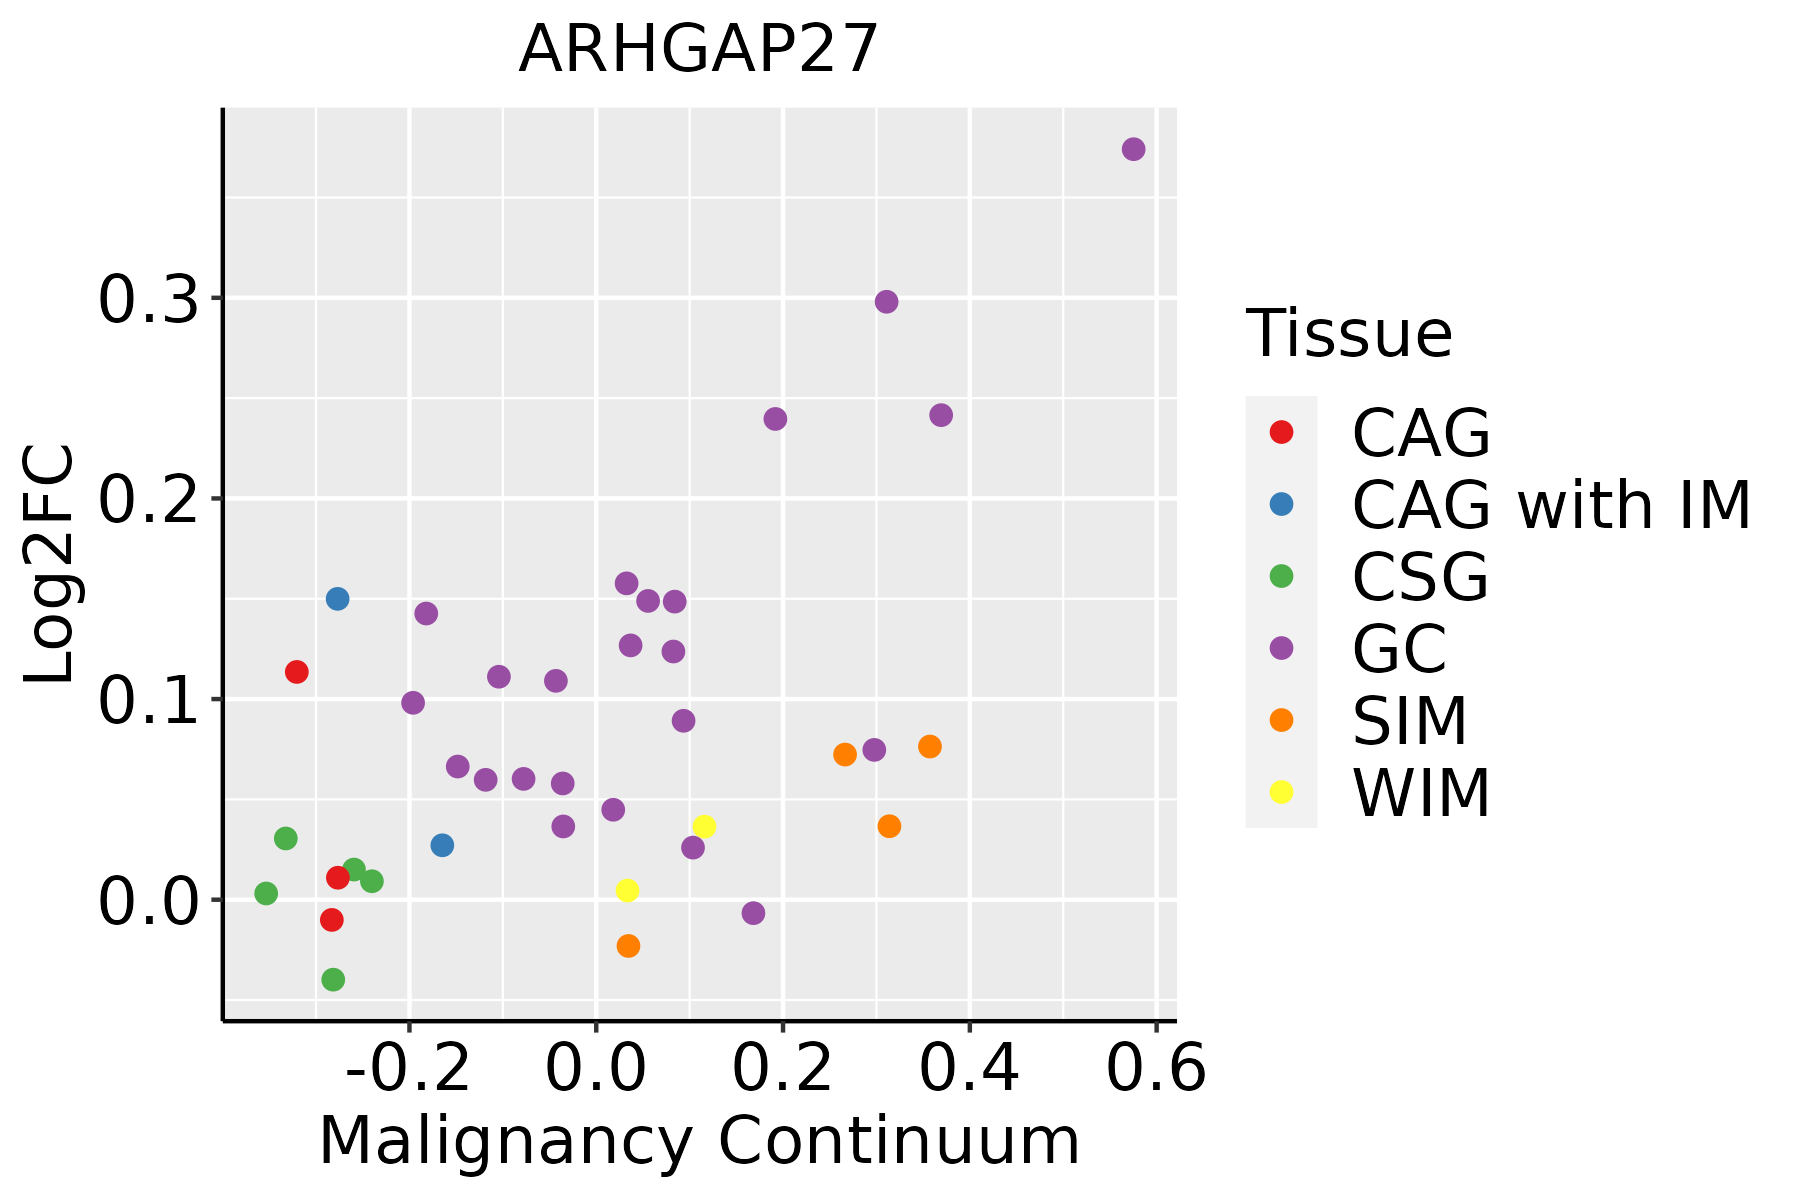 | CAG: Chronic atrophic gastritis |
| CAG with IM: Chronic atrophic gastritis with intestinal metaplasia | ||
| CSG: Chronic superficial gastritis | ||
| GC: Gastric cancer | ||
| SIM: Severe intestinal metaplasia | ||
| WIM: Wild intestinal metaplasia | ||
| Oral Cavity |  | EOLP: Erosive Oral lichen planus |
| LP: leukoplakia | ||
| NEOLP: Non-erosive oral lichen planus | ||
| OSCC: Oral squamous cell carcinoma |
| ∗log2FC in expression of this searched gene in stem-like cells from each diseased tissue sample relative to stem-like cells in normal samples in each tissue plotted against the malignancy continuum. Samples are colored based on if they are from different disease stage. |
Top |
Malignant transformation related pathway analysis |
| Find out the enriched GO biological processes and KEGG pathways involved in transition from healthy to precancer to cancer |
| Tissue | Disease Stage | Enriched GO biological Processes |
| Colorectum | AD |  |
| Colorectum | SER |  |
| Colorectum | MSS |  |
| Colorectum | MSI-H |  |
| Colorectum | FAP |  |
| ∗Top 15 enriched GO BP terms are showed in the bar plot of each disease state in each tissue. Each row represents a significant GO biological process which is colored according to the -log10(p.adjust). |
| Page: 1 2 3 4 5 6 7 8 9 |
| GO ID | Tissue | Disease Stage | Description | Gene Ratio | Bg Ratio | pvalue | p.adjust | Count |
| GO:0043087 | Colorectum | AD | regulation of GTPase activity | 110/3918 | 348/18723 | 1.64e-06 | 5.03e-05 | 110 |
| GO:0051056 | Colorectum | AD | regulation of small GTPase mediated signal transduction | 94/3918 | 302/18723 | 1.81e-05 | 3.76e-04 | 94 |
| GO:0006898 | Colorectum | AD | receptor-mediated endocytosis | 76/3918 | 244/18723 | 1.07e-04 | 1.59e-03 | 76 |
| GO:0043547 | Colorectum | AD | positive regulation of GTPase activity | 75/3918 | 255/18723 | 7.95e-04 | 7.91e-03 | 75 |
| GO:00430871 | Colorectum | SER | regulation of GTPase activity | 77/2897 | 348/18723 | 5.90e-04 | 8.07e-03 | 77 |
| GO:00510562 | Colorectum | FAP | regulation of small GTPase mediated signal transduction | 78/2622 | 302/18723 | 3.25e-08 | 2.85e-06 | 78 |
| GO:00430873 | Colorectum | FAP | regulation of GTPase activity | 85/2622 | 348/18723 | 1.20e-07 | 7.68e-06 | 85 |
| GO:00068982 | Colorectum | FAP | receptor-mediated endocytosis | 62/2622 | 244/18723 | 1.47e-06 | 6.39e-05 | 62 |
| GO:00435472 | Colorectum | FAP | positive regulation of GTPase activity | 61/2622 | 255/18723 | 1.39e-05 | 3.73e-04 | 61 |
| GO:000689810 | Oral cavity | OSCC | receptor-mediated endocytosis | 125/7305 | 244/18723 | 6.56e-05 | 5.32e-04 | 125 |
| GO:004308710 | Oral cavity | OSCC | regulation of GTPase activity | 165/7305 | 348/18723 | 7.94e-04 | 4.27e-03 | 165 |
| Page: 1 |
| Pathway ID | Tissue | Disease Stage | Description | Gene Ratio | Bg Ratio | pvalue | p.adjust | qvalue | Count |
| Page: 1 |
Top |
Cell-cell communication analysis |
| Identification of potential cell-cell interactions between two cell types and their ligand-receptor pairs for different disease states |
| Ligand | Receptor | LRpair | Pathway | Tissue | Disease Stage |
| Page: 1 |
Top |
Single-cell gene regulatory network inference analysis |
| Find out the significant the regulons (TFs) and the target genes of each regulon across cell types for different disease states |
| TF | Cell Type | Tissue | Disease Stage | Target Gene | RSS | Regulon Activity |
| ∗The dot plots of a searched regulon are shown for all cell subpopulations in each disease state of each tissue based on the regulon specific score inferred using pySCENIC and by calculating the average expression. |
| Page: 1 |
Top |
Somatic mutation of malignant transformation related genes |
| Annotation of somatic variants for genes involved in malignant transformation |
| Hugo Symbol | Variant Class | Variant Classification | dbSNP RS | HGVSc | HGVSp | HGVSp Short | SWISSPROT | BIOTYPE | SIFT | PolyPhen | Tumor Sample Barcode | Tissue | Histology | Sex | Age | Stage | Therapy Types | Drugs | Outcome |
| ARHGAP27 | SNV | Missense_Mutation | novel | c.2356T>C | p.Ser786Pro | p.S786P | Q6ZUM4 | protein_coding | deleterious(0) | possibly_damaging(0.843) | TCGA-BH-A0RX-01 | Breast | breast invasive carcinoma | Female | <65 | I/II | Chemotherapy | fluorouracil | SD |
| ARHGAP27 | SNV | Missense_Mutation | novel | c.1494C>A | p.Asp498Glu | p.D498E | Q6ZUM4 | protein_coding | tolerated(0.97) | probably_damaging(0.989) | TCGA-BH-A5IZ-01 | Breast | breast invasive carcinoma | Female | <65 | I/II | Chemotherapy | adriamycin | CR |
| ARHGAP27 | deletion | Frame_Shift_Del | novel | c.1496delN | p.Lys499ArgfsTer34 | p.K499Rfs*34 | Q6ZUM4 | protein_coding | TCGA-D8-A27V-01 | Breast | breast invasive carcinoma | Female | <65 | I/II | Hormone Therapy | tamoxiphen | SD | ||
| ARHGAP27 | insertion | Frame_Shift_Ins | novel | c.2212_2213insC | p.Leu738ProfsTer10 | p.L738Pfs*10 | Q6ZUM4 | protein_coding | TCGA-LL-A6FP-01 | Breast | breast invasive carcinoma | Female | >=65 | I/II | Hormone Therapy | arimidex | SD | ||
| ARHGAP27 | SNV | Missense_Mutation | c.2110G>C | p.Glu704Gln | p.E704Q | Q6ZUM4 | protein_coding | tolerated(0.09) | benign(0.111) | TCGA-LP-A4AV-01 | Cervix | cervical & endocervical cancer | Female | <65 | I/II | Unknown | Unknown | SD | |
| ARHGAP27 | SNV | Missense_Mutation | c.127G>A | p.Glu43Lys | p.E43K | Q6ZUM4 | protein_coding | tolerated(0.06) | probably_damaging(0.972) | TCGA-LP-A4AV-01 | Cervix | cervical & endocervical cancer | Female | <65 | I/II | Unknown | Unknown | SD | |
| ARHGAP27 | SNV | Missense_Mutation | c.1352G>A | p.Ser451Asn | p.S451N | Q6ZUM4 | protein_coding | tolerated(0.21) | benign(0.011) | TCGA-AA-3715-01 | Colorectum | colon adenocarcinoma | Male | >=65 | I/II | Unknown | Unknown | PD | |
| ARHGAP27 | SNV | Missense_Mutation | novel | c.2618A>C | p.Gln873Pro | p.Q873P | Q6ZUM4 | protein_coding | deleterious(0) | probably_damaging(0.993) | TCGA-AA-3877-01 | Colorectum | colon adenocarcinoma | Female | >=65 | I/II | Unknown | Unknown | SD |
| ARHGAP27 | SNV | Missense_Mutation | novel | c.1602C>A | p.Phe534Leu | p.F534L | Q6ZUM4 | protein_coding | deleterious(0) | probably_damaging(0.993) | TCGA-AA-A010-01 | Colorectum | colon adenocarcinoma | Female | <65 | I/II | Chemotherapy | folinic | CR |
| ARHGAP27 | SNV | Missense_Mutation | c.2522T>C | p.Met841Thr | p.M841T | Q6ZUM4 | protein_coding | deleterious(0) | probably_damaging(0.981) | TCGA-AA-A01R-01 | Colorectum | colon adenocarcinoma | Male | <65 | III/IV | Chemotherapy | 5-fluorouracil | PD |
| Page: 1 2 3 4 5 6 7 |
Top |
Related drugs of malignant transformation related genes |
| Identification of chemicals and drugs interact with genes involved in malignant transfromation |
| (DGIdb 4.0) |
| Entrez ID | Symbol | Category | Interaction Types | Drug Claim Name | Drug Name | PMIDs |
| Page: 1 |

Copyright 2023-Present -The University of Texas Health Science Center at Houston |