| Tissue | Expression Dynamics | Abbreviation |
| Cervix | 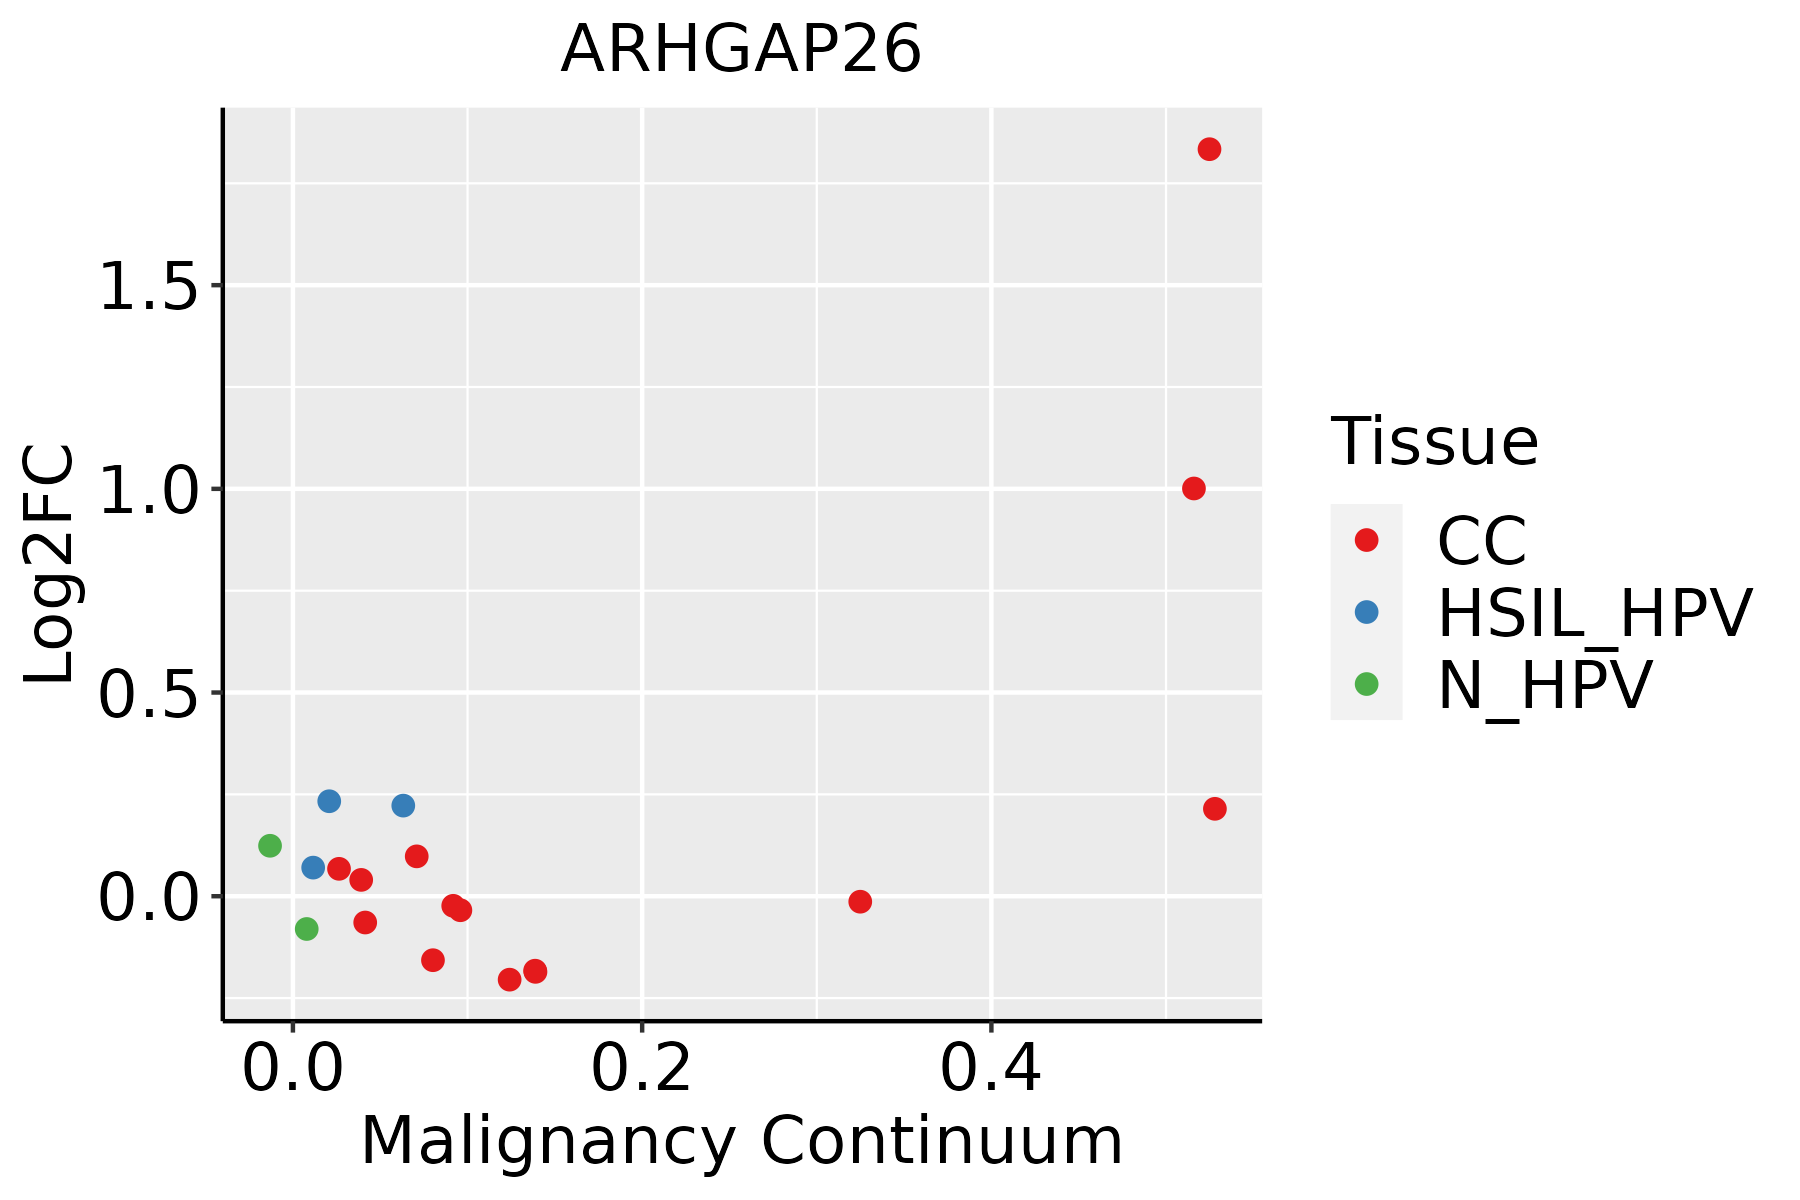 | CC: Cervix cancer |
| HSIL_HPV: HPV-infected high-grade squamous intraepithelial lesions |
| N_HPV: HPV-infected normal cervix |
| Colorectum (GSE201348) |  | FAP: Familial adenomatous polyposis |
| CRC: Colorectal cancer |
| Colorectum (HTA11) |  | AD: Adenomas |
| SER: Sessile serrated lesions |
| MSI-H: Microsatellite-high colorectal cancer |
| MSS: Microsatellite stable colorectal cancer |
| Endometrium | 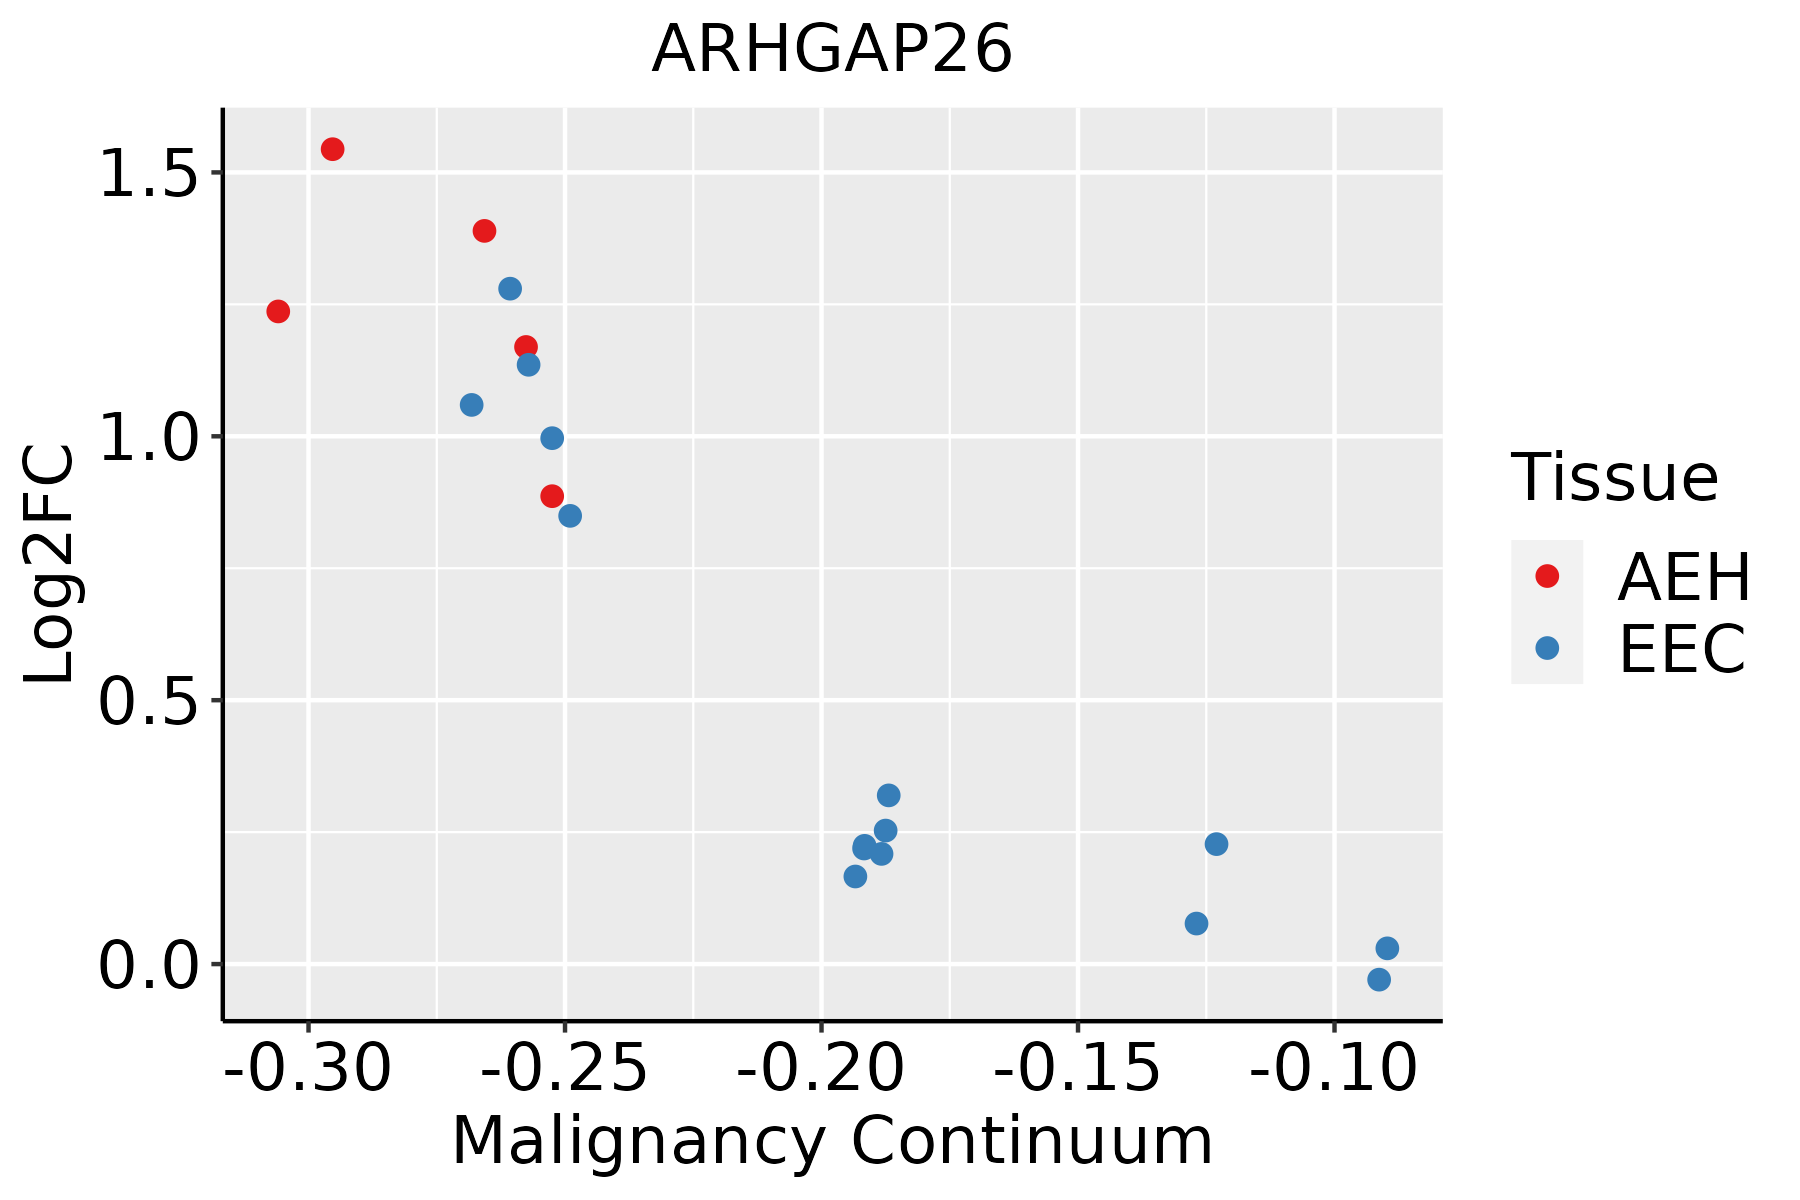 | AEH: Atypical endometrial hyperplasia |
| EEC: Endometrioid Cancer |
| GC | 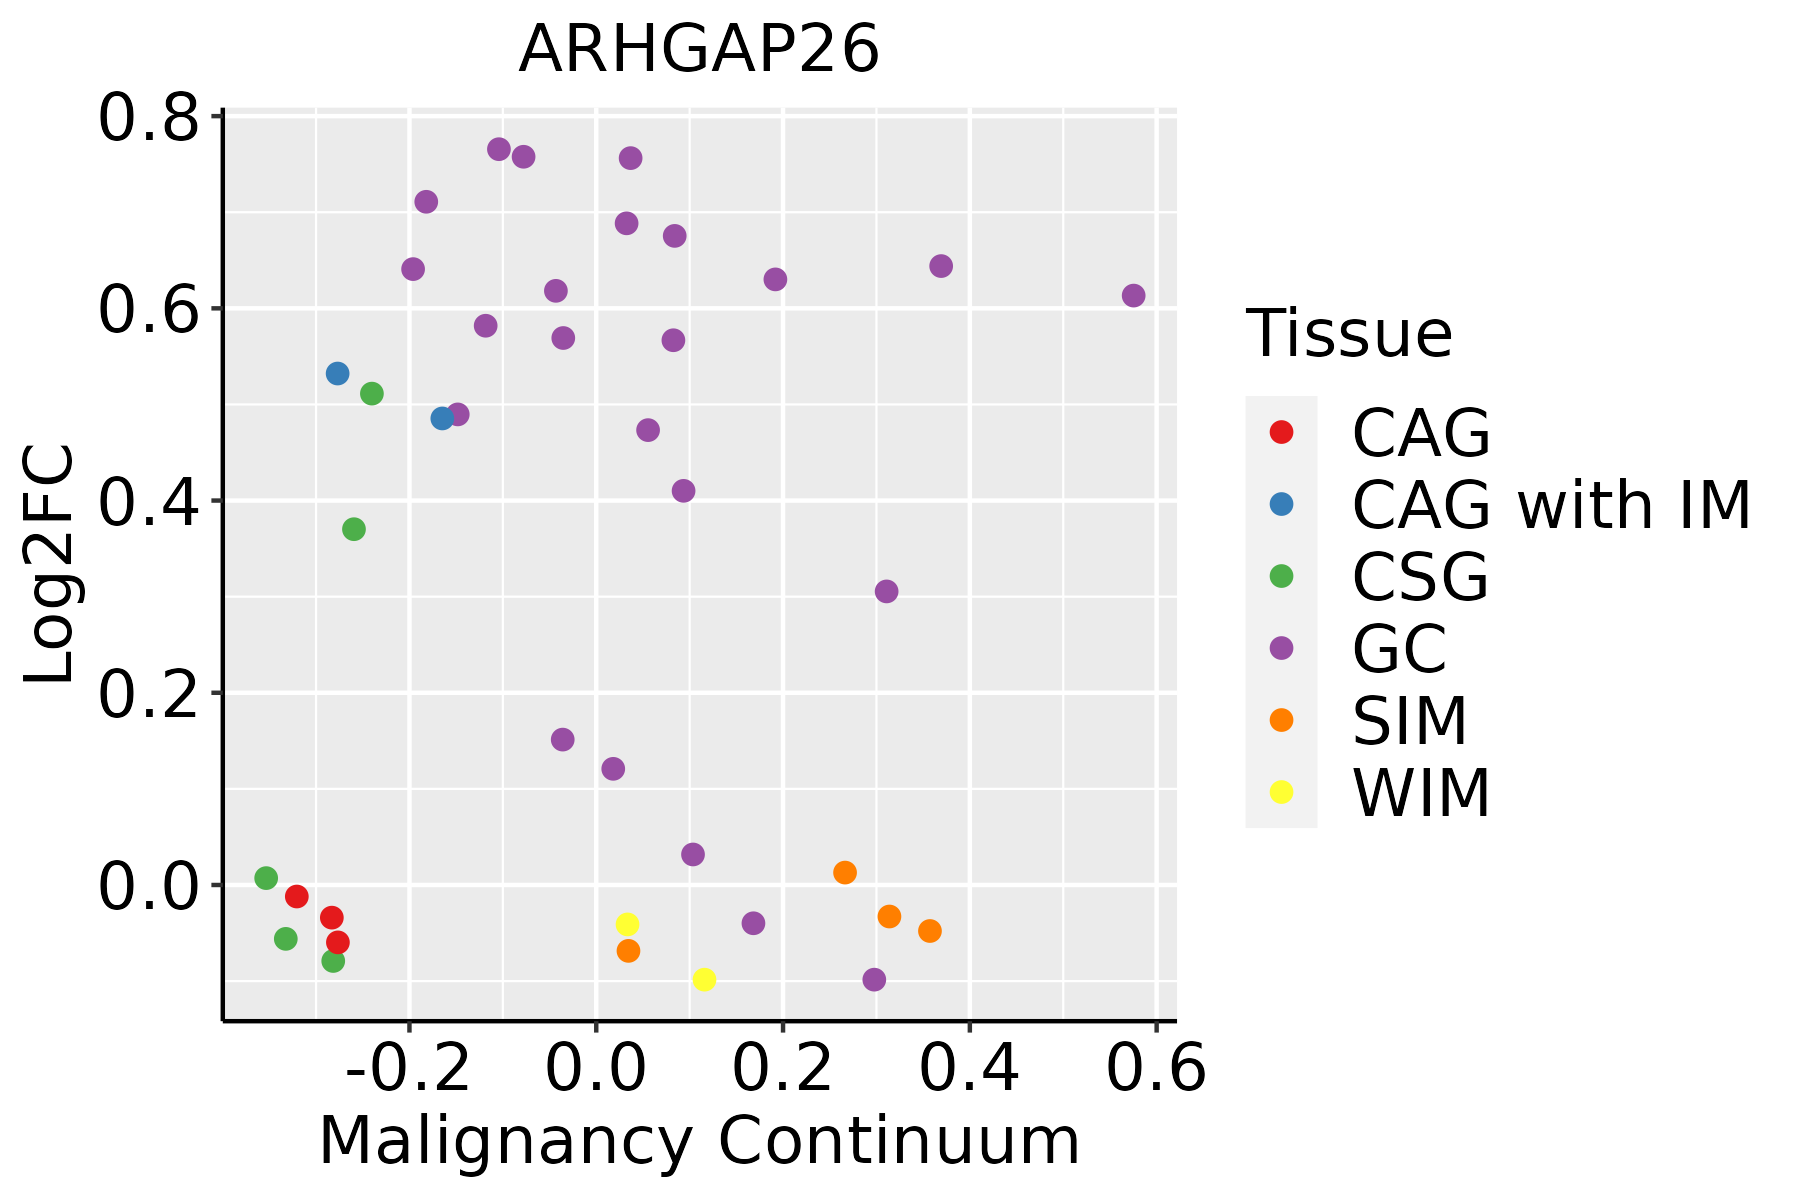 | CAG: Chronic atrophic gastritis |
| CAG with IM: Chronic atrophic gastritis with intestinal metaplasia |
| CSG: Chronic superficial gastritis |
| GC: Gastric cancer |
| SIM: Severe intestinal metaplasia |
| WIM: Wild intestinal metaplasia |
| Liver |  | HCC: Hepatocellular carcinoma |
| NAFLD: Non-alcoholic fatty liver disease |
| Lung | 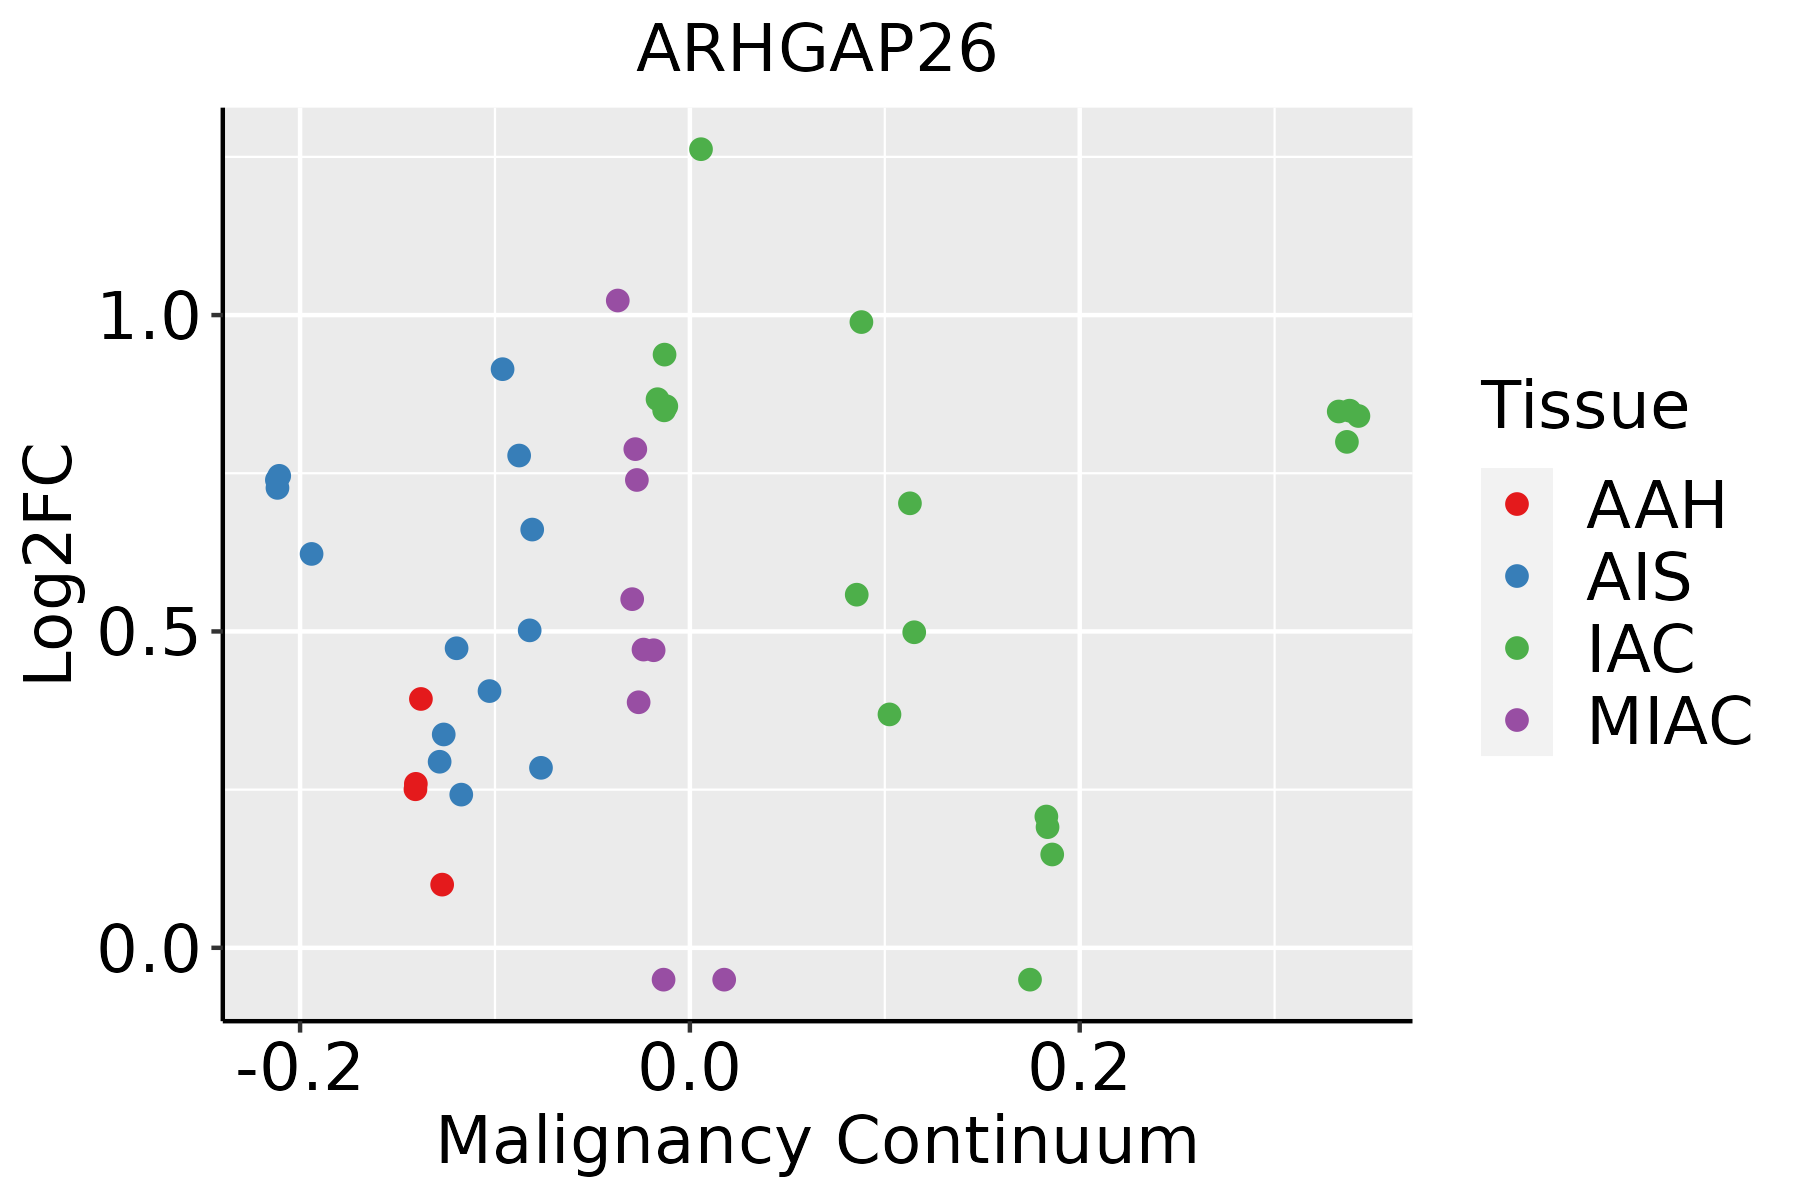 | AAH: Atypical adenomatous hyperplasia |
| AIS: Adenocarcinoma in situ |
| IAC: Invasive lung adenocarcinoma |
| MIA: Minimally invasive adenocarcinoma |
| Oral Cavity | 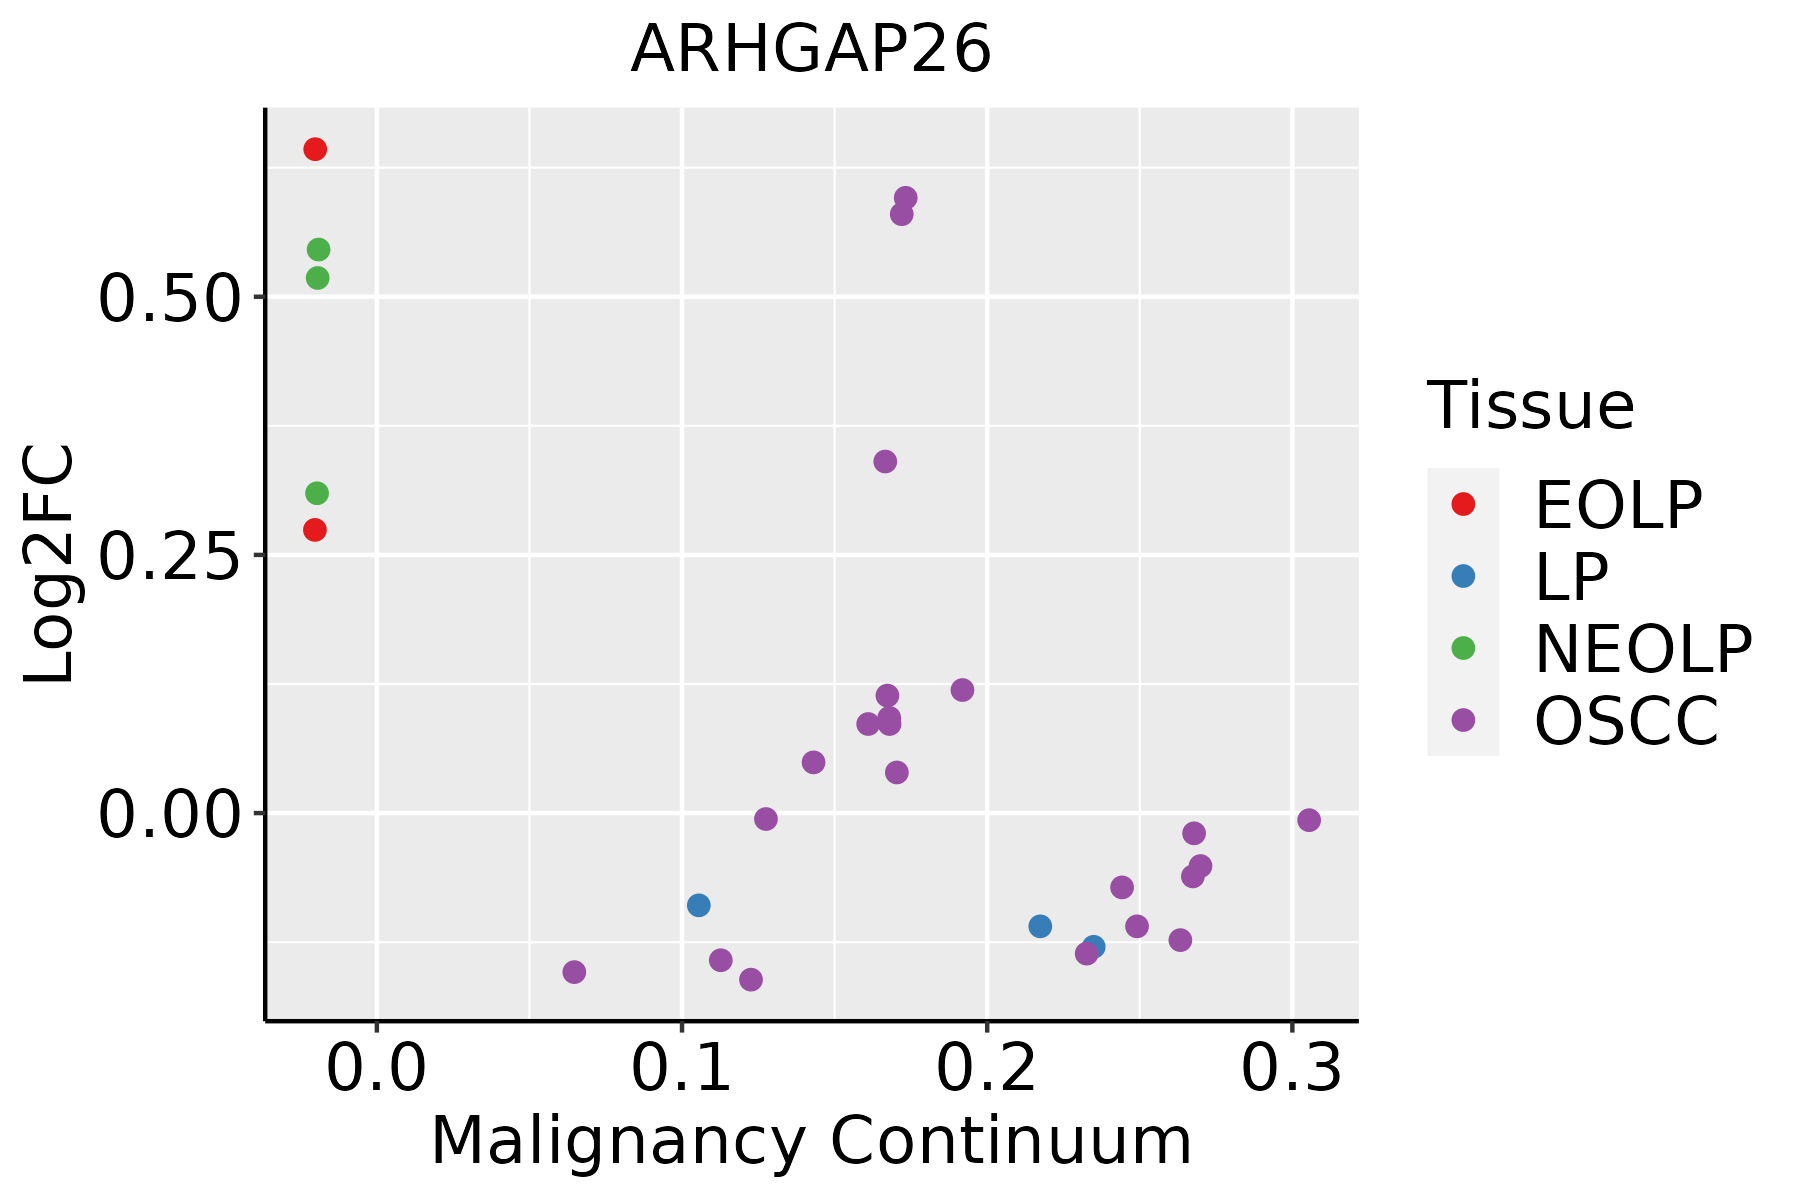 | EOLP: Erosive Oral lichen planus |
| LP: leukoplakia |
| NEOLP: Non-erosive oral lichen planus |
| OSCC: Oral squamous cell carcinoma |
| Prostate | 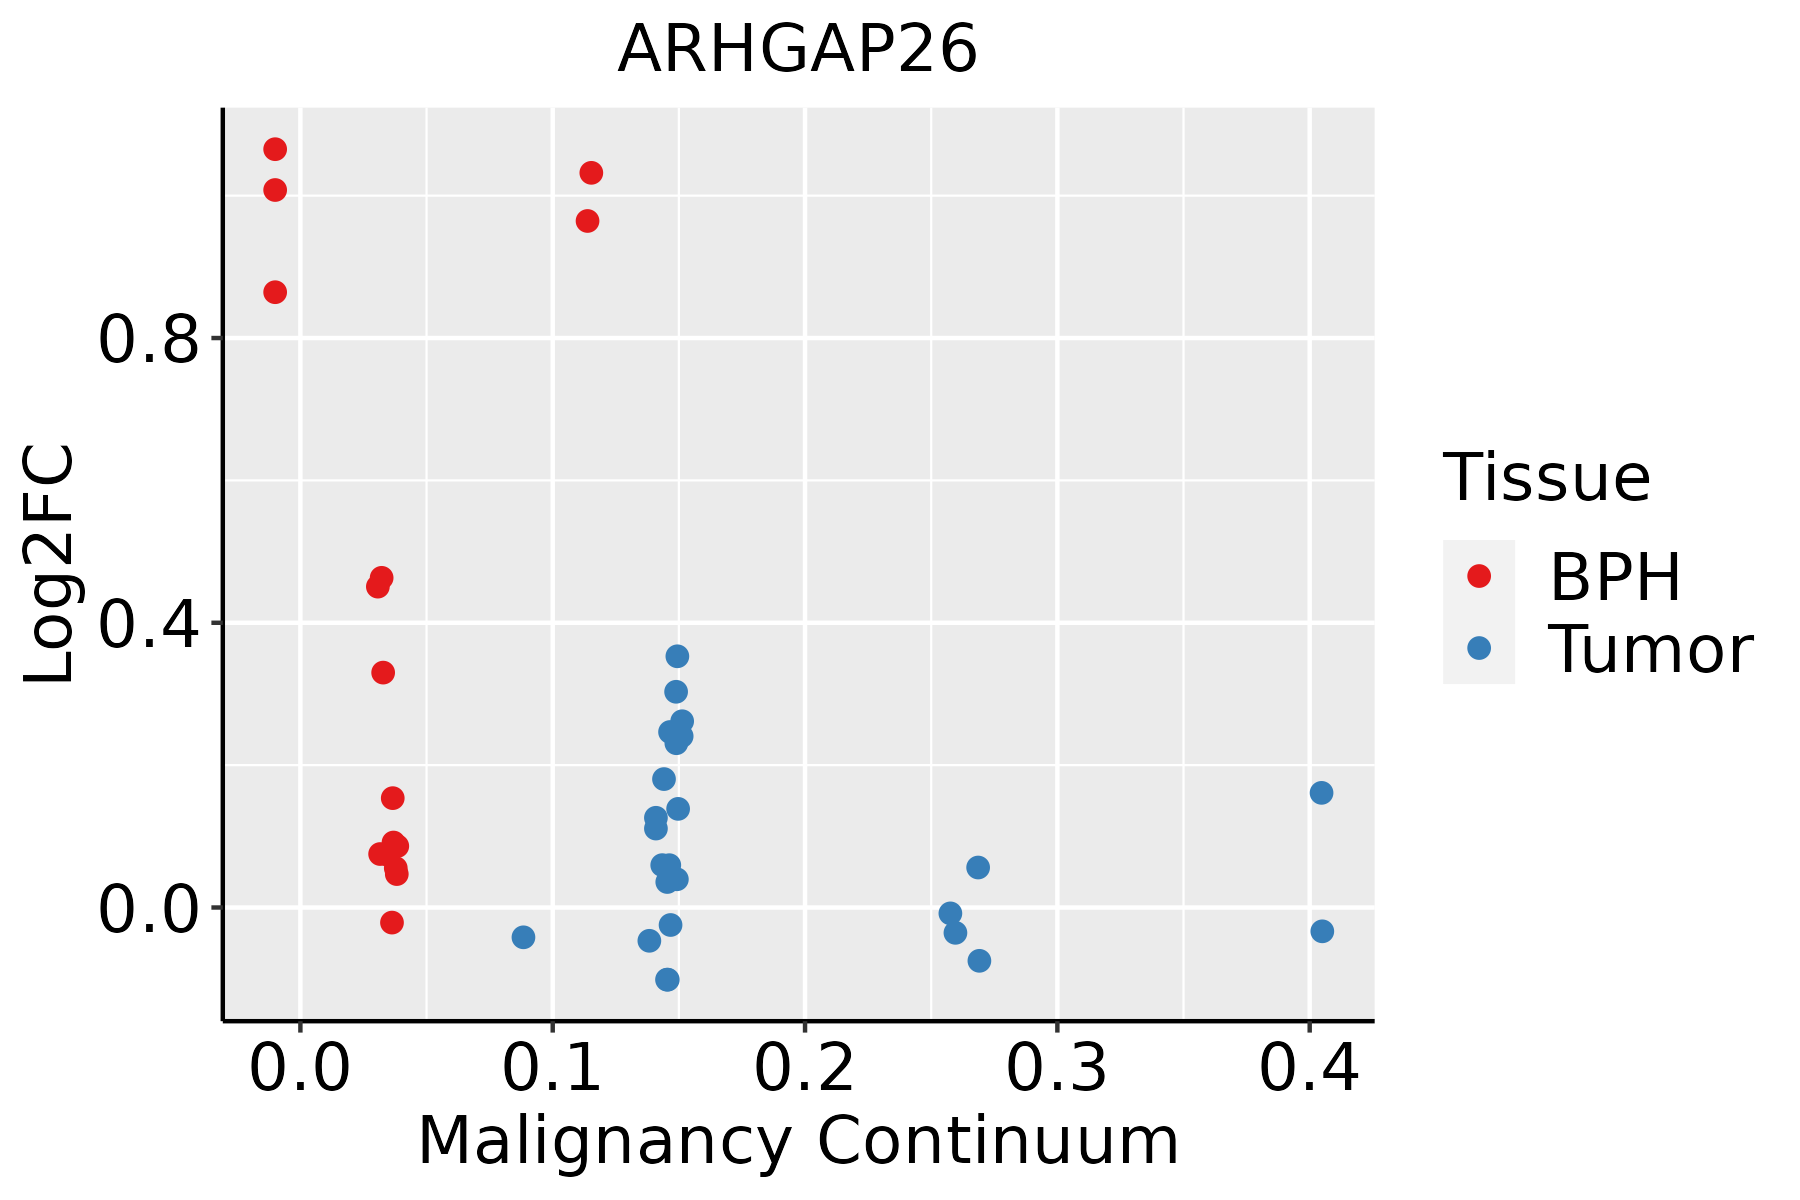 | BPH: Benign Prostatic Hyperplasia |
| GO ID | Tissue | Disease Stage | Description | Gene Ratio | Bg Ratio | pvalue | p.adjust | Count |
| GO:00510566 | Cervix | CC | regulation of small GTPase mediated signal transduction | 75/2311 | 302/18723 | 1.54e-09 | 1.74e-07 | 75 |
| GO:0051056 | Colorectum | AD | regulation of small GTPase mediated signal transduction | 94/3918 | 302/18723 | 1.81e-05 | 3.76e-04 | 94 |
| GO:00510561 | Colorectum | MSS | regulation of small GTPase mediated signal transduction | 82/3467 | 302/18723 | 1.31e-04 | 1.99e-03 | 82 |
| GO:00510562 | Colorectum | FAP | regulation of small GTPase mediated signal transduction | 78/2622 | 302/18723 | 3.25e-08 | 2.85e-06 | 78 |
| GO:00510563 | Colorectum | CRC | regulation of small GTPase mediated signal transduction | 69/2078 | 302/18723 | 3.34e-09 | 9.08e-07 | 69 |
| GO:00510567 | Endometrium | AEH | regulation of small GTPase mediated signal transduction | 59/2100 | 302/18723 | 1.43e-05 | 3.03e-04 | 59 |
| GO:005105612 | Endometrium | EEC | regulation of small GTPase mediated signal transduction | 61/2168 | 302/18723 | 9.42e-06 | 2.08e-04 | 61 |
| GO:00510565 | Lung | IAC | regulation of small GTPase mediated signal transduction | 70/2061 | 302/18723 | 9.44e-10 | 1.87e-07 | 70 |
| GO:005105611 | Lung | AIS | regulation of small GTPase mediated signal transduction | 66/1849 | 302/18723 | 4.26e-10 | 9.53e-08 | 66 |
| GO:005105621 | Lung | MIAC | regulation of small GTPase mediated signal transduction | 35/967 | 302/18723 | 6.81e-06 | 6.35e-04 | 35 |
| GO:00510569 | Oral cavity | EOLP | regulation of small GTPase mediated signal transduction | 51/2218 | 302/18723 | 5.67e-03 | 2.92e-02 | 51 |
| GO:005105614 | Oral cavity | NEOLP | regulation of small GTPase mediated signal transduction | 49/2005 | 302/18723 | 2.04e-03 | 1.36e-02 | 49 |
| GO:00510568 | Prostate | BPH | regulation of small GTPase mediated signal transduction | 78/3107 | 302/18723 | 2.69e-05 | 3.16e-04 | 78 |
| GO:005105613 | Prostate | Tumor | regulation of small GTPase mediated signal transduction | 80/3246 | 302/18723 | 3.96e-05 | 4.57e-04 | 80 |
| Hugo Symbol | Variant Class | Variant Classification | dbSNP RS | HGVSc | HGVSp | HGVSp Short | SWISSPROT | BIOTYPE | SIFT | PolyPhen | Tumor Sample Barcode | Tissue | Histology | Sex | Age | Stage | Therapy Types | Drugs | Outcome |
| ARHGAP26 | SNV | Missense_Mutation | rs148543665 | c.664N>T | p.Gly222Trp | p.G222W | Q9UNA1 | protein_coding | deleterious(0.01) | probably_damaging(0.981) | TCGA-A7-A0DB-01 | Breast | breast invasive carcinoma | Female | <65 | I/II | Hormone Therapy | arimidex | SD |
| ARHGAP26 | SNV | Missense_Mutation | rs369464916 | c.1772C>T | p.Ser591Phe | p.S591F | Q9UNA1 | protein_coding | deleterious(0.02) | probably_damaging(0.986) | TCGA-AC-A2QI-01 | Breast | breast invasive carcinoma | Female | >=65 | III/IV | Chemotherapy | cytoxan | CR |
| ARHGAP26 | SNV | Missense_Mutation | novel | c.1677C>G | p.Ile559Met | p.I559M | Q9UNA1 | protein_coding | deleterious(0) | probably_damaging(0.992) | TCGA-AC-A3W6-01 | Breast | breast invasive carcinoma | Female | >=65 | III/IV | Unknown | Unknown | SD |
| ARHGAP26 | SNV | Missense_Mutation | rs374932134 | c.1693N>A | p.Glu565Lys | p.E565K | Q9UNA1 | protein_coding | tolerated(0.14) | possibly_damaging(0.545) | TCGA-AN-A046-01 | Breast | breast invasive carcinoma | Female | >=65 | I/II | Unknown | Unknown | SD |
| ARHGAP26 | SNV | Missense_Mutation | | c.775G>C | p.Glu259Gln | p.E259Q | Q9UNA1 | protein_coding | tolerated(0.05) | probably_damaging(0.968) | TCGA-AN-A0XW-01 | Breast | breast invasive carcinoma | Female | <65 | III/IV | Unknown | Unknown | SD |
| ARHGAP26 | SNV | Missense_Mutation | | c.149N>C | p.Leu50Pro | p.L50P | Q9UNA1 | protein_coding | deleterious(0.02) | possibly_damaging(0.79) | TCGA-AR-A1AX-01 | Breast | breast invasive carcinoma | Female | <65 | I/II | Chemotherapy | cytoxan | SD |
| ARHGAP26 | SNV | Missense_Mutation | | c.2296G>A | p.Ala766Thr | p.A766T | Q9UNA1 | protein_coding | tolerated(0.05) | probably_damaging(0.994) | TCGA-BH-A18G-01 | Breast | breast invasive carcinoma | Female | >=65 | I/II | Unknown | Unknown | SD |
| ARHGAP26 | SNV | Missense_Mutation | | c.1709N>T | p.Thr570Ile | p.T570I | Q9UNA1 | protein_coding | tolerated(0.19) | benign(0.097) | TCGA-C8-A26Y-01 | Breast | breast invasive carcinoma | Female | >=65 | I/II | Unknown | Unknown | SD |
| ARHGAP26 | SNV | Missense_Mutation | | c.661T>A | p.Phe221Ile | p.F221I | Q9UNA1 | protein_coding | deleterious(0) | probably_damaging(0.93) | TCGA-D8-A1XK-01 | Breast | breast invasive carcinoma | Female | <65 | I/II | Chemotherapy | doxorubicine+cyclophosphamide | SD |
| ARHGAP26 | SNV | Missense_Mutation | novel | c.1921N>G | p.Leu641Val | p.L641V | Q9UNA1 | protein_coding | tolerated(0.35) | benign(0.034) | TCGA-PE-A5DC-01 | Breast | breast invasive carcinoma | Female | >=65 | III/IV | Unknown | Unknown | SD |


