
|
|||||
|
 | |
| |
| |
| |
| |
| |
|
Gene: ARHGAP23 |
Gene summary for ARHGAP23 |
| Gene information | Species | Human | Gene symbol | ARHGAP23 | Gene ID | 57636 |
| Gene name | Rho GTPase activating protein 23 | |
| Gene Alias | ARHGAP23 | |
| Cytomap | 17q12 | |
| Gene Type | protein-coding | GO ID | GO:0007154 | UniProtAcc | Q9P227 |
Top |
Malignant transformation analysis |
| Identification of the aberrant gene expression in precancerous and cancerous lesions by comparing the gene expression of stem-like cells in diseased tissues with normal stem cells |
| Entrez ID | Symbol | Replicates | Species | Organ | Tissue | Adj P-value | Log2FC | Malignancy |
| 57636 | ARHGAP23 | LZE8T | Human | Esophagus | ESCC | 7.37e-03 | 7.14e-02 | 0.067 |
| 57636 | ARHGAP23 | LZE20T | Human | Esophagus | ESCC | 1.10e-05 | 2.03e-01 | 0.0662 |
| 57636 | ARHGAP23 | LZE22T | Human | Esophagus | ESCC | 5.24e-04 | 3.11e-01 | 0.068 |
| 57636 | ARHGAP23 | LZE24T | Human | Esophagus | ESCC | 4.41e-02 | 1.88e-01 | 0.0596 |
| 57636 | ARHGAP23 | P1T-E | Human | Esophagus | ESCC | 9.75e-03 | 4.26e-01 | 0.0875 |
| 57636 | ARHGAP23 | P4T-E | Human | Esophagus | ESCC | 8.22e-03 | 3.41e-02 | 0.1323 |
| 57636 | ARHGAP23 | P5T-E | Human | Esophagus | ESCC | 2.89e-08 | 8.66e-02 | 0.1327 |
| 57636 | ARHGAP23 | P8T-E | Human | Esophagus | ESCC | 4.25e-32 | 5.35e-01 | 0.0889 |
| 57636 | ARHGAP23 | P9T-E | Human | Esophagus | ESCC | 2.03e-04 | 5.97e-02 | 0.1131 |
| 57636 | ARHGAP23 | P10T-E | Human | Esophagus | ESCC | 2.17e-04 | -1.87e-03 | 0.116 |
| 57636 | ARHGAP23 | P11T-E | Human | Esophagus | ESCC | 9.34e-04 | 1.79e-01 | 0.1426 |
| 57636 | ARHGAP23 | P12T-E | Human | Esophagus | ESCC | 6.59e-12 | 2.17e-01 | 0.1122 |
| 57636 | ARHGAP23 | P15T-E | Human | Esophagus | ESCC | 6.46e-10 | 1.81e-01 | 0.1149 |
| 57636 | ARHGAP23 | P16T-E | Human | Esophagus | ESCC | 1.54e-03 | -8.35e-02 | 0.1153 |
| 57636 | ARHGAP23 | P19T-E | Human | Esophagus | ESCC | 3.43e-02 | 2.46e-01 | 0.1662 |
| 57636 | ARHGAP23 | P20T-E | Human | Esophagus | ESCC | 3.98e-02 | 1.72e-02 | 0.1124 |
| 57636 | ARHGAP23 | P21T-E | Human | Esophagus | ESCC | 5.74e-07 | 2.69e-02 | 0.1617 |
| 57636 | ARHGAP23 | P22T-E | Human | Esophagus | ESCC | 3.65e-13 | 7.27e-02 | 0.1236 |
| 57636 | ARHGAP23 | P23T-E | Human | Esophagus | ESCC | 1.56e-04 | 5.62e-02 | 0.108 |
| 57636 | ARHGAP23 | P24T-E | Human | Esophagus | ESCC | 5.22e-10 | -3.03e-03 | 0.1287 |
| Page: 1 2 3 4 |
| Tissue | Expression Dynamics | Abbreviation |
| Esophagus | 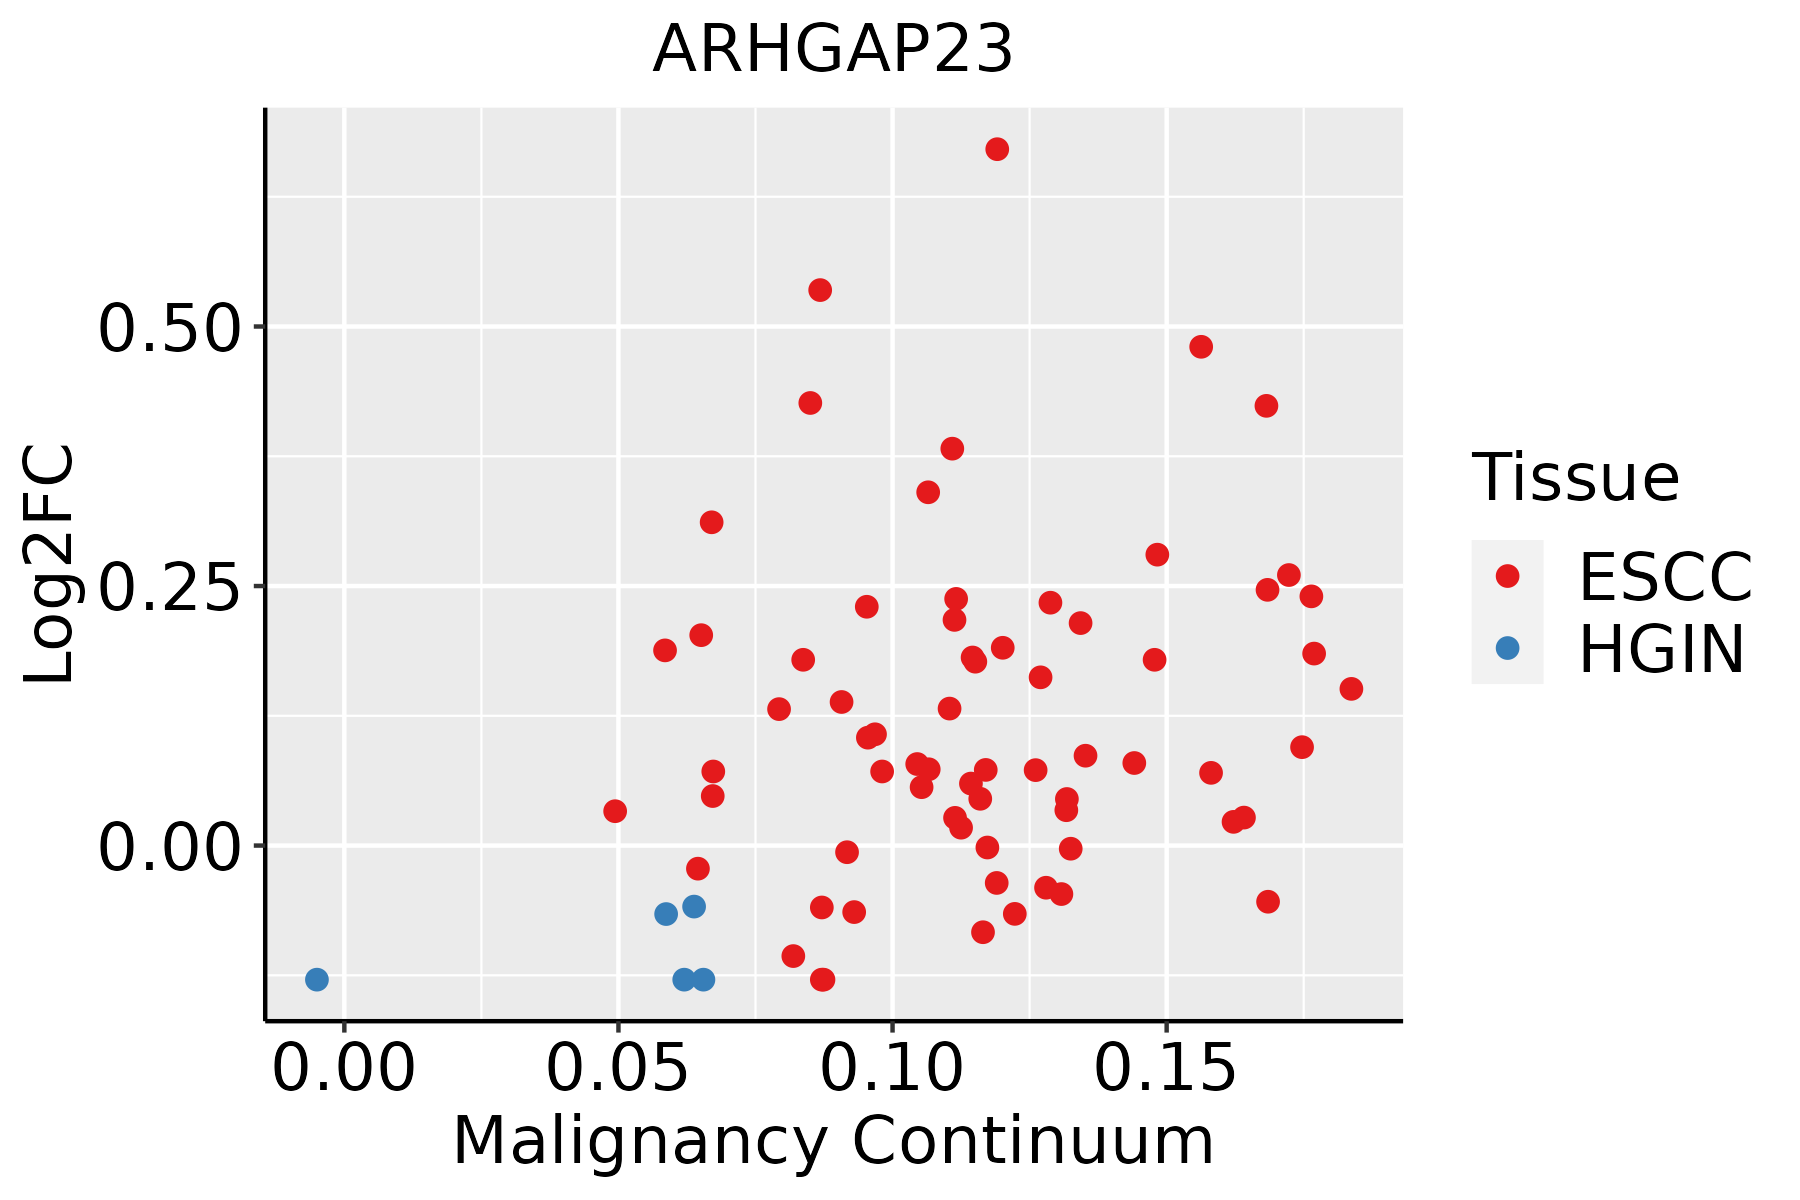 | ESCC: Esophageal squamous cell carcinoma |
| HGIN: High-grade intraepithelial neoplasias | ||
| LGIN: Low-grade intraepithelial neoplasias | ||
| Oral Cavity | 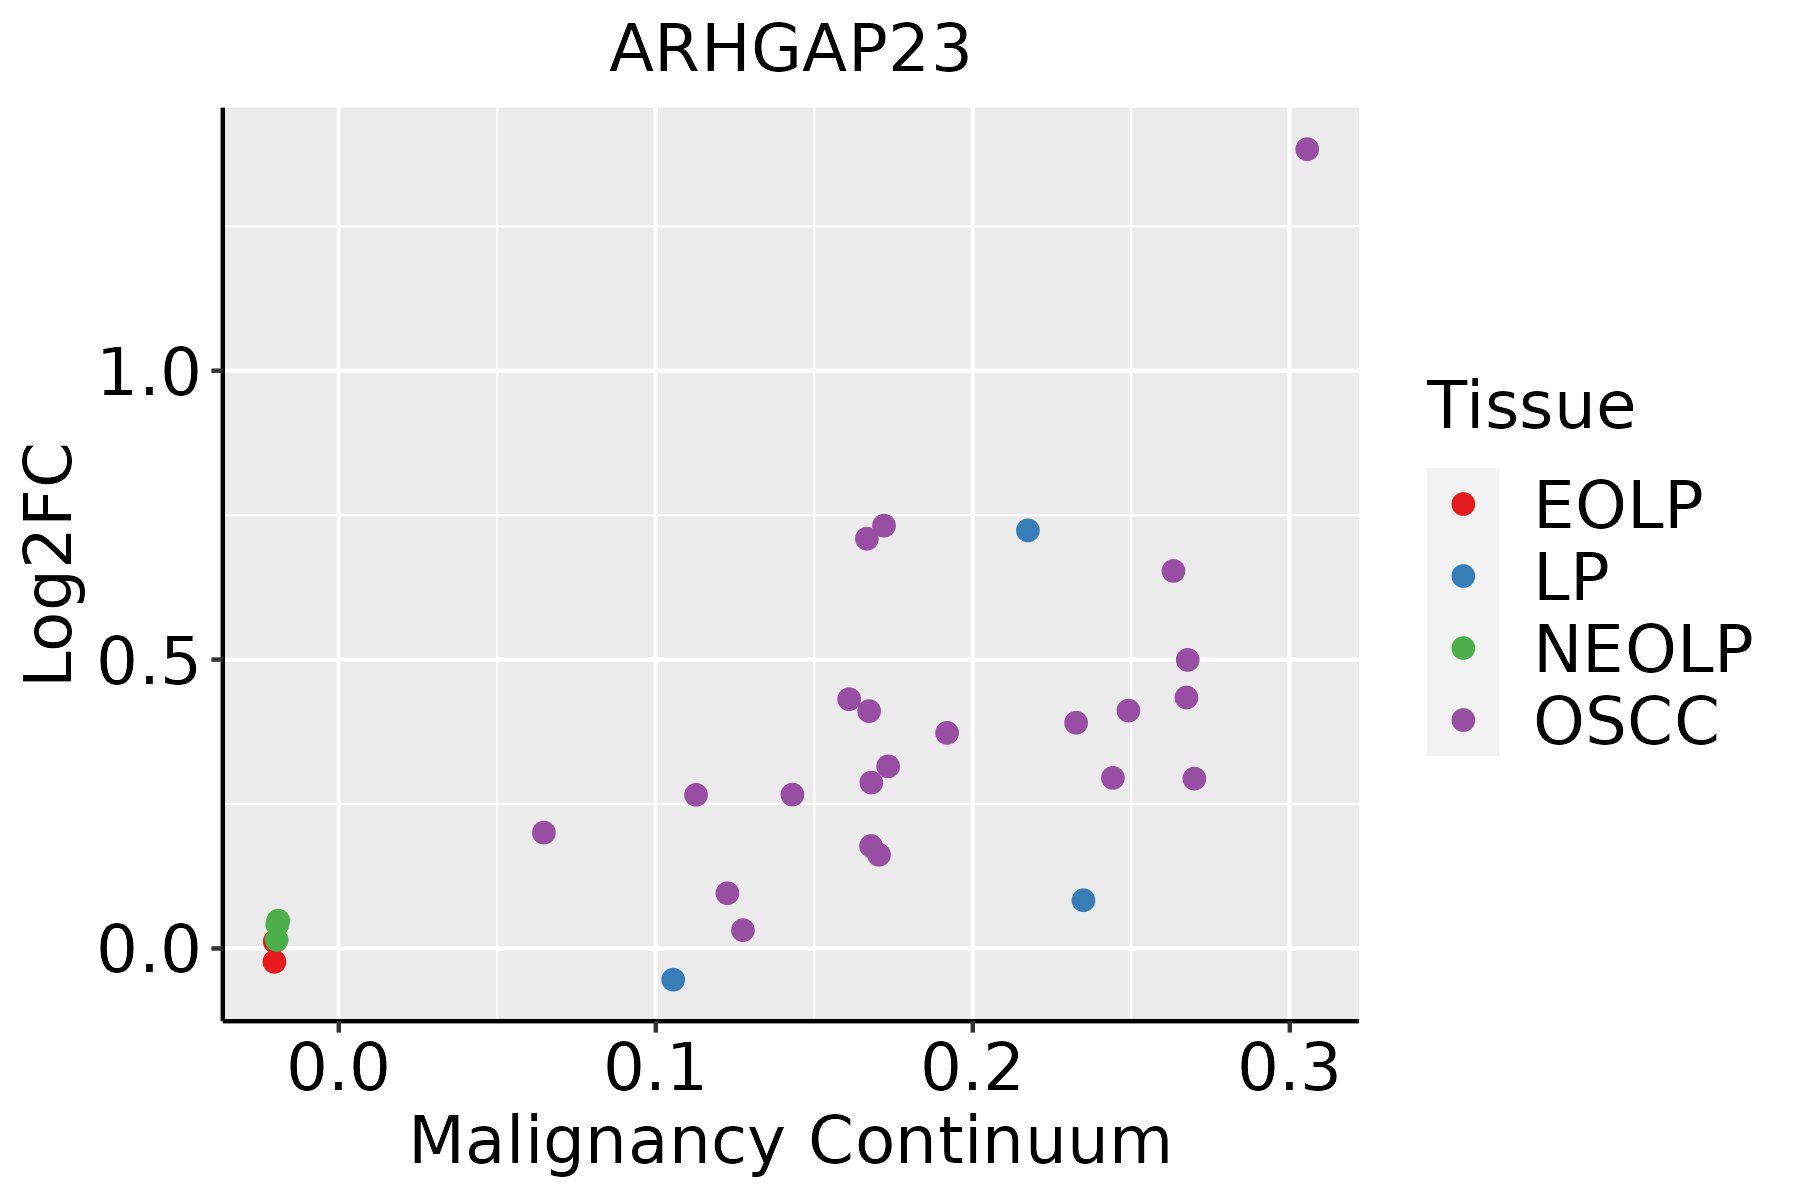 | EOLP: Erosive Oral lichen planus |
| LP: leukoplakia | ||
| NEOLP: Non-erosive oral lichen planus | ||
| OSCC: Oral squamous cell carcinoma |
| ∗log2FC in expression of this searched gene in stem-like cells from each diseased tissue sample relative to stem-like cells in normal samples in each tissue plotted against the malignancy continuum. Samples are colored based on if they are from different disease stage. |
Top |
Malignant transformation related pathway analysis |
| Find out the enriched GO biological processes and KEGG pathways involved in transition from healthy to precancer to cancer |
| Tissue | Disease Stage | Enriched GO biological Processes |
| Colorectum | AD |  |
| Colorectum | SER |  |
| Colorectum | MSS |  |
| Colorectum | MSI-H |  |
| Colorectum | FAP |  |
| ∗Top 15 enriched GO BP terms are showed in the bar plot of each disease state in each tissue. Each row represents a significant GO biological process which is colored according to the -log10(p.adjust). |
| Page: 1 2 3 4 5 6 7 8 9 |
| GO ID | Tissue | Disease Stage | Description | Gene Ratio | Bg Ratio | pvalue | p.adjust | Count |
| GO:005105610 | Esophagus | ESCC | regulation of small GTPase mediated signal transduction | 157/8552 | 302/18723 | 1.55e-02 | 4.98e-02 | 157 |
| Page: 1 |
| Pathway ID | Tissue | Disease Stage | Description | Gene Ratio | Bg Ratio | pvalue | p.adjust | qvalue | Count |
| Page: 1 |
Top |
Cell-cell communication analysis |
| Identification of potential cell-cell interactions between two cell types and their ligand-receptor pairs for different disease states |
| Ligand | Receptor | LRpair | Pathway | Tissue | Disease Stage |
| Page: 1 |
Top |
Single-cell gene regulatory network inference analysis |
| Find out the significant the regulons (TFs) and the target genes of each regulon across cell types for different disease states |
| TF | Cell Type | Tissue | Disease Stage | Target Gene | RSS | Regulon Activity |
| ∗The dot plots of a searched regulon are shown for all cell subpopulations in each disease state of each tissue based on the regulon specific score inferred using pySCENIC and by calculating the average expression. |
| Page: 1 |
Top |
Somatic mutation of malignant transformation related genes |
| Annotation of somatic variants for genes involved in malignant transformation |
| Hugo Symbol | Variant Class | Variant Classification | dbSNP RS | HGVSc | HGVSp | HGVSp Short | SWISSPROT | BIOTYPE | SIFT | PolyPhen | Tumor Sample Barcode | Tissue | Histology | Sex | Age | Stage | Therapy Types | Drugs | Outcome |
| ARHGAP23 | SNV | Missense_Mutation | novel | c.2997C>A | p.Asn999Lys | p.N999K | Q9P227 | protein_coding | deleterious(0.05) | possibly_damaging(0.571) | TCGA-A2-A04Y-01 | Breast | breast invasive carcinoma | Female | <65 | I/II | Chemotherapy | cytoxan | SD |
| ARHGAP23 | SNV | Missense_Mutation | rs866924997 | c.1931G>A | p.Arg644His | p.R644H | Q9P227 | protein_coding | tolerated(0.16) | possibly_damaging(0.893) | TCGA-A2-A0CL-01 | Breast | breast invasive carcinoma | Female | <65 | III/IV | Chemotherapy | cytoxan | SD |
| ARHGAP23 | SNV | Missense_Mutation | novel | c.2461N>G | p.Leu821Val | p.L821V | Q9P227 | protein_coding | deleterious(0) | probably_damaging(0.954) | TCGA-AC-A23H-01 | Breast | breast invasive carcinoma | Female | >=65 | I/II | Unknown | Unknown | PD |
| ARHGAP23 | SNV | Missense_Mutation | rs756612893 | c.362N>G | p.Val121Gly | p.V121G | Q9P227 | protein_coding | deleterious(0) | probably_damaging(0.999) | TCGA-AR-A0TQ-01 | Breast | breast invasive carcinoma | Female | <65 | III/IV | Chemotherapy | doxorubicin | SD |
| ARHGAP23 | SNV | Missense_Mutation | rs756612893 | c.362N>G | p.Val121Gly | p.V121G | Q9P227 | protein_coding | deleterious(0) | probably_damaging(0.999) | TCGA-B6-A1KF-01 | Breast | breast invasive carcinoma | Female | >=65 | I/II | Unknown | Unknown | SD |
| ARHGAP23 | SNV | Missense_Mutation | novel | c.1600N>T | p.Ala534Ser | p.A534S | Q9P227 | protein_coding | tolerated(0.36) | benign(0.068) | TCGA-BH-A0BW-01 | Breast | breast invasive carcinoma | Female | >=65 | I/II | Chemotherapy | adriamycin | CR |
| ARHGAP23 | SNV | Missense_Mutation | rs754221101 | c.368N>G | p.Val123Gly | p.V123G | Q9P227 | protein_coding | deleterious(0) | probably_damaging(1) | TCGA-C8-A12W-01 | Breast | breast invasive carcinoma | Female | <65 | III/IV | Unknown | Unknown | SD |
| ARHGAP23 | SNV | Missense_Mutation | rs756612893 | c.362N>G | p.Val121Gly | p.V121G | Q9P227 | protein_coding | deleterious(0) | probably_damaging(0.999) | TCGA-E9-A1NF-01 | Breast | breast invasive carcinoma | Female | <65 | I/II | Chemotherapy | doxorubicin | PD |
| ARHGAP23 | SNV | Missense_Mutation | novel | c.2161N>A | p.Ala721Thr | p.A721T | Q9P227 | protein_coding | deleterious(0.04) | benign(0.244) | TCGA-S3-AA14-01 | Breast | breast invasive carcinoma | Female | <65 | I/II | Chemotherapy | adriamycin | CR |
| ARHGAP23 | SNV | Missense_Mutation | novel | c.475N>A | p.Leu159Ile | p.L159I | Q9P227 | protein_coding | deleterious(0) | probably_damaging(0.991) | TCGA-2W-A8YY-01 | Cervix | cervical & endocervical cancer | Female | <65 | I/II | Chemotherapy | cisplatin | CR |
| Page: 1 2 3 4 5 6 7 8 |
Top |
Related drugs of malignant transformation related genes |
| Identification of chemicals and drugs interact with genes involved in malignant transfromation |
| (DGIdb 4.0) |
| Entrez ID | Symbol | Category | Interaction Types | Drug Claim Name | Drug Name | PMIDs |
| Page: 1 |

Copyright 2023-Present -The University of Texas Health Science Center at Houston |