| Tissue | Expression Dynamics | Abbreviation |
| Cervix | 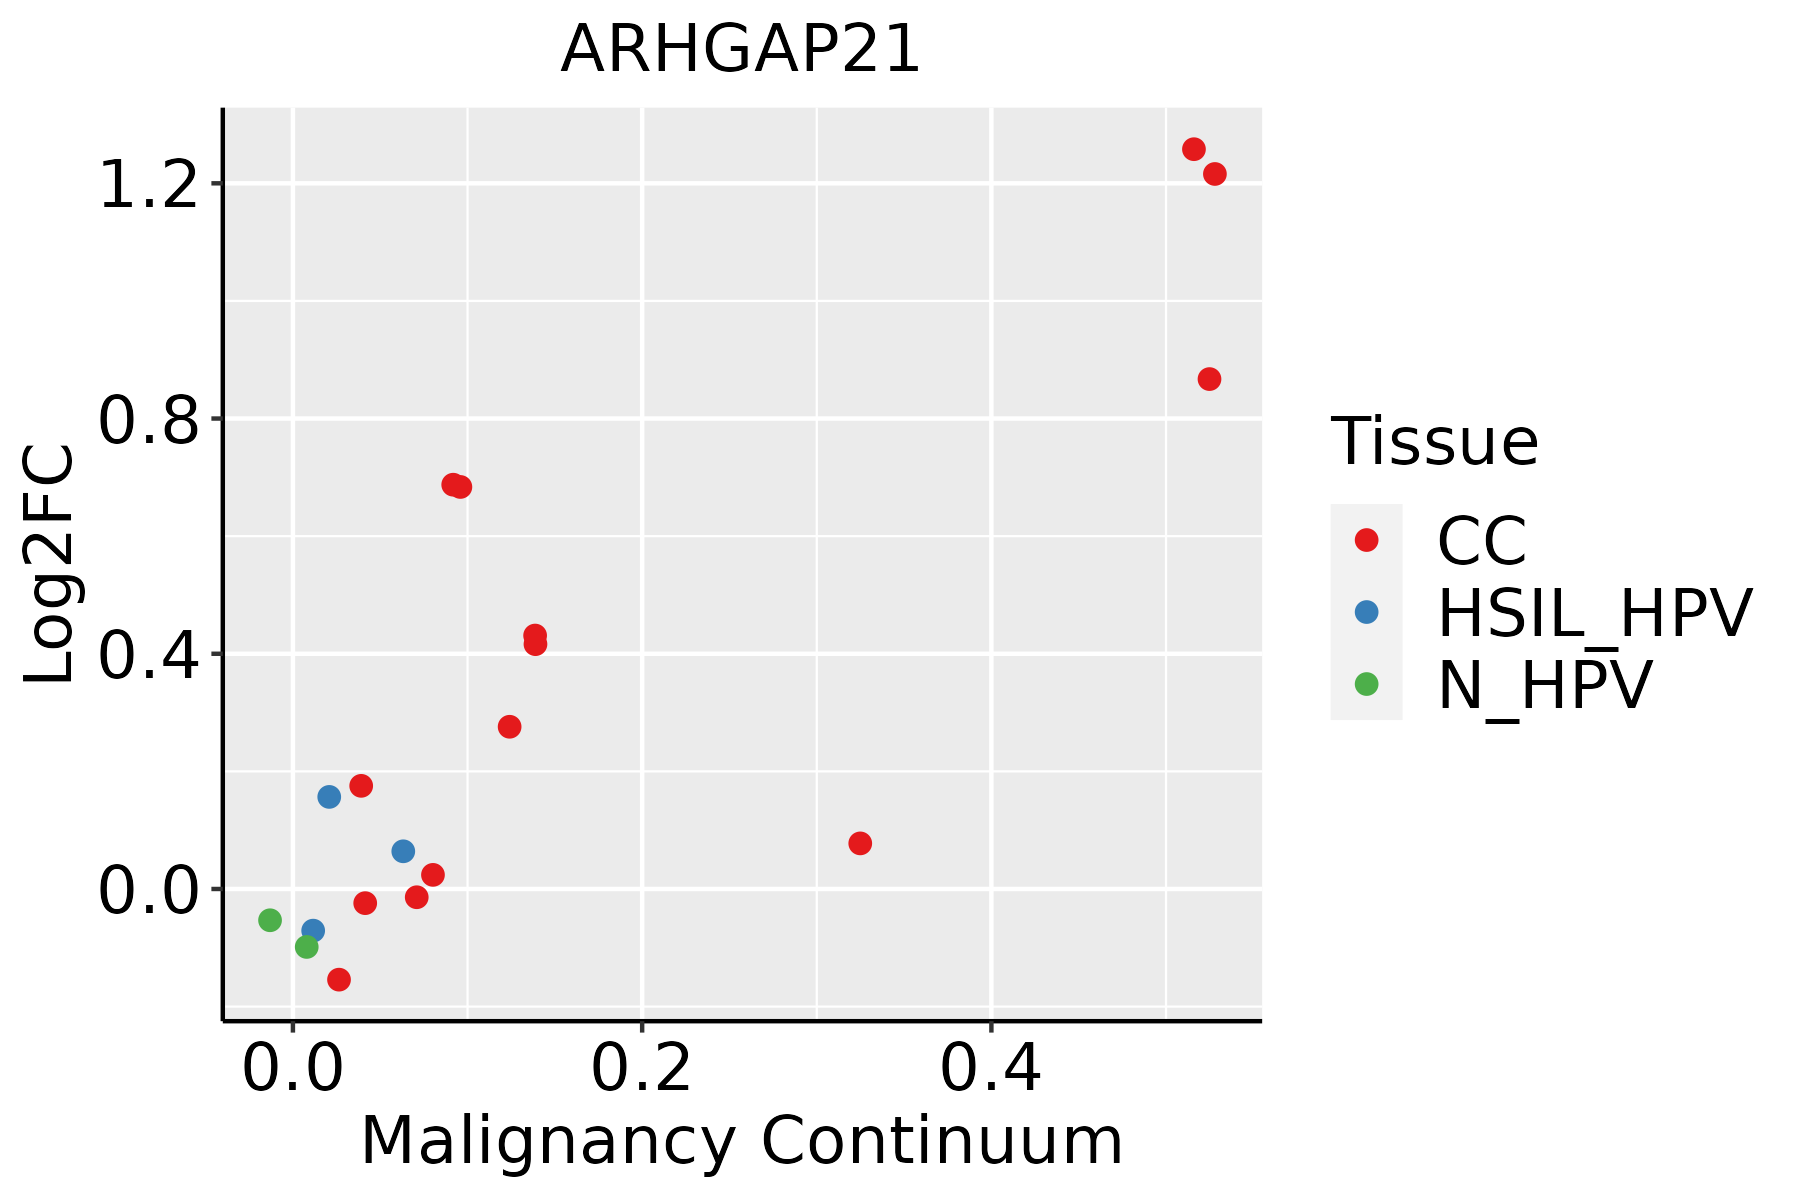 | CC: Cervix cancer |
| HSIL_HPV: HPV-infected high-grade squamous intraepithelial lesions |
| N_HPV: HPV-infected normal cervix |
| Colorectum (GSE201348) |  | FAP: Familial adenomatous polyposis |
| CRC: Colorectal cancer |
| Colorectum (HTA11) |  | AD: Adenomas |
| SER: Sessile serrated lesions |
| MSI-H: Microsatellite-high colorectal cancer |
| MSS: Microsatellite stable colorectal cancer |
| Esophagus |  | ESCC: Esophageal squamous cell carcinoma |
| HGIN: High-grade intraepithelial neoplasias |
| LGIN: Low-grade intraepithelial neoplasias |
| Liver | 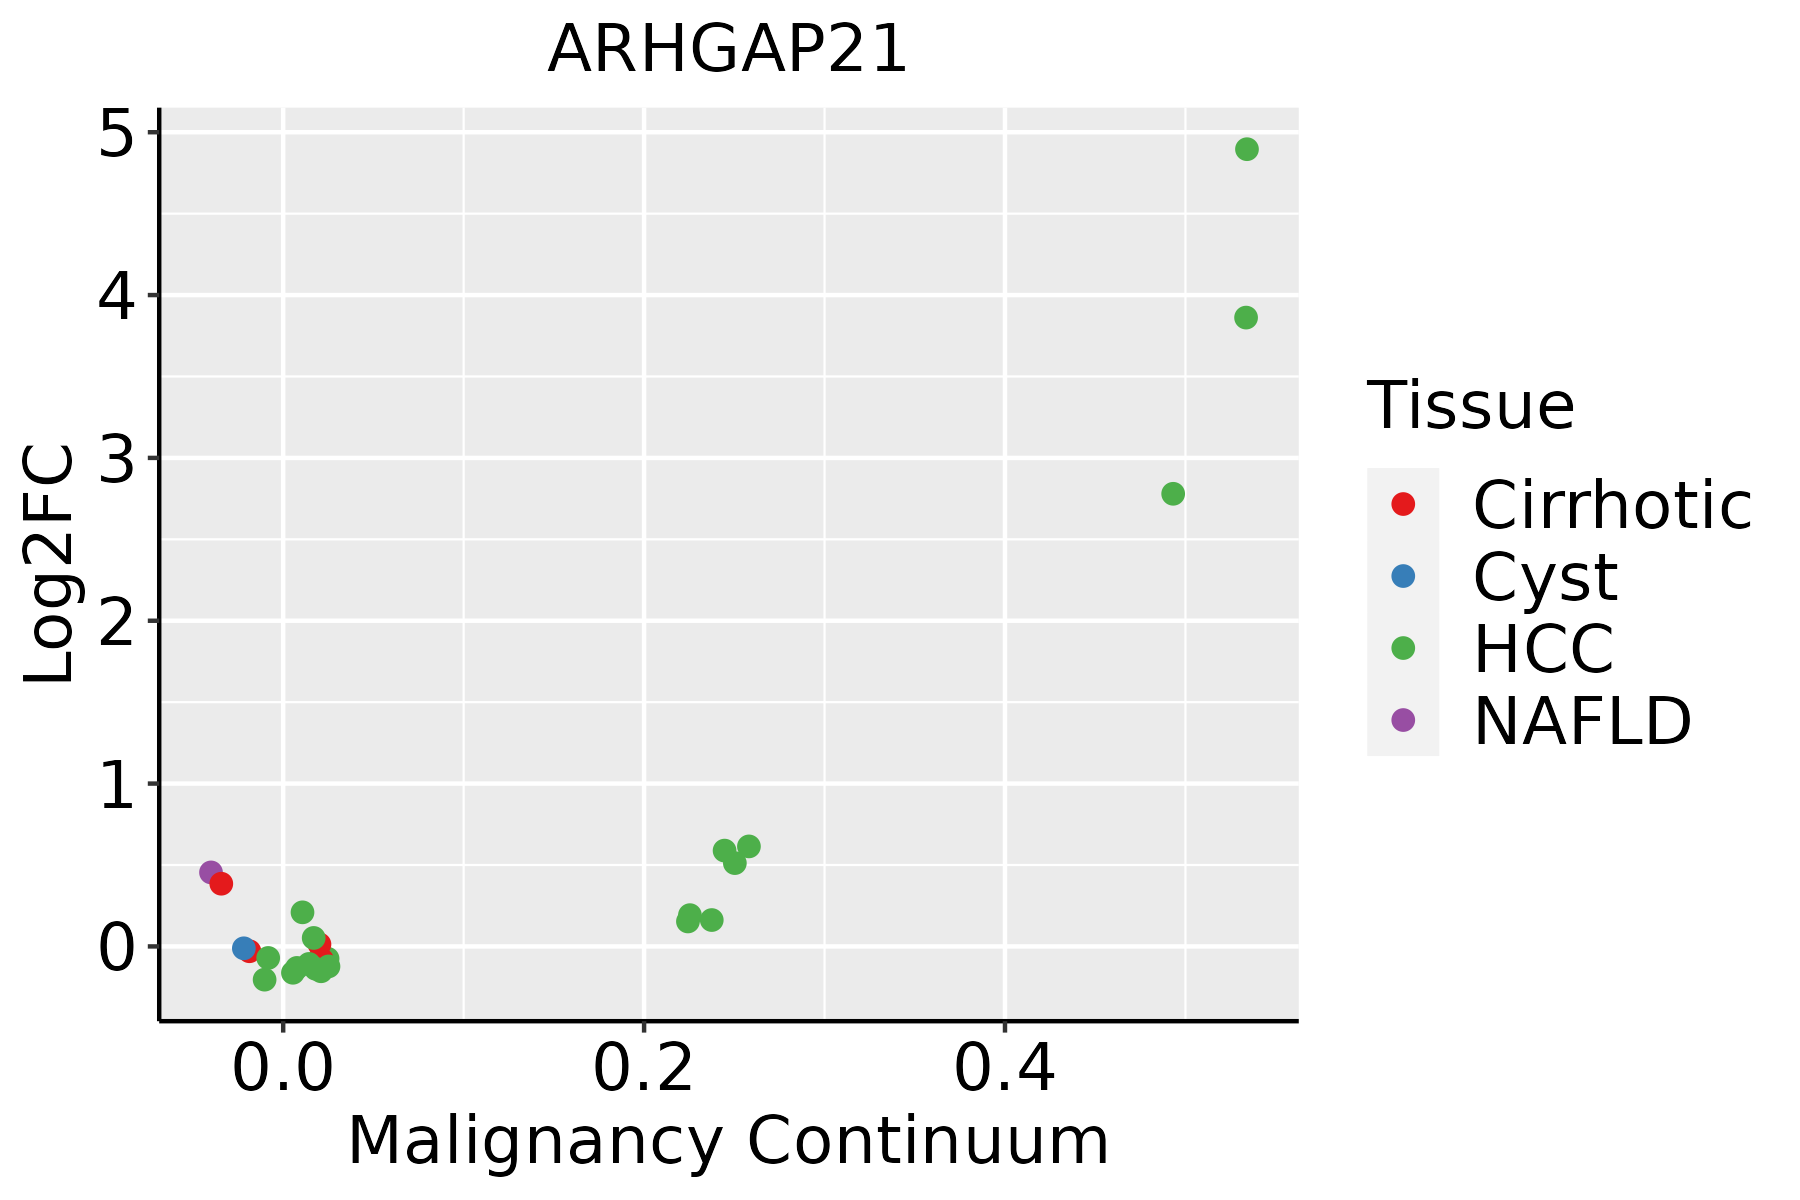 | HCC: Hepatocellular carcinoma |
| NAFLD: Non-alcoholic fatty liver disease |
| Lung | 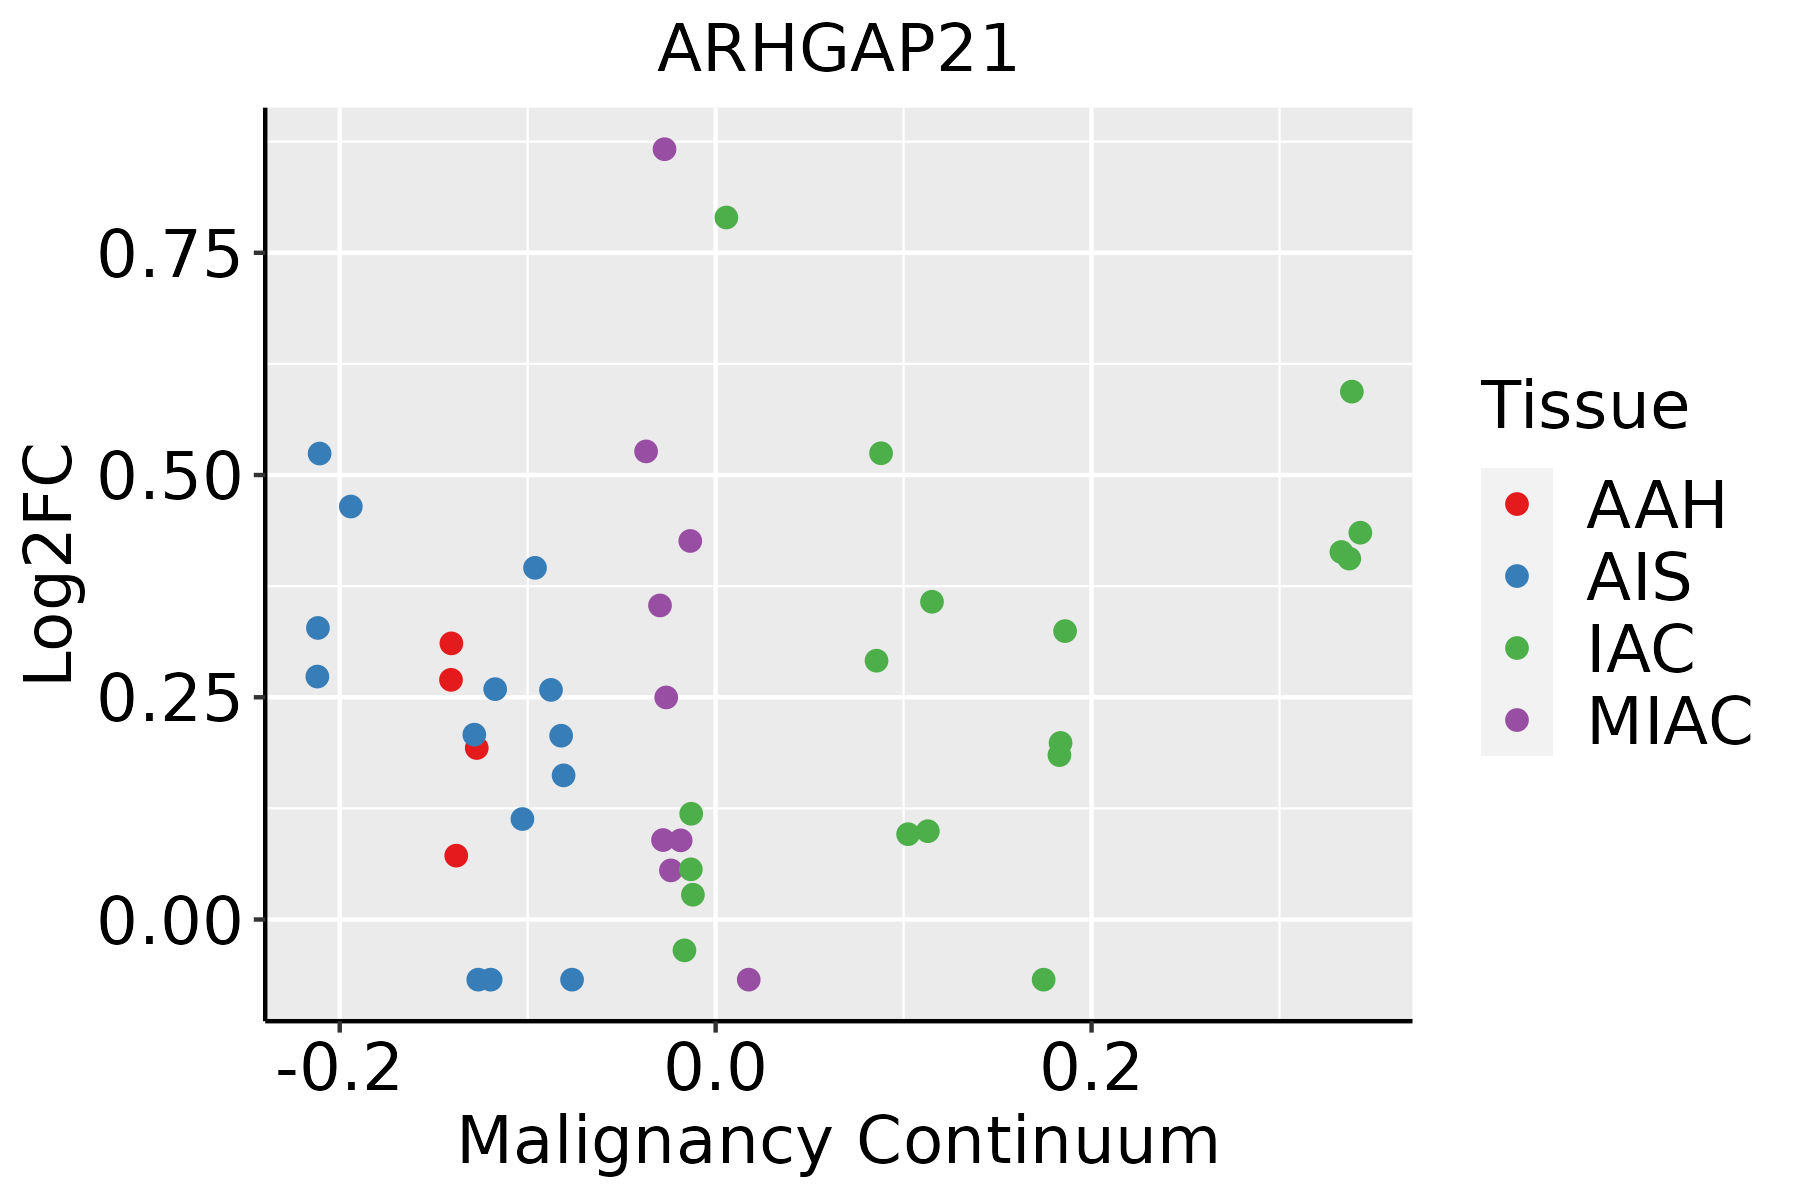 | AAH: Atypical adenomatous hyperplasia |
| AIS: Adenocarcinoma in situ |
| IAC: Invasive lung adenocarcinoma |
| MIA: Minimally invasive adenocarcinoma |
| Oral Cavity | 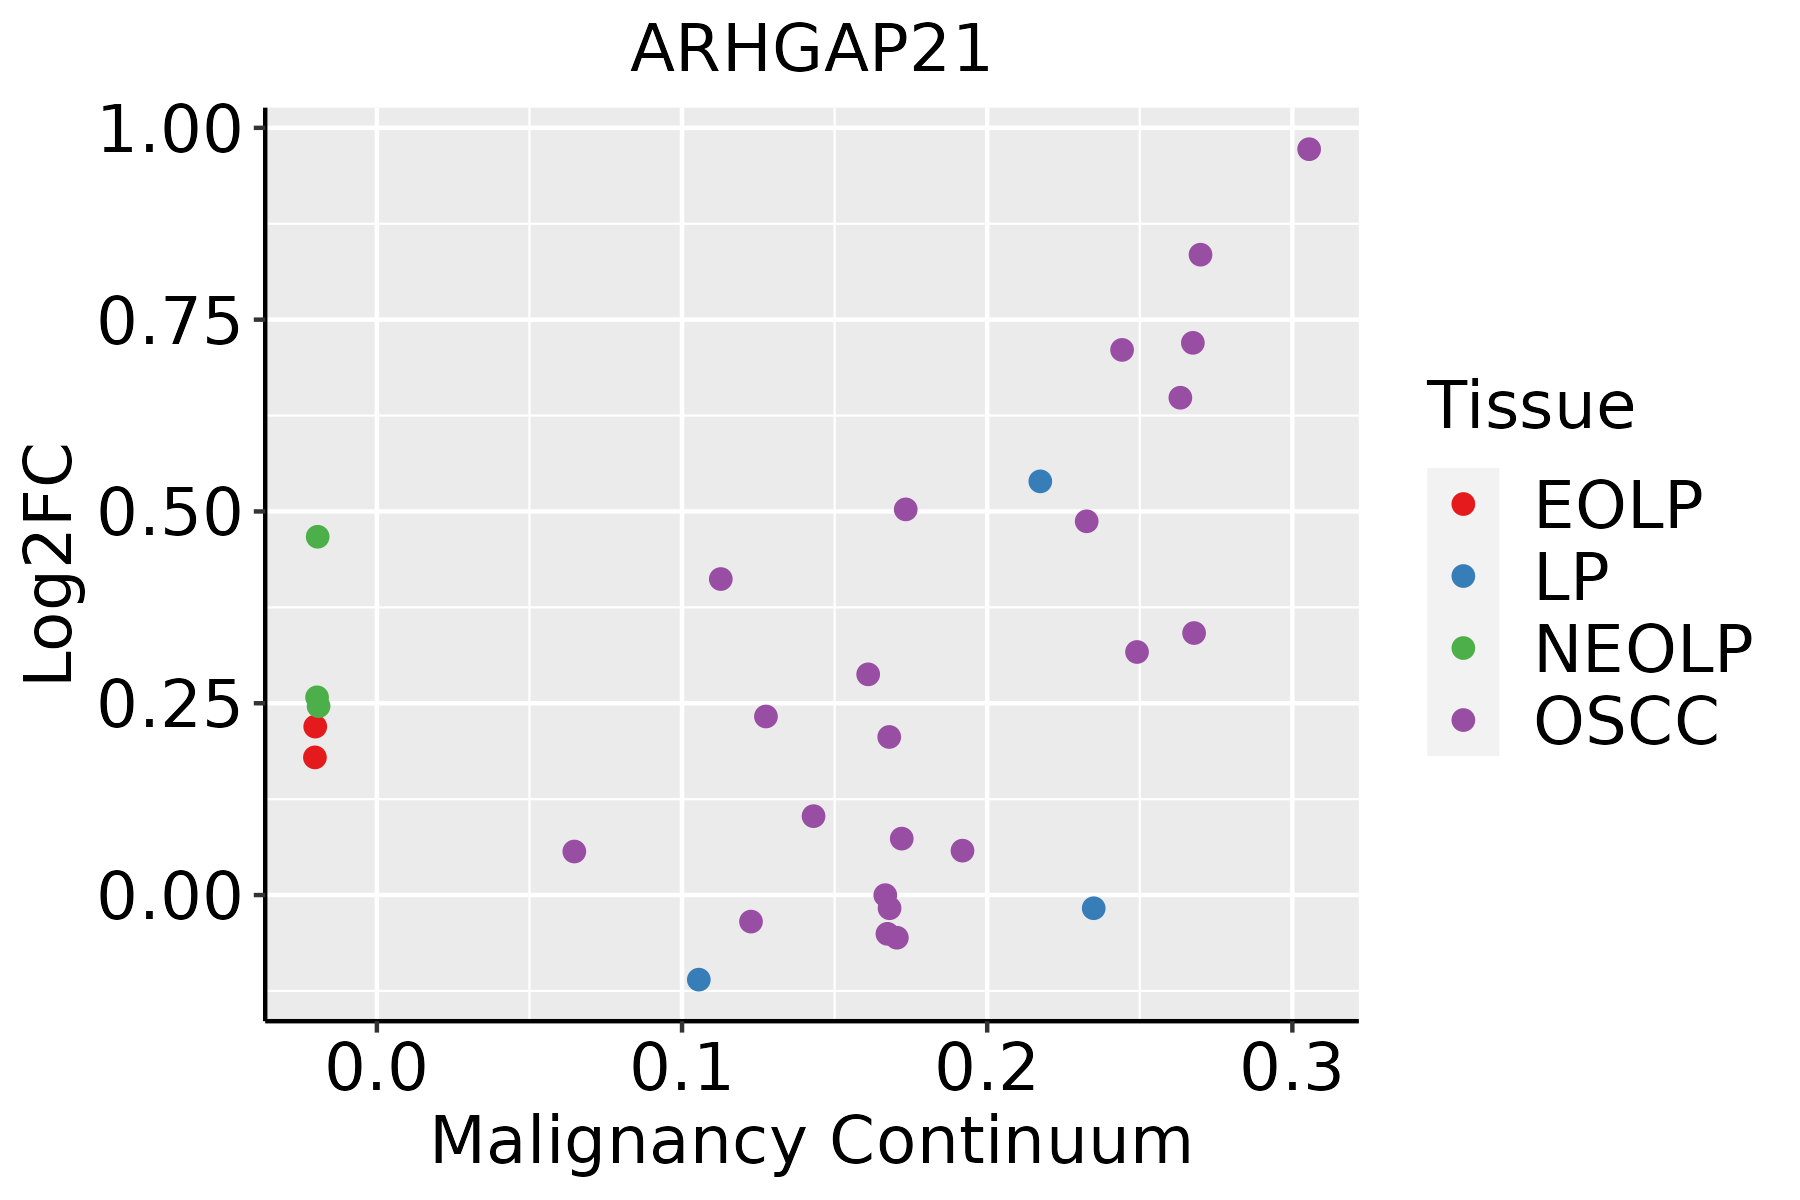 | EOLP: Erosive Oral lichen planus |
| LP: leukoplakia |
| NEOLP: Non-erosive oral lichen planus |
| OSCC: Oral squamous cell carcinoma |
| Prostate |  | BPH: Benign Prostatic Hyperplasia |
| Skin |  | AK: Actinic keratosis |
| cSCC: Cutaneous squamous cell carcinoma |
| SCCIS:squamous cell carcinoma in situ |
| Thyroid |  | ATC: Anaplastic thyroid cancer |
| HT: Hashimoto's thyroiditis |
| PTC: Papillary thyroid cancer |
| GO ID | Tissue | Disease Stage | Description | Gene Ratio | Bg Ratio | pvalue | p.adjust | Count |
| GO:00510566 | Cervix | CC | regulation of small GTPase mediated signal transduction | 75/2311 | 302/18723 | 1.54e-09 | 1.74e-07 | 75 |
| GO:00512359 | Cervix | CC | maintenance of location | 78/2311 | 327/18723 | 5.18e-09 | 4.92e-07 | 78 |
| GO:005165110 | Cervix | CC | maintenance of location in cell | 55/2311 | 214/18723 | 6.63e-08 | 3.85e-06 | 55 |
| GO:00516567 | Cervix | CC | establishment of organelle localization | 76/2311 | 390/18723 | 3.17e-05 | 5.21e-04 | 76 |
| GO:00307057 | Cervix | CC | cytoskeleton-dependent intracellular transport | 40/2311 | 195/18723 | 7.92e-04 | 6.99e-03 | 40 |
| GO:00070304 | Cervix | CC | Golgi organization | 32/2311 | 157/18723 | 2.78e-03 | 1.87e-02 | 32 |
| GO:00516572 | Cervix | CC | maintenance of organelle location | 5/2311 | 11/18723 | 6.92e-03 | 3.74e-02 | 5 |
| GO:0051656 | Colorectum | AD | establishment of organelle localization | 131/3918 | 390/18723 | 3.00e-09 | 2.06e-07 | 131 |
| GO:0051056 | Colorectum | AD | regulation of small GTPase mediated signal transduction | 94/3918 | 302/18723 | 1.81e-05 | 3.76e-04 | 94 |
| GO:0030705 | Colorectum | AD | cytoskeleton-dependent intracellular transport | 60/3918 | 195/18723 | 7.56e-04 | 7.59e-03 | 60 |
| GO:0051651 | Colorectum | AD | maintenance of location in cell | 61/3918 | 214/18723 | 5.02e-03 | 3.37e-02 | 61 |
| GO:0072384 | Colorectum | AD | organelle transport along microtubule | 28/3918 | 85/18723 | 6.55e-03 | 4.07e-02 | 28 |
| GO:00516562 | Colorectum | MSS | establishment of organelle localization | 115/3467 | 390/18723 | 7.30e-08 | 3.67e-06 | 115 |
| GO:00510561 | Colorectum | MSS | regulation of small GTPase mediated signal transduction | 82/3467 | 302/18723 | 1.31e-04 | 1.99e-03 | 82 |
| GO:00516512 | Colorectum | MSS | maintenance of location in cell | 57/3467 | 214/18723 | 2.07e-03 | 1.76e-02 | 57 |
| GO:00307052 | Colorectum | MSS | cytoskeleton-dependent intracellular transport | 52/3467 | 195/18723 | 3.07e-03 | 2.34e-02 | 52 |
| GO:0051645 | Colorectum | MSS | Golgi localization | 7/3467 | 14/18723 | 7.51e-03 | 4.72e-02 | 7 |
| GO:00516563 | Colorectum | FAP | establishment of organelle localization | 97/2622 | 390/18723 | 5.91e-09 | 9.48e-07 | 97 |
| GO:00510562 | Colorectum | FAP | regulation of small GTPase mediated signal transduction | 78/2622 | 302/18723 | 3.25e-08 | 2.85e-06 | 78 |
| GO:00307053 | Colorectum | FAP | cytoskeleton-dependent intracellular transport | 47/2622 | 195/18723 | 1.06e-04 | 1.76e-03 | 47 |
| Hugo Symbol | Variant Class | Variant Classification | dbSNP RS | HGVSc | HGVSp | HGVSp Short | SWISSPROT | BIOTYPE | SIFT | PolyPhen | Tumor Sample Barcode | Tissue | Histology | Sex | Age | Stage | Therapy Types | Drugs | Outcome |
| ARHGAP21 | SNV | Missense_Mutation | | c.332G>T | p.Gly111Val | p.G111V | Q5T5U3 | protein_coding | deleterious(0) | probably_damaging(1) | TCGA-A2-A0ST-01 | Breast | breast invasive carcinoma | Female | <65 | I/II | Chemotherapy | adriamycin | SD |
| ARHGAP21 | SNV | Missense_Mutation | | c.4387N>A | p.Glu1463Lys | p.E1463K | Q5T5U3 | protein_coding | tolerated(0.06) | benign(0.018) | TCGA-A8-A095-01 | Breast | breast invasive carcinoma | Female | <65 | I/II | Chemotherapy | 5-fluorouracil | CR |
| ARHGAP21 | SNV | Missense_Mutation | novel | c.1106N>T | p.Pro369Leu | p.P369L | Q5T5U3 | protein_coding | deleterious(0.04) | possibly_damaging(0.836) | TCGA-A8-A09D-01 | Breast | breast invasive carcinoma | Female | <65 | I/II | Chemotherapy | doxorubicin | CR |
| ARHGAP21 | SNV | Missense_Mutation | | c.4444N>C | p.Asp1482His | p.D1482H | Q5T5U3 | protein_coding | tolerated(0.09) | benign(0.059) | TCGA-A8-A0A9-01 | Breast | breast invasive carcinoma | Female | >=65 | I/II | Hormone Therapy | anastrozole | SD |
| ARHGAP21 | SNV | Missense_Mutation | novel | c.2366N>T | p.Arg789Ile | p.R789I | Q5T5U3 | protein_coding | deleterious(0.01) | probably_damaging(0.999) | TCGA-AN-A046-01 | Breast | breast invasive carcinoma | Female | >=65 | I/II | Unknown | Unknown | SD |
| ARHGAP21 | SNV | Missense_Mutation | | c.2341N>T | p.Val781Phe | p.V781F | Q5T5U3 | protein_coding | tolerated(0.11) | probably_damaging(0.999) | TCGA-AR-A0TT-01 | Breast | breast invasive carcinoma | Female | <65 | III/IV | Chemotherapy | doxorubicin | SD |
| ARHGAP21 | SNV | Missense_Mutation | novel | c.3446N>C | p.Leu1149Pro | p.L1149P | Q5T5U3 | protein_coding | deleterious(0) | probably_damaging(1) | TCGA-AR-A5QQ-01 | Breast | breast invasive carcinoma | Female | >=65 | III/IV | Chemotherapy | carboplatin | PD |
| ARHGAP21 | SNV | Missense_Mutation | | c.4558C>T | p.Arg1520Cys | p.R1520C | Q5T5U3 | protein_coding | deleterious(0) | probably_damaging(0.927) | TCGA-B6-A0RE-01 | Breast | breast invasive carcinoma | Female | <65 | I/II | Unknown | Unknown | SD |
| ARHGAP21 | SNV | Missense_Mutation | | c.3338N>G | p.Asp1113Gly | p.D1113G | Q5T5U3 | protein_coding | deleterious(0) | possibly_damaging(0.756) | TCGA-B6-A0RL-01 | Breast | breast invasive carcinoma | Female | <65 | I/II | Unknown | Unknown | SD |
| ARHGAP21 | SNV | Missense_Mutation | | c.2932N>A | p.Glu978Lys | p.E978K | Q5T5U3 | protein_coding | deleterious(0) | possibly_damaging(0.74) | TCGA-BH-A0HF-01 | Breast | breast invasive carcinoma | Female | >=65 | I/II | Hormone Therapy | arimidex | SD |


