
|
|||||
|
 | |
| |
| |
| |
| |
| |
|
Gene: ARHGAP17 |
Gene summary for ARHGAP17 |
| Gene information | Species | Human | Gene symbol | ARHGAP17 | Gene ID | 55114 |
| Gene name | Rho GTPase activating protein 17 | |
| Gene Alias | MST066 | |
| Cytomap | 16p12.1 | |
| Gene Type | protein-coding | GO ID | GO:0006996 | UniProtAcc | Q68EM7 |
Top |
Malignant transformation analysis |
| Identification of the aberrant gene expression in precancerous and cancerous lesions by comparing the gene expression of stem-like cells in diseased tissues with normal stem cells |
| Entrez ID | Symbol | Replicates | Species | Organ | Tissue | Adj P-value | Log2FC | Malignancy |
| 55114 | ARHGAP17 | HTA11_3410_2000001011 | Human | Colorectum | AD | 3.94e-12 | -4.49e-01 | 0.0155 |
| 55114 | ARHGAP17 | HTA11_866_3004761011 | Human | Colorectum | AD | 8.18e-03 | -3.08e-01 | 0.096 |
| 55114 | ARHGAP17 | HTA11_10711_2000001011 | Human | Colorectum | AD | 3.28e-03 | -3.39e-01 | 0.0338 |
| 55114 | ARHGAP17 | HTA11_7696_3000711011 | Human | Colorectum | AD | 4.46e-02 | -1.20e-01 | 0.0674 |
| 55114 | ARHGAP17 | HTA11_99999970781_79442 | Human | Colorectum | MSS | 3.09e-04 | -2.55e-01 | 0.294 |
| 55114 | ARHGAP17 | HTA11_99999974143_84620 | Human | Colorectum | MSS | 1.31e-09 | -4.00e-01 | 0.3005 |
| 55114 | ARHGAP17 | F007 | Human | Colorectum | FAP | 1.11e-02 | -2.71e-01 | 0.1176 |
| 55114 | ARHGAP17 | A002-C-010 | Human | Colorectum | FAP | 3.76e-02 | -2.29e-01 | 0.242 |
| 55114 | ARHGAP17 | A001-C-207 | Human | Colorectum | FAP | 2.60e-02 | -2.04e-01 | 0.1278 |
| 55114 | ARHGAP17 | A015-C-203 | Human | Colorectum | FAP | 3.23e-23 | -2.28e-01 | -0.1294 |
| 55114 | ARHGAP17 | A015-C-204 | Human | Colorectum | FAP | 3.08e-05 | -2.44e-01 | -0.0228 |
| 55114 | ARHGAP17 | A014-C-040 | Human | Colorectum | FAP | 2.33e-02 | -2.40e-01 | -0.1184 |
| 55114 | ARHGAP17 | A002-C-201 | Human | Colorectum | FAP | 1.62e-12 | -3.06e-01 | 0.0324 |
| 55114 | ARHGAP17 | A002-C-203 | Human | Colorectum | FAP | 6.83e-09 | -2.79e-01 | 0.2786 |
| 55114 | ARHGAP17 | A001-C-119 | Human | Colorectum | FAP | 4.12e-07 | -3.65e-01 | -0.1557 |
| 55114 | ARHGAP17 | A001-C-108 | Human | Colorectum | FAP | 9.41e-13 | -2.31e-01 | -0.0272 |
| 55114 | ARHGAP17 | A002-C-205 | Human | Colorectum | FAP | 4.97e-19 | -3.18e-01 | -0.1236 |
| 55114 | ARHGAP17 | A015-C-005 | Human | Colorectum | FAP | 5.29e-07 | -3.29e-01 | -0.0336 |
| 55114 | ARHGAP17 | A015-C-006 | Human | Colorectum | FAP | 5.08e-14 | -4.13e-01 | -0.0994 |
| 55114 | ARHGAP17 | A015-C-106 | Human | Colorectum | FAP | 8.74e-10 | -2.51e-01 | -0.0511 |
| Page: 1 2 3 4 5 6 |
| Tissue | Expression Dynamics | Abbreviation |
| Colorectum (GSE201348) |  | FAP: Familial adenomatous polyposis |
| CRC: Colorectal cancer | ||
| Colorectum (HTA11) |  | AD: Adenomas |
| SER: Sessile serrated lesions | ||
| MSI-H: Microsatellite-high colorectal cancer | ||
| MSS: Microsatellite stable colorectal cancer | ||
| Endometrium | 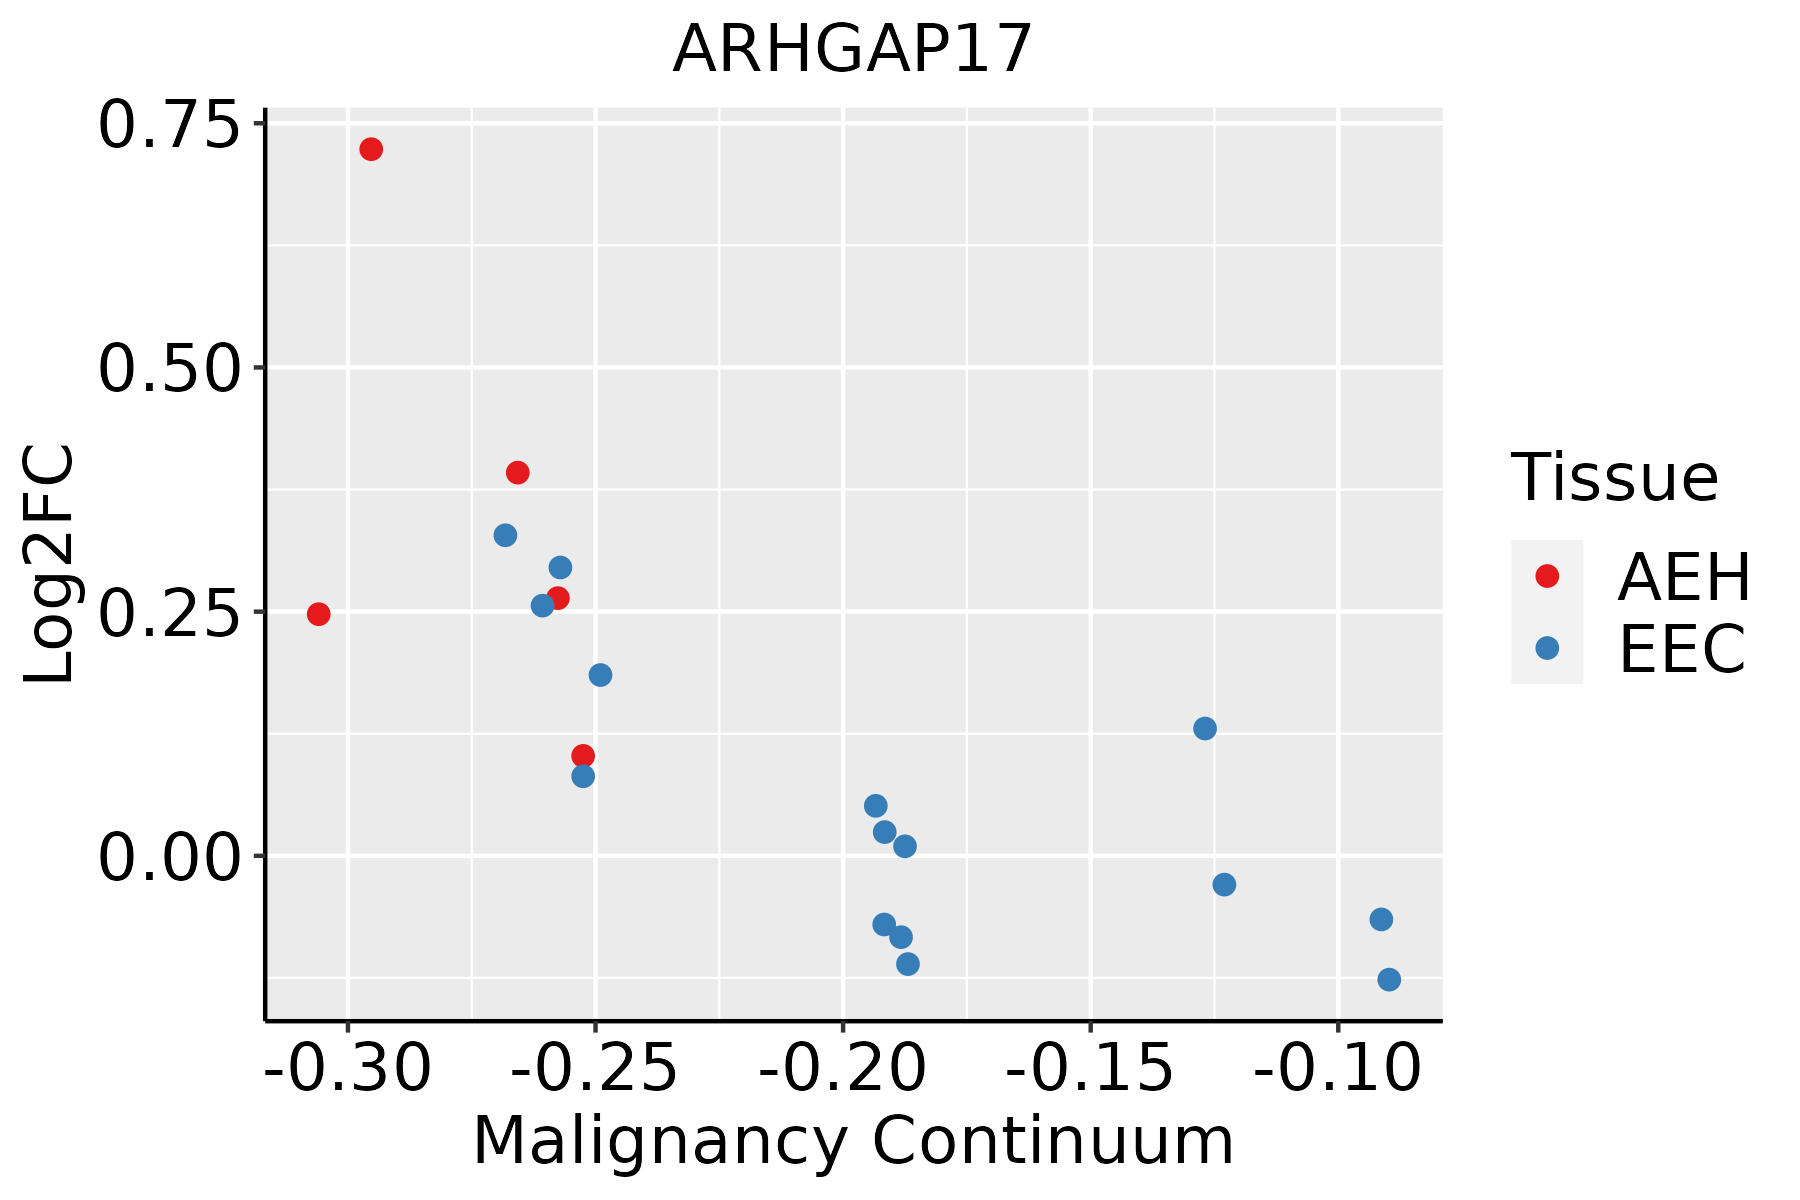 | AEH: Atypical endometrial hyperplasia |
| EEC: Endometrioid Cancer | ||
| Esophagus | 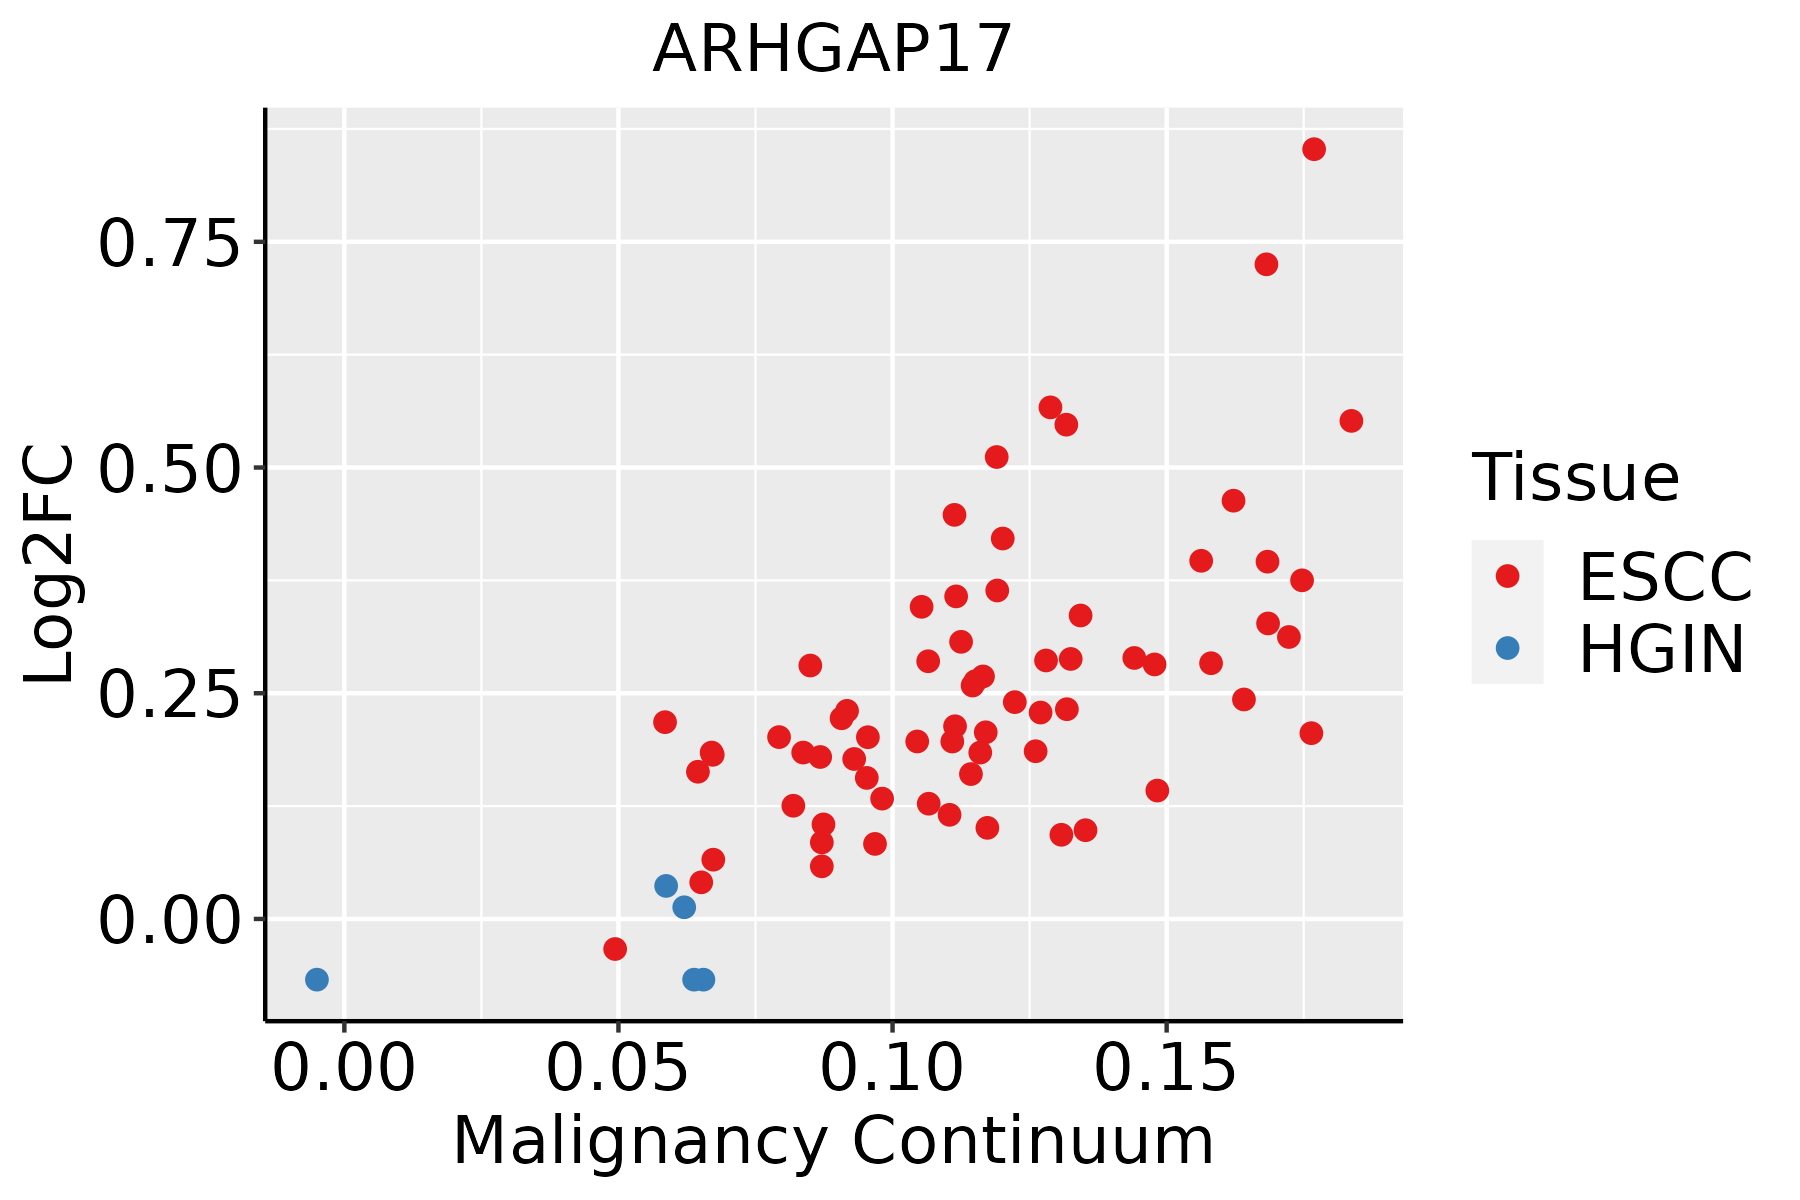 | ESCC: Esophageal squamous cell carcinoma |
| HGIN: High-grade intraepithelial neoplasias | ||
| LGIN: Low-grade intraepithelial neoplasias | ||
| Liver | 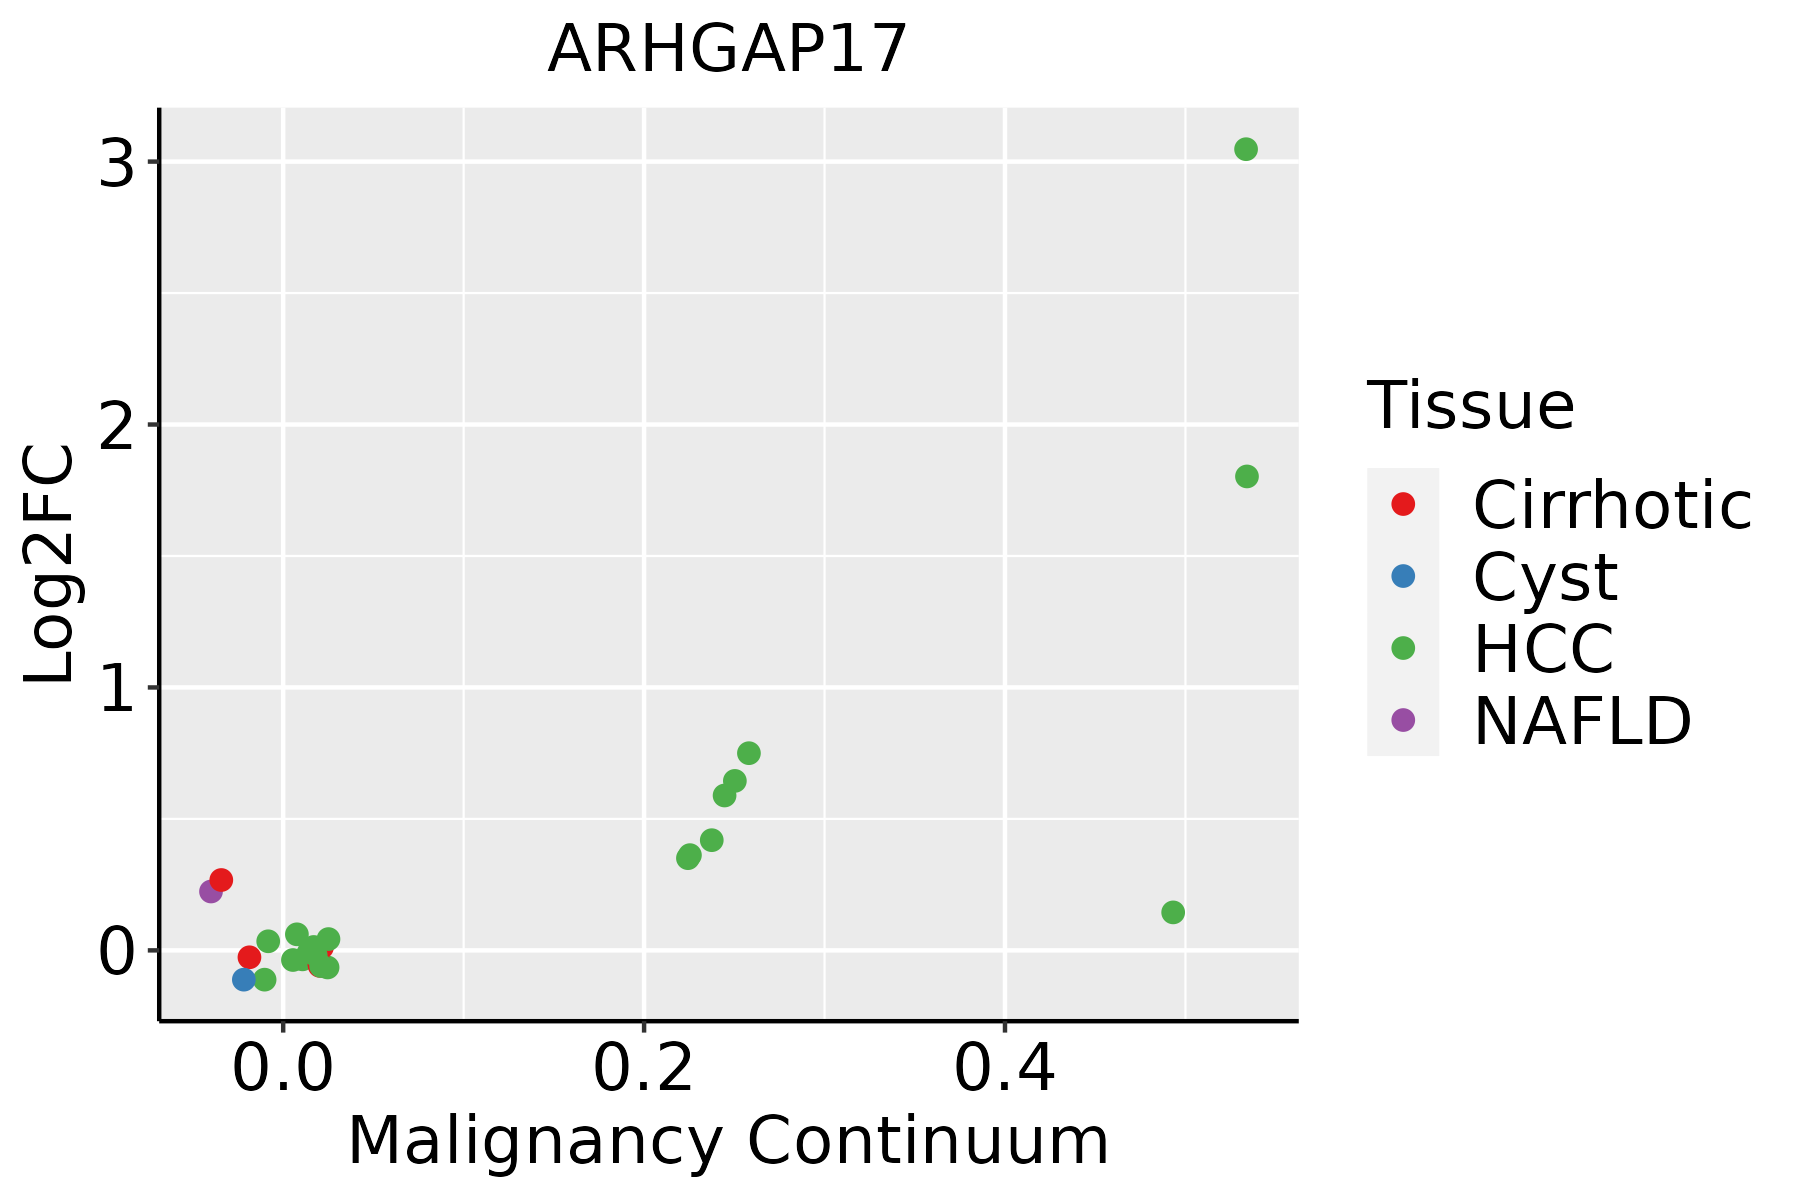 | HCC: Hepatocellular carcinoma |
| NAFLD: Non-alcoholic fatty liver disease |
| ∗log2FC in expression of this searched gene in stem-like cells from each diseased tissue sample relative to stem-like cells in normal samples in each tissue plotted against the malignancy continuum. Samples are colored based on if they are from different disease stage. |
Top |
Malignant transformation related pathway analysis |
| Find out the enriched GO biological processes and KEGG pathways involved in transition from healthy to precancer to cancer |
| Tissue | Disease Stage | Enriched GO biological Processes |
| Colorectum | AD |  |
| Colorectum | SER |  |
| Colorectum | MSS |  |
| Colorectum | MSI-H |  |
| Colorectum | FAP |  |
| ∗Top 15 enriched GO BP terms are showed in the bar plot of each disease state in each tissue. Each row represents a significant GO biological process which is colored according to the -log10(p.adjust). |
| Page: 1 2 3 4 5 6 7 8 9 |
| GO ID | Tissue | Disease Stage | Description | Gene Ratio | Bg Ratio | pvalue | p.adjust | Count |
| GO:0032970 | Colorectum | AD | regulation of actin filament-based process | 142/3918 | 397/18723 | 4.05e-12 | 5.90e-10 | 142 |
| GO:0032956 | Colorectum | AD | regulation of actin cytoskeleton organization | 127/3918 | 358/18723 | 1.03e-10 | 1.04e-08 | 127 |
| GO:0007265 | Colorectum | AD | Ras protein signal transduction | 104/3918 | 337/18723 | 1.01e-05 | 2.35e-04 | 104 |
| GO:0051056 | Colorectum | AD | regulation of small GTPase mediated signal transduction | 94/3918 | 302/18723 | 1.81e-05 | 3.76e-04 | 94 |
| GO:0016601 | Colorectum | AD | Rac protein signal transduction | 20/3918 | 42/18723 | 1.02e-04 | 1.53e-03 | 20 |
| GO:0046578 | Colorectum | AD | regulation of Ras protein signal transduction | 56/3918 | 189/18723 | 2.85e-03 | 2.14e-02 | 56 |
| GO:00329702 | Colorectum | MSS | regulation of actin filament-based process | 128/3467 | 397/18723 | 2.47e-11 | 3.49e-09 | 128 |
| GO:00329562 | Colorectum | MSS | regulation of actin cytoskeleton organization | 113/3467 | 358/18723 | 1.46e-09 | 1.07e-07 | 113 |
| GO:00072651 | Colorectum | MSS | Ras protein signal transduction | 91/3467 | 337/18723 | 7.20e-05 | 1.21e-03 | 91 |
| GO:00510561 | Colorectum | MSS | regulation of small GTPase mediated signal transduction | 82/3467 | 302/18723 | 1.31e-04 | 1.99e-03 | 82 |
| GO:00166011 | Colorectum | MSS | Rac protein signal transduction | 17/3467 | 42/18723 | 7.63e-04 | 8.10e-03 | 17 |
| GO:00329704 | Colorectum | FAP | regulation of actin filament-based process | 105/2622 | 397/18723 | 3.15e-11 | 1.38e-08 | 105 |
| GO:00329564 | Colorectum | FAP | regulation of actin cytoskeleton organization | 90/2622 | 358/18723 | 1.20e-08 | 1.39e-06 | 90 |
| GO:00510562 | Colorectum | FAP | regulation of small GTPase mediated signal transduction | 78/2622 | 302/18723 | 3.25e-08 | 2.85e-06 | 78 |
| GO:00072652 | Colorectum | FAP | Ras protein signal transduction | 80/2622 | 337/18723 | 9.61e-07 | 4.33e-05 | 80 |
| GO:00465781 | Colorectum | FAP | regulation of Ras protein signal transduction | 47/2622 | 189/18723 | 4.67e-05 | 9.60e-04 | 47 |
| GO:00166012 | Colorectum | FAP | Rac protein signal transduction | 14/2622 | 42/18723 | 1.20e-03 | 1.14e-02 | 14 |
| GO:00329705 | Colorectum | CRC | regulation of actin filament-based process | 89/2078 | 397/18723 | 5.25e-11 | 3.14e-08 | 89 |
| GO:00510563 | Colorectum | CRC | regulation of small GTPase mediated signal transduction | 69/2078 | 302/18723 | 3.34e-09 | 9.08e-07 | 69 |
| GO:00329565 | Colorectum | CRC | regulation of actin cytoskeleton organization | 76/2078 | 358/18723 | 1.68e-08 | 2.79e-06 | 76 |
| Page: 1 2 3 |
| Pathway ID | Tissue | Disease Stage | Description | Gene Ratio | Bg Ratio | pvalue | p.adjust | qvalue | Count |
| hsa04530 | Colorectum | AD | Tight junction | 76/2092 | 169/8465 | 5.49e-09 | 9.69e-08 | 6.18e-08 | 76 |
| hsa045301 | Colorectum | AD | Tight junction | 76/2092 | 169/8465 | 5.49e-09 | 9.69e-08 | 6.18e-08 | 76 |
| hsa045304 | Colorectum | MSS | Tight junction | 66/1875 | 169/8465 | 4.10e-07 | 6.25e-06 | 3.83e-06 | 66 |
| hsa045305 | Colorectum | MSS | Tight junction | 66/1875 | 169/8465 | 4.10e-07 | 6.25e-06 | 3.83e-06 | 66 |
| hsa045308 | Colorectum | FAP | Tight junction | 60/1404 | 169/8465 | 1.40e-09 | 9.33e-08 | 5.67e-08 | 60 |
| hsa045309 | Colorectum | FAP | Tight junction | 60/1404 | 169/8465 | 1.40e-09 | 9.33e-08 | 5.67e-08 | 60 |
| hsa0453010 | Colorectum | CRC | Tight junction | 44/1091 | 169/8465 | 2.51e-06 | 7.61e-05 | 5.16e-05 | 44 |
| hsa0453011 | Colorectum | CRC | Tight junction | 44/1091 | 169/8465 | 2.51e-06 | 7.61e-05 | 5.16e-05 | 44 |
| hsa0453026 | Endometrium | AEH | Tight junction | 54/1197 | 169/8465 | 1.99e-09 | 3.80e-08 | 2.78e-08 | 54 |
| hsa04530112 | Endometrium | AEH | Tight junction | 54/1197 | 169/8465 | 1.99e-09 | 3.80e-08 | 2.78e-08 | 54 |
| hsa0453027 | Endometrium | EEC | Tight junction | 54/1237 | 169/8465 | 6.56e-09 | 1.27e-07 | 9.46e-08 | 54 |
| hsa0453036 | Endometrium | EEC | Tight junction | 54/1237 | 169/8465 | 6.56e-09 | 1.27e-07 | 9.46e-08 | 54 |
| hsa04530211 | Esophagus | ESCC | Tight junction | 105/4205 | 169/8465 | 6.73e-04 | 2.23e-03 | 1.14e-03 | 105 |
| hsa04530310 | Esophagus | ESCC | Tight junction | 105/4205 | 169/8465 | 6.73e-04 | 2.23e-03 | 1.14e-03 | 105 |
| hsa0453042 | Liver | HCC | Tight junction | 110/4020 | 169/8465 | 2.45e-06 | 2.28e-05 | 1.27e-05 | 110 |
| hsa0453052 | Liver | HCC | Tight junction | 110/4020 | 169/8465 | 2.45e-06 | 2.28e-05 | 1.27e-05 | 110 |
| Page: 1 |
Top |
Cell-cell communication analysis |
| Identification of potential cell-cell interactions between two cell types and their ligand-receptor pairs for different disease states |
| Ligand | Receptor | LRpair | Pathway | Tissue | Disease Stage |
| Page: 1 |
Top |
Single-cell gene regulatory network inference analysis |
| Find out the significant the regulons (TFs) and the target genes of each regulon across cell types for different disease states |
| TF | Cell Type | Tissue | Disease Stage | Target Gene | RSS | Regulon Activity |
| ∗The dot plots of a searched regulon are shown for all cell subpopulations in each disease state of each tissue based on the regulon specific score inferred using pySCENIC and by calculating the average expression. |
| Page: 1 |
Top |
Somatic mutation of malignant transformation related genes |
| Annotation of somatic variants for genes involved in malignant transformation |
| Hugo Symbol | Variant Class | Variant Classification | dbSNP RS | HGVSc | HGVSp | HGVSp Short | SWISSPROT | BIOTYPE | SIFT | PolyPhen | Tumor Sample Barcode | Tissue | Histology | Sex | Age | Stage | Therapy Types | Drugs | Outcome |
| ARHGAP17 | SNV | Missense_Mutation | c.1682N>T | p.Ser561Phe | p.S561F | Q68EM7 | protein_coding | tolerated_low_confidence(0.06) | benign(0.34) | TCGA-AN-A0FL-01 | Breast | breast invasive carcinoma | Female | <65 | I/II | Unknown | Unknown | SD | |
| ARHGAP17 | SNV | Missense_Mutation | c.832G>A | p.Glu278Lys | p.E278K | Q68EM7 | protein_coding | deleterious(0.01) | probably_damaging(0.998) | TCGA-BH-A0DZ-01 | Breast | breast invasive carcinoma | Female | <65 | I/II | Chemotherapy | docetaxel | SD | |
| ARHGAP17 | SNV | Missense_Mutation | c.2069N>T | p.Ser690Phe | p.S690F | Q68EM7 | protein_coding | tolerated_low_confidence(0.11) | benign(0.023) | TCGA-C8-A137-01 | Breast | breast invasive carcinoma | Female | <65 | I/II | Unknown | Unknown | PD | |
| ARHGAP17 | SNV | Missense_Mutation | novel | c.1757N>T | p.Ala586Val | p.A586V | Q68EM7 | protein_coding | tolerated(0.11) | benign(0.057) | TCGA-E9-A54X-01 | Breast | breast invasive carcinoma | Female | >=65 | I/II | Unknown | Unknown | SD |
| ARHGAP17 | insertion | Frame_Shift_Ins | novel | c.1295_1296insCCCTGCTGCCATGTCCCGTGGGGTGCAAGCC | p.Glu432AspfsTer23 | p.E432Dfs*23 | Q68EM7 | protein_coding | TCGA-A8-A06X-01 | Breast | breast invasive carcinoma | Female | >=65 | I/II | Unknown | Unknown | SD | ||
| ARHGAP17 | SNV | Missense_Mutation | c.187N>A | p.Glu63Lys | p.E63K | Q68EM7 | protein_coding | deleterious(0.02) | possibly_damaging(0.823) | TCGA-DS-A0VK-01 | Cervix | cervical & endocervical cancer | Female | <65 | I/II | Chemotherapy | carboplatin | PD | |
| ARHGAP17 | SNV | Missense_Mutation | c.2024N>T | p.Pro675Leu | p.P675L | Q68EM7 | protein_coding | deleterious_low_confidence(0.03) | benign(0.154) | TCGA-EA-A5ZF-01 | Cervix | cervical & endocervical cancer | Female | <65 | I/II | Unknown | Unknown | PD | |
| ARHGAP17 | SNV | Missense_Mutation | rs752563170 | c.2096G>A | p.Arg699Gln | p.R699Q | Q68EM7 | protein_coding | deleterious_low_confidence(0.02) | probably_damaging(0.968) | TCGA-Q1-A73O-01 | Cervix | cervical & endocervical cancer | Female | <65 | I/II | Chemotherapy | cisplatin | CR |
| ARHGAP17 | SNV | Missense_Mutation | novel | c.787C>T | p.Arg263Cys | p.R263C | Q68EM7 | protein_coding | deleterious(0.01) | probably_damaging(0.997) | TCGA-VS-A9UR-01 | Cervix | cervical & endocervical cancer | Female | <65 | I/II | Chemotherapy | cisplatin | PD |
| ARHGAP17 | SNV | Missense_Mutation | rs750139572 | c.96N>G | p.Ile32Met | p.I32M | Q68EM7 | protein_coding | deleterious(0) | probably_damaging(0.999) | TCGA-AA-3663-01 | Colorectum | colon adenocarcinoma | Male | <65 | I/II | Unknown | Unknown | SD |
| Page: 1 2 3 4 5 6 7 8 9 10 11 12 13 14 |
Top |
Related drugs of malignant transformation related genes |
| Identification of chemicals and drugs interact with genes involved in malignant transfromation |
| (DGIdb 4.0) |
| Entrez ID | Symbol | Category | Interaction Types | Drug Claim Name | Drug Name | PMIDs |
| Page: 1 |

Copyright 2023-Present -The University of Texas Health Science Center at Houston |