
|
|||||
|
 | |
| |
| |
| |
| |
| |
|
Gene: ARHGAP15 |
Gene summary for ARHGAP15 |
| Gene information | Species | Human | Gene symbol | ARHGAP15 | Gene ID | 55843 |
| Gene name | Rho GTPase activating protein 15 | |
| Gene Alias | BM046 | |
| Cytomap | 2q22.2-q22.3 | |
| Gene Type | protein-coding | GO ID | GO:0000902 | UniProtAcc | Q53QZ3 |
Top |
Malignant transformation analysis |
| Identification of the aberrant gene expression in precancerous and cancerous lesions by comparing the gene expression of stem-like cells in diseased tissues with normal stem cells |
| Entrez ID | Symbol | Replicates | Species | Organ | Tissue | Adj P-value | Log2FC | Malignancy |
| 55843 | ARHGAP15 | EOLP-1 | Human | Oral cavity | EOLP | 2.35e-42 | 9.51e-01 | -0.0202 |
| 55843 | ARHGAP15 | EOLP-2 | Human | Oral cavity | EOLP | 1.70e-33 | 7.25e-01 | -0.0203 |
| 55843 | ARHGAP15 | NEOLP-1 | Human | Oral cavity | NEOLP | 1.08e-07 | 4.22e-01 | -0.0194 |
| 55843 | ARHGAP15 | NEOLP-2 | Human | Oral cavity | NEOLP | 1.31e-07 | 3.47e-01 | -0.0196 |
| 55843 | ARHGAP15 | NEOLP-3 | Human | Oral cavity | NEOLP | 6.83e-12 | 4.45e-01 | -0.0191 |
| 55843 | ARHGAP15 | ATC13 | Human | Thyroid | ATC | 7.13e-41 | 8.34e-01 | 0.34 |
| 55843 | ARHGAP15 | ATC5 | Human | Thyroid | ATC | 6.10e-44 | 8.96e-01 | 0.34 |
| Page: 1 |
| Tissue | Expression Dynamics | Abbreviation |
| Oral Cavity | 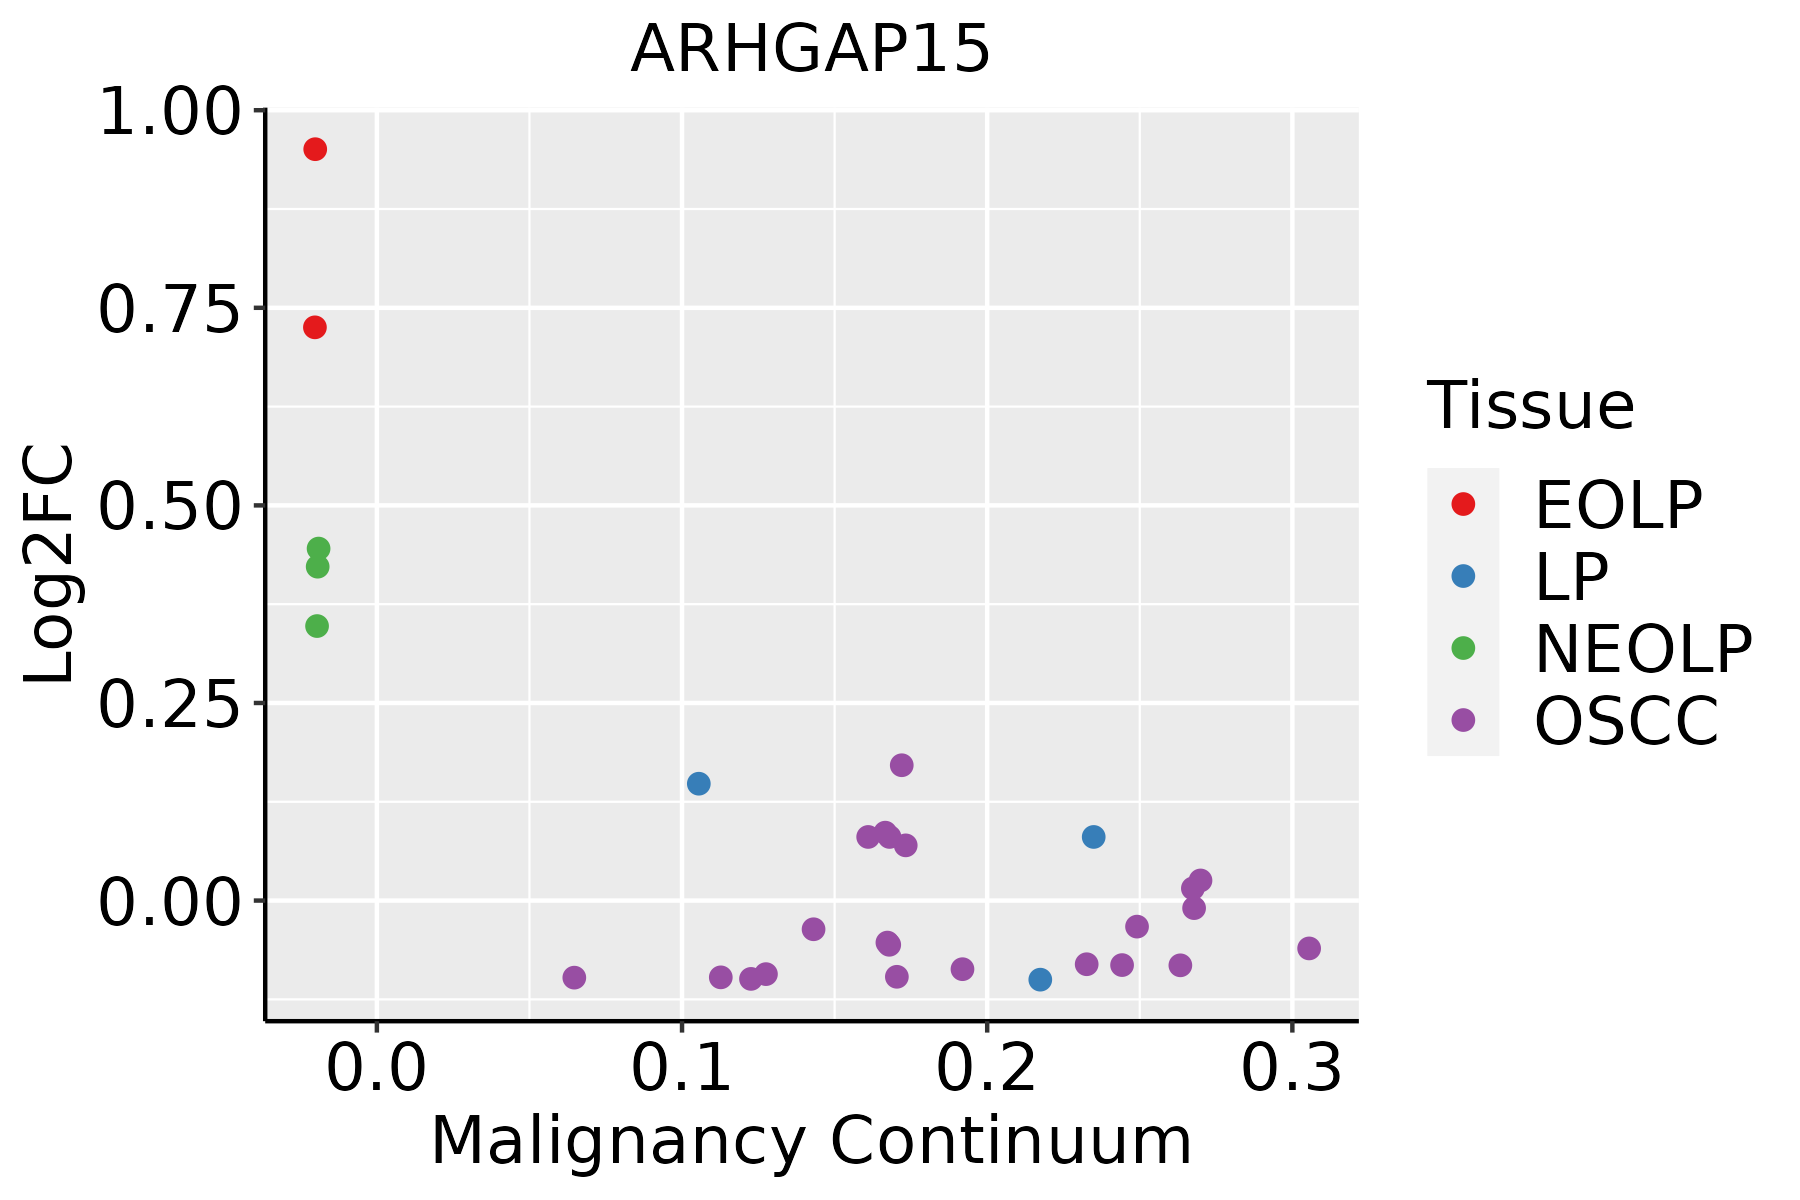 | EOLP: Erosive Oral lichen planus |
| LP: leukoplakia | ||
| NEOLP: Non-erosive oral lichen planus | ||
| OSCC: Oral squamous cell carcinoma | ||
| Thyroid | 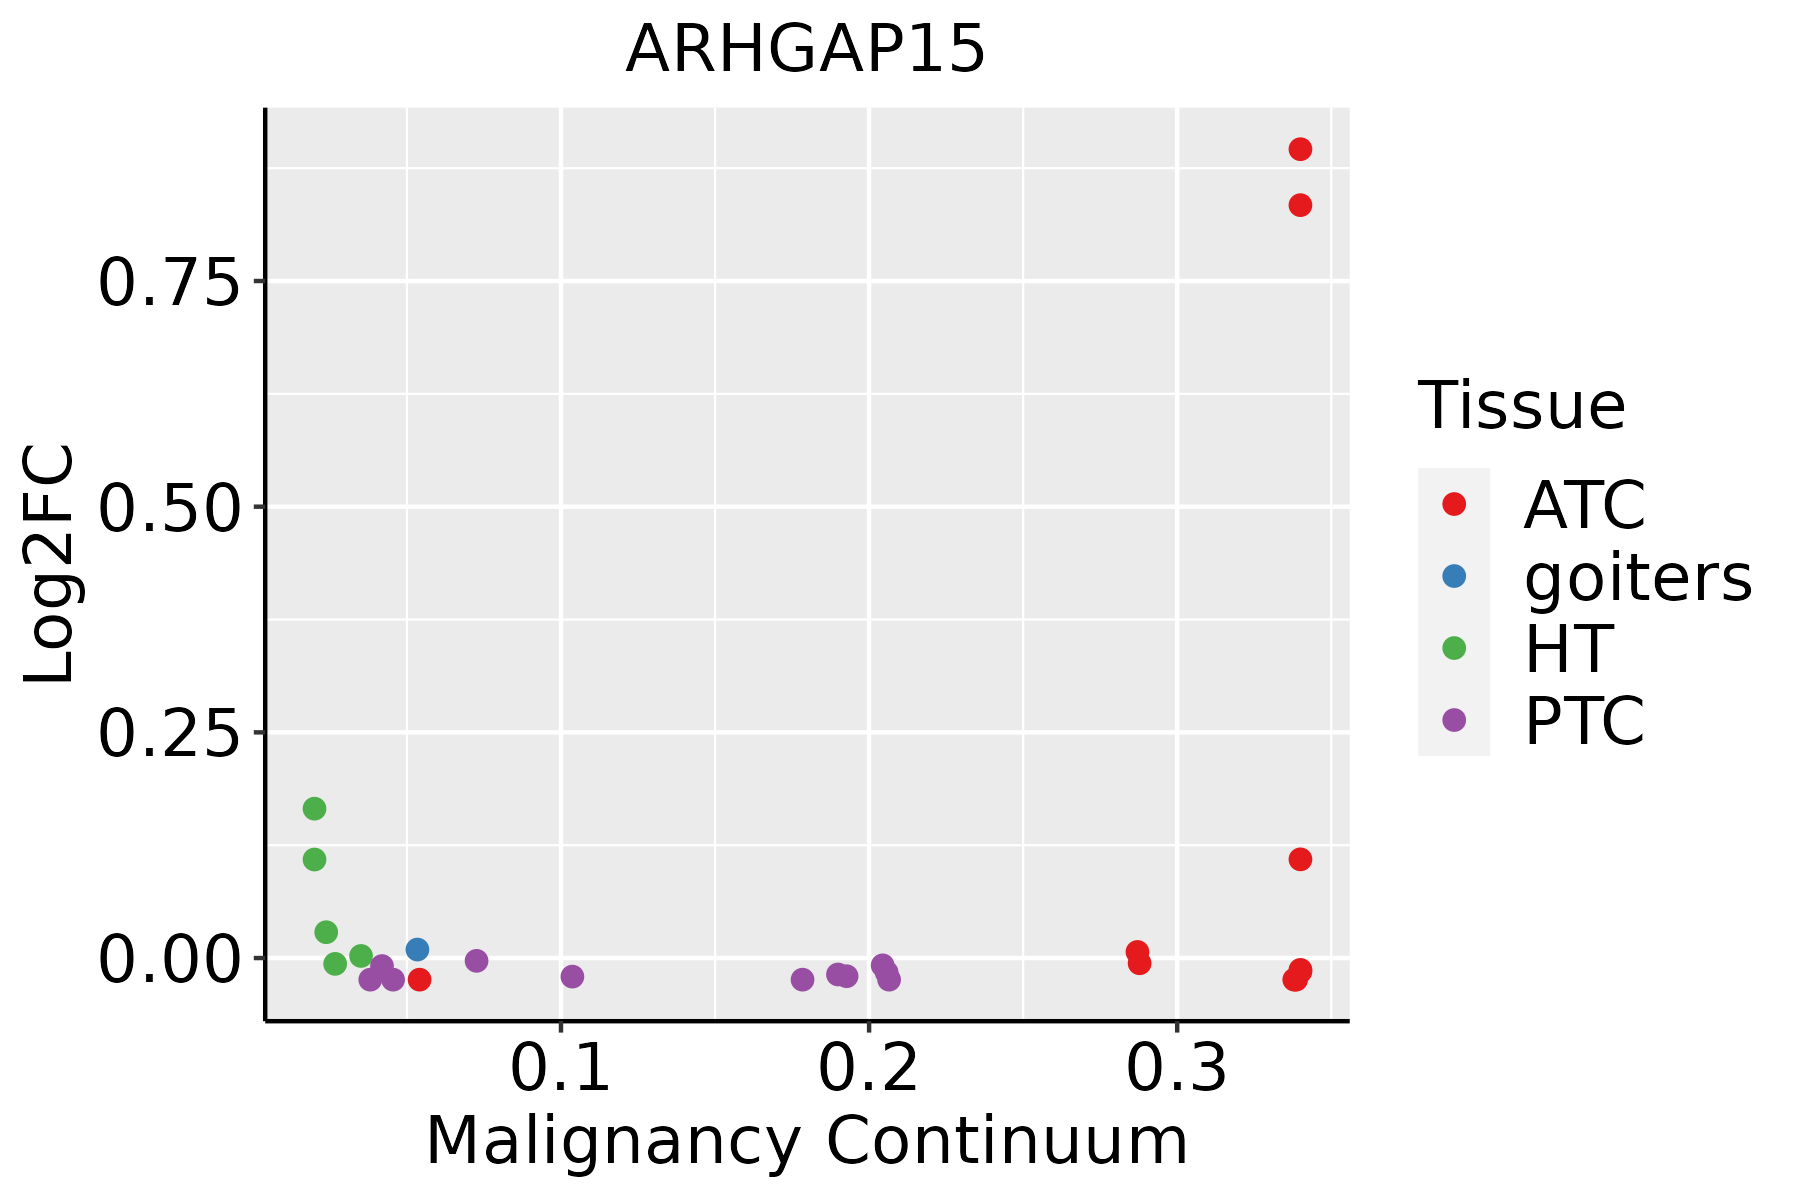 | ATC: Anaplastic thyroid cancer |
| HT: Hashimoto's thyroiditis | ||
| PTC: Papillary thyroid cancer |
| ∗log2FC in expression of this searched gene in stem-like cells from each diseased tissue sample relative to stem-like cells in normal samples in each tissue plotted against the malignancy continuum. Samples are colored based on if they are from different disease stage. |
Top |
Malignant transformation related pathway analysis |
| Find out the enriched GO biological processes and KEGG pathways involved in transition from healthy to precancer to cancer |
| Tissue | Disease Stage | Enriched GO biological Processes |
| Colorectum | AD |  |
| Colorectum | SER |  |
| Colorectum | MSS |  |
| Colorectum | MSI-H |  |
| Colorectum | FAP |  |
| ∗Top 15 enriched GO BP terms are showed in the bar plot of each disease state in each tissue. Each row represents a significant GO biological process which is colored according to the -log10(p.adjust). |
| Page: 1 2 3 4 5 6 7 8 9 |
| GO ID | Tissue | Disease Stage | Description | Gene Ratio | Bg Ratio | pvalue | p.adjust | Count |
| GO:002260425 | Oral cavity | EOLP | regulation of cell morphogenesis | 69/2218 | 309/18723 | 1.21e-07 | 4.01e-06 | 69 |
| GO:000836024 | Oral cavity | EOLP | regulation of cell shape | 37/2218 | 154/18723 | 1.80e-05 | 2.90e-04 | 37 |
| GO:004308714 | Oral cavity | EOLP | regulation of GTPase activity | 66/2218 | 348/18723 | 6.92e-05 | 8.55e-04 | 66 |
| GO:00510569 | Oral cavity | EOLP | regulation of small GTPase mediated signal transduction | 51/2218 | 302/18723 | 5.67e-03 | 2.92e-02 | 51 |
| GO:002260433 | Oral cavity | NEOLP | regulation of cell morphogenesis | 69/2005 | 309/18723 | 2.07e-09 | 1.29e-07 | 69 |
| GO:000836033 | Oral cavity | NEOLP | regulation of cell shape | 41/2005 | 154/18723 | 2.35e-08 | 1.03e-06 | 41 |
| GO:005105614 | Oral cavity | NEOLP | regulation of small GTPase mediated signal transduction | 49/2005 | 302/18723 | 2.04e-03 | 1.36e-02 | 49 |
| GO:004308722 | Oral cavity | NEOLP | regulation of GTPase activity | 54/2005 | 348/18723 | 3.36e-03 | 2.00e-02 | 54 |
| GO:002260429 | Thyroid | ATC | regulation of cell morphogenesis | 171/6293 | 309/18723 | 2.36e-15 | 1.70e-13 | 171 |
| GO:000836026 | Thyroid | ATC | regulation of cell shape | 91/6293 | 154/18723 | 7.33e-11 | 2.31e-09 | 91 |
| GO:005105618 | Thyroid | ATC | regulation of small GTPase mediated signal transduction | 141/6293 | 302/18723 | 1.43e-06 | 1.77e-05 | 141 |
| GO:004308719 | Thyroid | ATC | regulation of GTPase activity | 153/6293 | 348/18723 | 3.24e-05 | 2.68e-04 | 153 |
| Page: 1 |
| Pathway ID | Tissue | Disease Stage | Description | Gene Ratio | Bg Ratio | pvalue | p.adjust | qvalue | Count |
| Page: 1 |
Top |
Cell-cell communication analysis |
| Identification of potential cell-cell interactions between two cell types and their ligand-receptor pairs for different disease states |
| Ligand | Receptor | LRpair | Pathway | Tissue | Disease Stage |
| Page: 1 |
Top |
Single-cell gene regulatory network inference analysis |
| Find out the significant the regulons (TFs) and the target genes of each regulon across cell types for different disease states |
| TF | Cell Type | Tissue | Disease Stage | Target Gene | RSS | Regulon Activity |
| ∗The dot plots of a searched regulon are shown for all cell subpopulations in each disease state of each tissue based on the regulon specific score inferred using pySCENIC and by calculating the average expression. |
| Page: 1 |
Top |
Somatic mutation of malignant transformation related genes |
| Annotation of somatic variants for genes involved in malignant transformation |
| Hugo Symbol | Variant Class | Variant Classification | dbSNP RS | HGVSc | HGVSp | HGVSp Short | SWISSPROT | BIOTYPE | SIFT | PolyPhen | Tumor Sample Barcode | Tissue | Histology | Sex | Age | Stage | Therapy Types | Drugs | Outcome |
| ARHGAP15 | SNV | Missense_Mutation | c.823N>G | p.Lys275Glu | p.K275E | Q53QZ3 | protein_coding | deleterious(0) | probably_damaging(0.965) | TCGA-A8-A09C-01 | Breast | breast invasive carcinoma | Female | >=65 | I/II | Unknown | Unknown | SD | |
| ARHGAP15 | SNV | Missense_Mutation | rs201268929 | c.274N>T | p.Ala92Ser | p.A92S | Q53QZ3 | protein_coding | tolerated(0.17) | benign(0.304) | TCGA-AC-A3BB-01 | Breast | breast invasive carcinoma | Female | <65 | III/IV | Chemotherapy | cytoxan | CR |
| ARHGAP15 | SNV | Missense_Mutation | c.999C>A | p.Asn333Lys | p.N333K | Q53QZ3 | protein_coding | deleterious(0) | probably_damaging(0.994) | TCGA-D8-A1JL-01 | Breast | breast invasive carcinoma | Female | >=65 | I/II | Unknown | Unknown | SD | |
| ARHGAP15 | SNV | Missense_Mutation | c.552C>G | p.Ile184Met | p.I184M | Q53QZ3 | protein_coding | deleterious(0) | probably_damaging(0.949) | TCGA-E2-A15R-01 | Breast | breast invasive carcinoma | Female | <65 | I/II | Chemotherapy | cyclophosphamide | SD | |
| ARHGAP15 | SNV | Missense_Mutation | c.256C>G | p.Leu86Val | p.L86V | Q53QZ3 | protein_coding | deleterious(0) | probably_damaging(0.951) | TCGA-EW-A1IW-01 | Breast | breast invasive carcinoma | Female | >=65 | I/II | Hormone Therapy | aromasin | SD | |
| ARHGAP15 | SNV | Missense_Mutation | c.456N>A | p.Ser152Arg | p.S152R | Q53QZ3 | protein_coding | deleterious(0.03) | probably_damaging(0.957) | TCGA-A6-2677-01 | Colorectum | colon adenocarcinoma | Female | >=65 | III/IV | Ancillary | leucovorin | SD | |
| ARHGAP15 | SNV | Missense_Mutation | c.1113C>A | p.Phe371Leu | p.F371L | Q53QZ3 | protein_coding | tolerated(0.35) | benign(0.005) | TCGA-AA-3663-01 | Colorectum | colon adenocarcinoma | Male | <65 | I/II | Unknown | Unknown | SD | |
| ARHGAP15 | SNV | Missense_Mutation | rs375193013 | c.529N>G | p.Ile177Val | p.I177V | Q53QZ3 | protein_coding | tolerated(0.07) | benign(0.241) | TCGA-AA-3672-01 | Colorectum | colon adenocarcinoma | Female | >=65 | III/IV | Unknown | Unknown | SD |
| ARHGAP15 | SNV | Missense_Mutation | rs749157476 | c.1133N>T | p.Ala378Val | p.A378V | Q53QZ3 | protein_coding | deleterious(0.04) | probably_damaging(0.99) | TCGA-AA-A02H-01 | Colorectum | colon adenocarcinoma | Female | >=65 | III/IV | Unknown | Unknown | PD |
| ARHGAP15 | SNV | Missense_Mutation | rs758104156 | c.1252G>A | p.Ala418Thr | p.A418T | Q53QZ3 | protein_coding | tolerated(0.41) | benign(0.012) | TCGA-AD-5900-01 | Colorectum | colon adenocarcinoma | Male | >=65 | I/II | Unknown | Unknown | SD |
| Page: 1 2 3 4 5 6 7 8 9 |
Top |
Related drugs of malignant transformation related genes |
| Identification of chemicals and drugs interact with genes involved in malignant transfromation |
| (DGIdb 4.0) |
| Entrez ID | Symbol | Category | Interaction Types | Drug Claim Name | Drug Name | PMIDs |
| Page: 1 |

Copyright 2023-Present -The University of Texas Health Science Center at Houston |