Schematic overview of the cellular and molecular mechanisms involved in the cancer progression, including the proposed cellular and molecular mechanisms in cancer cells trajectory. AT1: alveolar type 1 cells; AT2: alveolar type 2 cells; AAH: atypical adenomatous hyperplasia; AIS: adenocarcinoma in situ; MIA: minimally invasive adenocarcinoma; IA: invasive adenocarcinoma; EMT: epithelial-mesenchymal transition

Home

Download

Statistics

Help

Contact

Center for Computational Systems Medicine
leaf

Gene summary

leaf

Malignant transformation analysis

leaf

Malignant transformation related pathway analysis

leaf

Cell-cell communication analysis

leaf

Single-cell gene regulatory network inference analysis

leaf

Somatic mutation of malignant transformation related genes

leaf

Related drugs of malignant transformation related genes

Gene: ARHGAP12

Gene summary for ARHGAP12

check button Gene summary.

Gene informationSpeciesHuman
Gene symbol

ARHGAP12

Gene ID

94134

Gene nameRho GTPase activating protein 12
Gene AliasARHGAP12
Cytomap10p11.22
Gene Typeprotein-coding
GO ID

GO:0002009

UniProtAcc

Q8IWW6


Top

Malignant transformation analysis

check button Identification of the aberrant gene expression in precancerous and cancerous lesions by comparing the gene expression of stem-like cells in diseased tissues with normal stem cells
check button Malignant transformation involving gene list.
Entrez IDSymbolReplicatesSpeciesOrganTissueAdj P-valueLog2FCMalignancy
94134ARHGAP12HTA11_3410_2000001011HumanColorectumAD2.69e-17-6.06e-010.0155
94134ARHGAP12HTA11_2951_2000001011HumanColorectumAD4.20e-02-7.04e-010.0216
94134ARHGAP12HTA11_3361_2000001011HumanColorectumAD1.75e-03-5.26e-01-0.1207
94134ARHGAP12HTA11_696_2000001011HumanColorectumAD8.54e-11-4.19e-01-0.1464
94134ARHGAP12HTA11_866_3004761011HumanColorectumAD3.15e-05-4.59e-010.096
94134ARHGAP12HTA11_10711_2000001011HumanColorectumAD5.48e-04-5.01e-010.0338
94134ARHGAP12HTA11_7696_3000711011HumanColorectumAD2.44e-12-4.98e-010.0674
94134ARHGAP12HTA11_99999973899_84307HumanColorectumMSS3.47e-03-5.35e-010.2585
94134ARHGAP12HTA11_99999974143_84620HumanColorectumMSS2.79e-14-4.78e-010.3005
94134ARHGAP12A001-C-207HumanColorectumFAP1.77e-02-5.36e-020.1278
94134ARHGAP12A015-C-203HumanColorectumFAP3.06e-32-4.19e-01-0.1294
94134ARHGAP12A015-C-204HumanColorectumFAP3.69e-08-3.45e-01-0.0228
94134ARHGAP12A014-C-040HumanColorectumFAP3.99e-03-2.72e-01-0.1184
94134ARHGAP12A002-C-201HumanColorectumFAP5.17e-14-3.21e-010.0324
94134ARHGAP12A002-C-203HumanColorectumFAP1.02e-03-1.08e-010.2786
94134ARHGAP12A001-C-119HumanColorectumFAP3.69e-06-3.72e-01-0.1557
94134ARHGAP12A001-C-108HumanColorectumFAP1.57e-15-1.93e-01-0.0272
94134ARHGAP12A002-C-205HumanColorectumFAP1.09e-23-4.16e-01-0.1236
94134ARHGAP12A001-C-104HumanColorectumFAP9.47e-05-8.67e-020.0184
94134ARHGAP12A015-C-005HumanColorectumFAP1.48e-03-2.49e-01-0.0336
Page: 1 2 3 4 5 6 7 8 

check button Transcriptomic changes along malignancy continuum.
TissueExpression DynamicsAbbreviation
Colorectum (GSE201348)The image shows the transcriptomic changes along malignancy continuum.log2FC in expression of this searched gene in stem-like cells from each diseased tissue sample relative to stem-like cells in normal samples in each tissue plotted against the malignancy continuum. Samples are colored based on if they are from different disease stage.FAP: Familial adenomatous polyposis
CRC: Colorectal cancer
Colorectum (HTA11)The image shows the transcriptomic changes along malignancy continuum.log2FC in expression of this searched gene in stem-like cells from each diseased tissue sample relative to stem-like cells in normal samples in each tissue plotted against the malignancy continuum. Samples are colored based on if they are from different disease stage.AD: Adenomas
SER: Sessile serrated lesions
MSI-H: Microsatellite-high colorectal cancer
MSS: Microsatellite stable colorectal cancer
EsophagusThe image shows the transcriptomic changes along malignancy continuum.log2FC in expression of this searched gene in stem-like cells from each diseased tissue sample relative to stem-like cells in normal samples in each tissue plotted against the malignancy continuum. Samples are colored based on if they are from different disease stage.ESCC: Esophageal squamous cell carcinoma
HGIN: High-grade intraepithelial neoplasias
LGIN: Low-grade intraepithelial neoplasias
LiverThe image shows the transcriptomic changes along malignancy continuum.log2FC in expression of this searched gene in stem-like cells from each diseased tissue sample relative to stem-like cells in normal samples in each tissue plotted against the malignancy continuum. Samples are colored based on if they are from different disease stage.
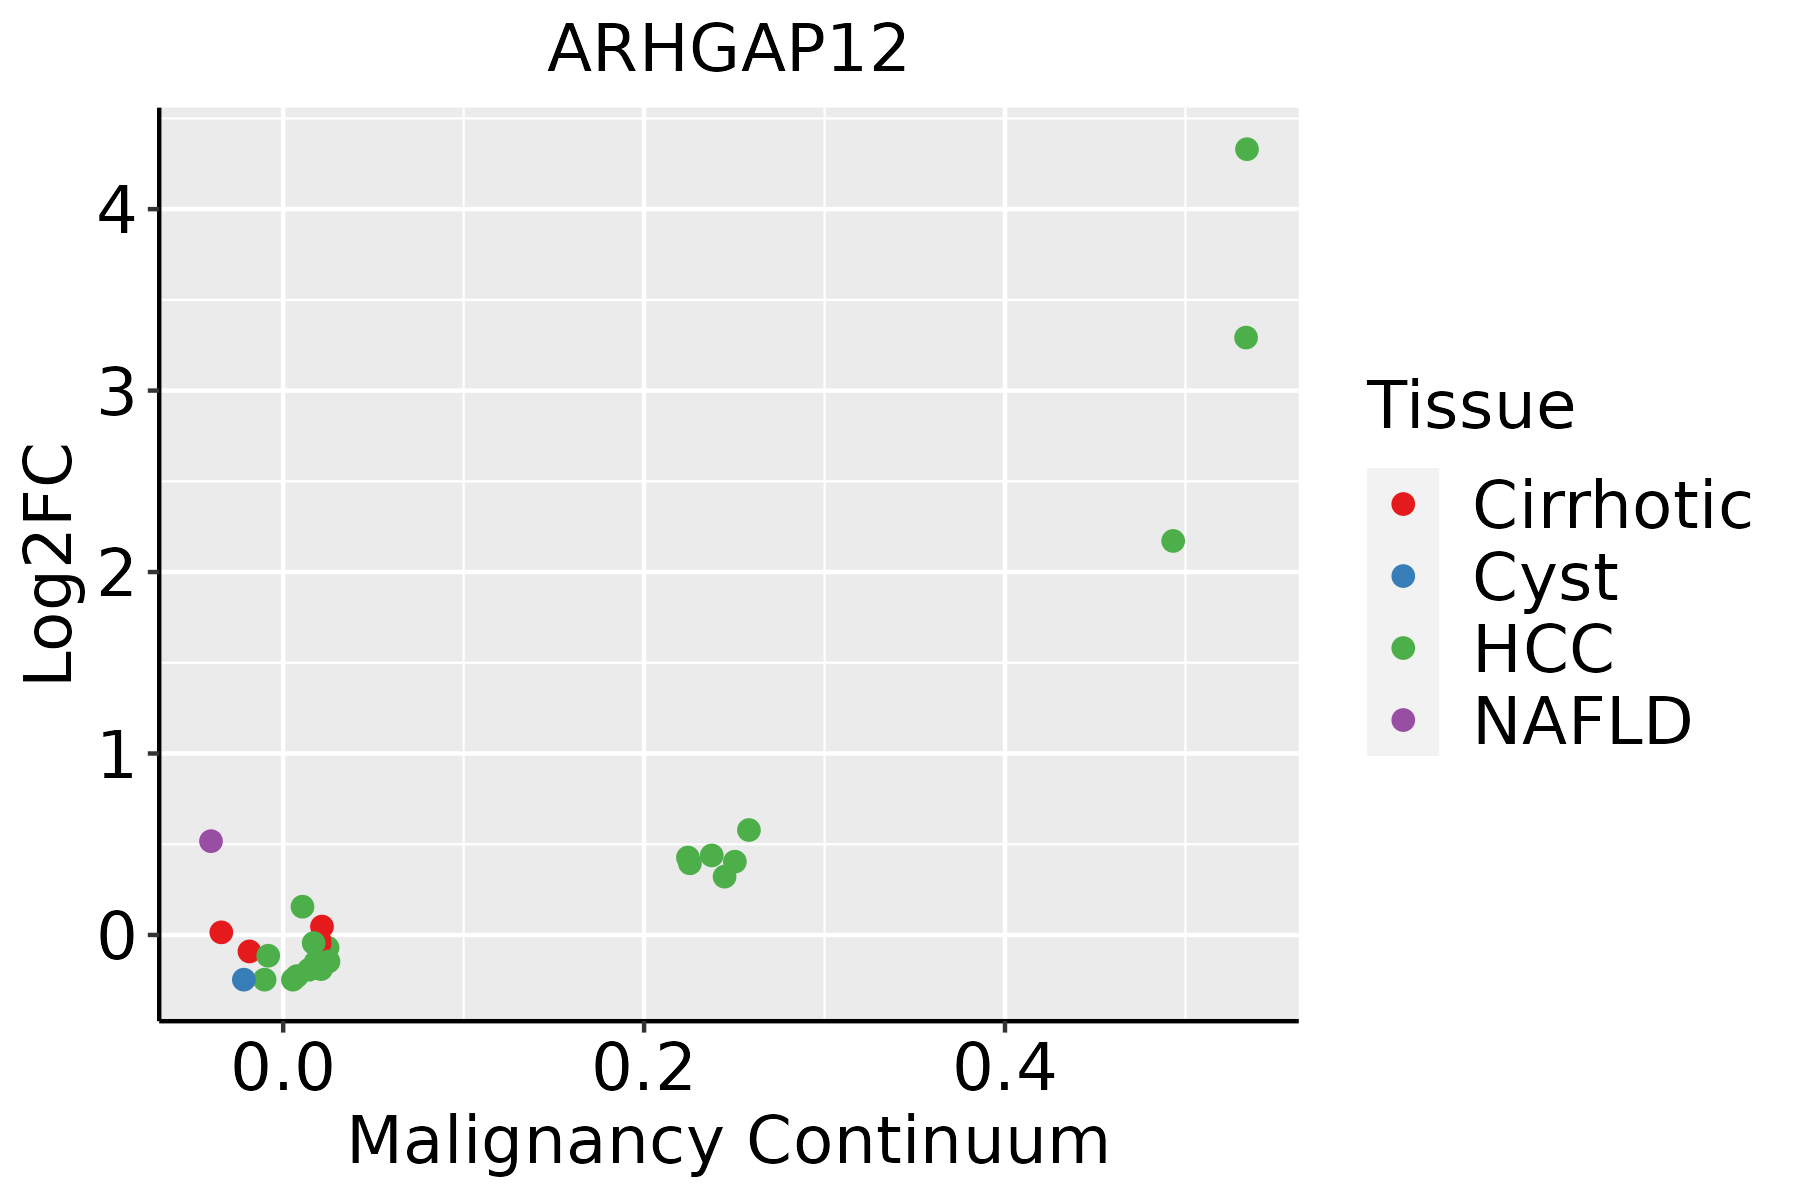
HCC: Hepatocellular carcinoma
NAFLD: Non-alcoholic fatty liver disease
LungThe image shows the transcriptomic changes along malignancy continuum.log2FC in expression of this searched gene in stem-like cells from each diseased tissue sample relative to stem-like cells in normal samples in each tissue plotted against the malignancy continuum. Samples are colored based on if they are from different disease stage.
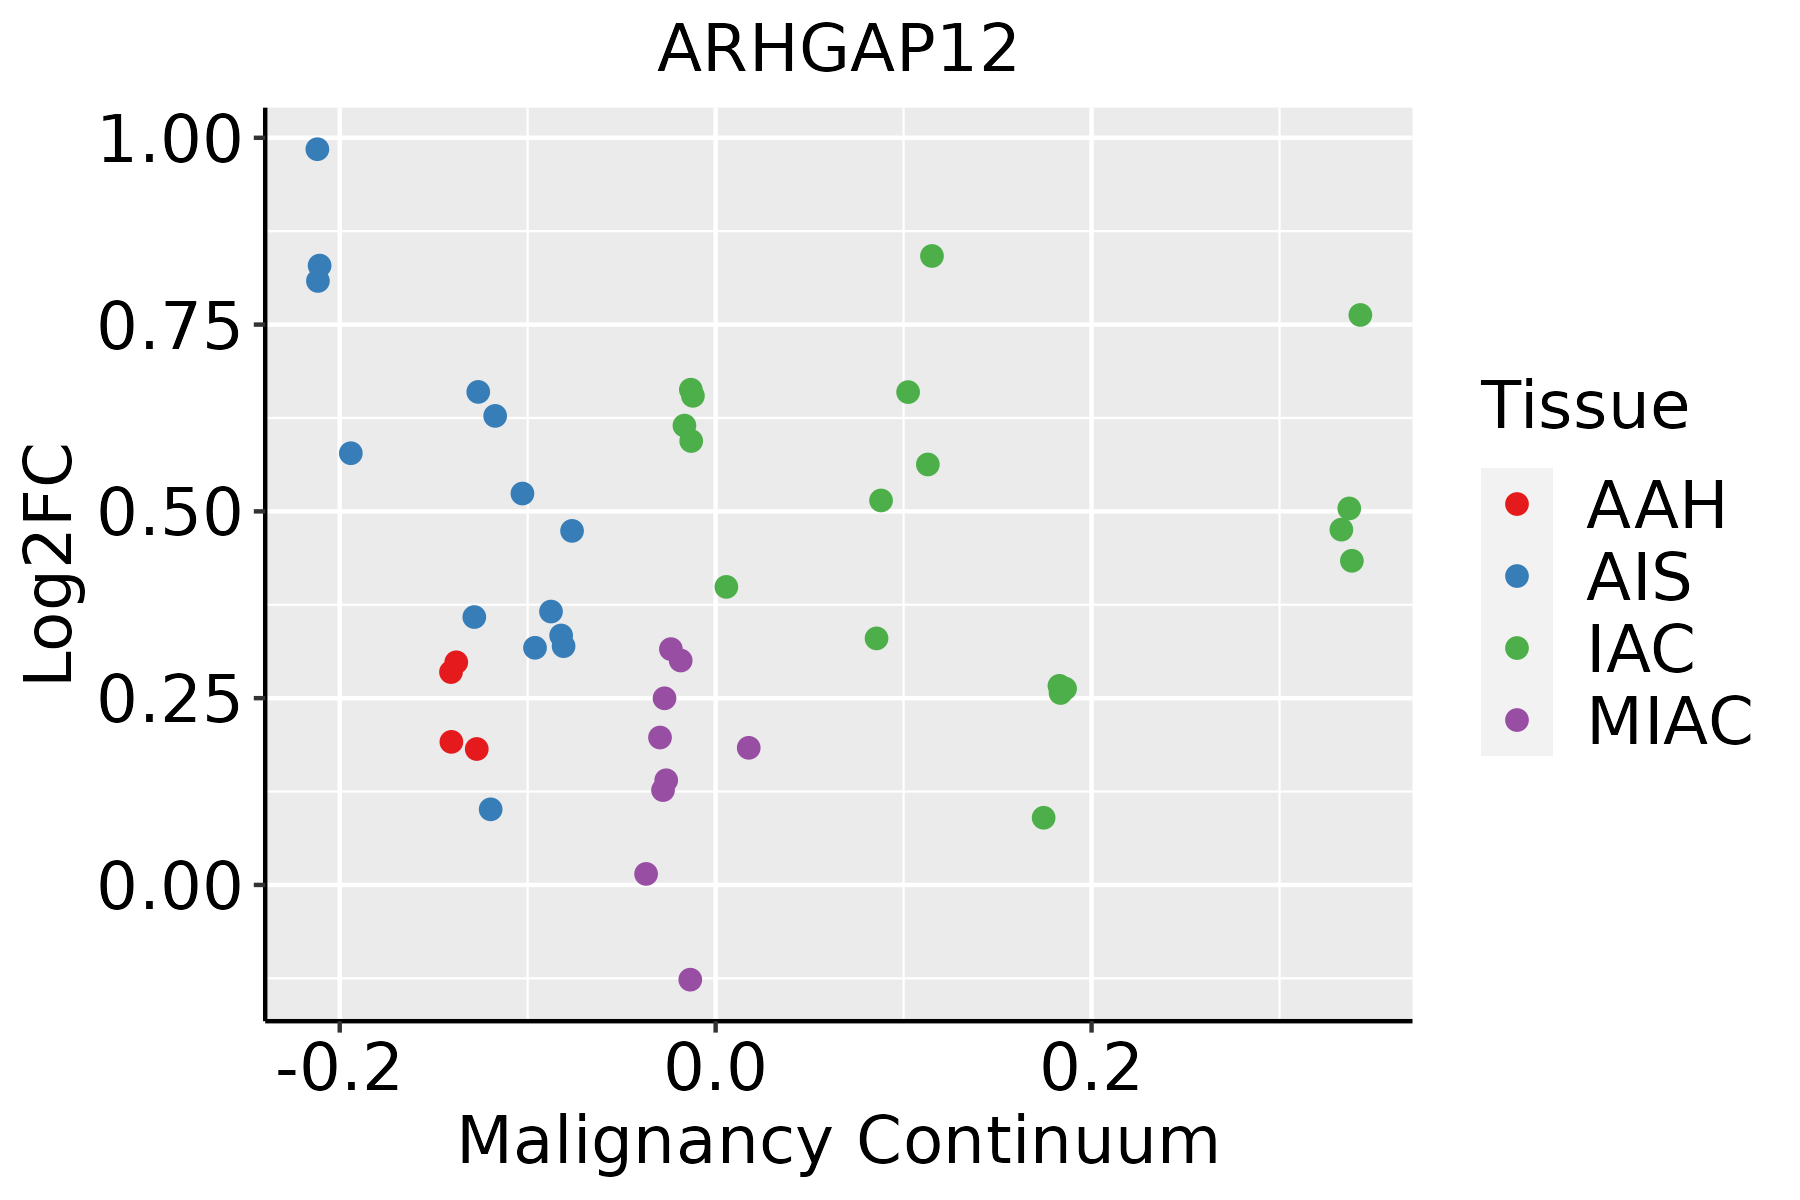
AAH: Atypical adenomatous hyperplasia
AIS: Adenocarcinoma in situ
IAC: Invasive lung adenocarcinoma
MIA: Minimally invasive adenocarcinoma
ProstateThe image shows the transcriptomic changes along malignancy continuum.log2FC in expression of this searched gene in stem-like cells from each diseased tissue sample relative to stem-like cells in normal samples in each tissue plotted against the malignancy continuum. Samples are colored based on if they are from different disease stage.BPH: Benign Prostatic Hyperplasia
ThyroidThe image shows the transcriptomic changes along malignancy continuum.log2FC in expression of this searched gene in stem-like cells from each diseased tissue sample relative to stem-like cells in normal samples in each tissue plotted against the malignancy continuum. Samples are colored based on if they are from different disease stage.
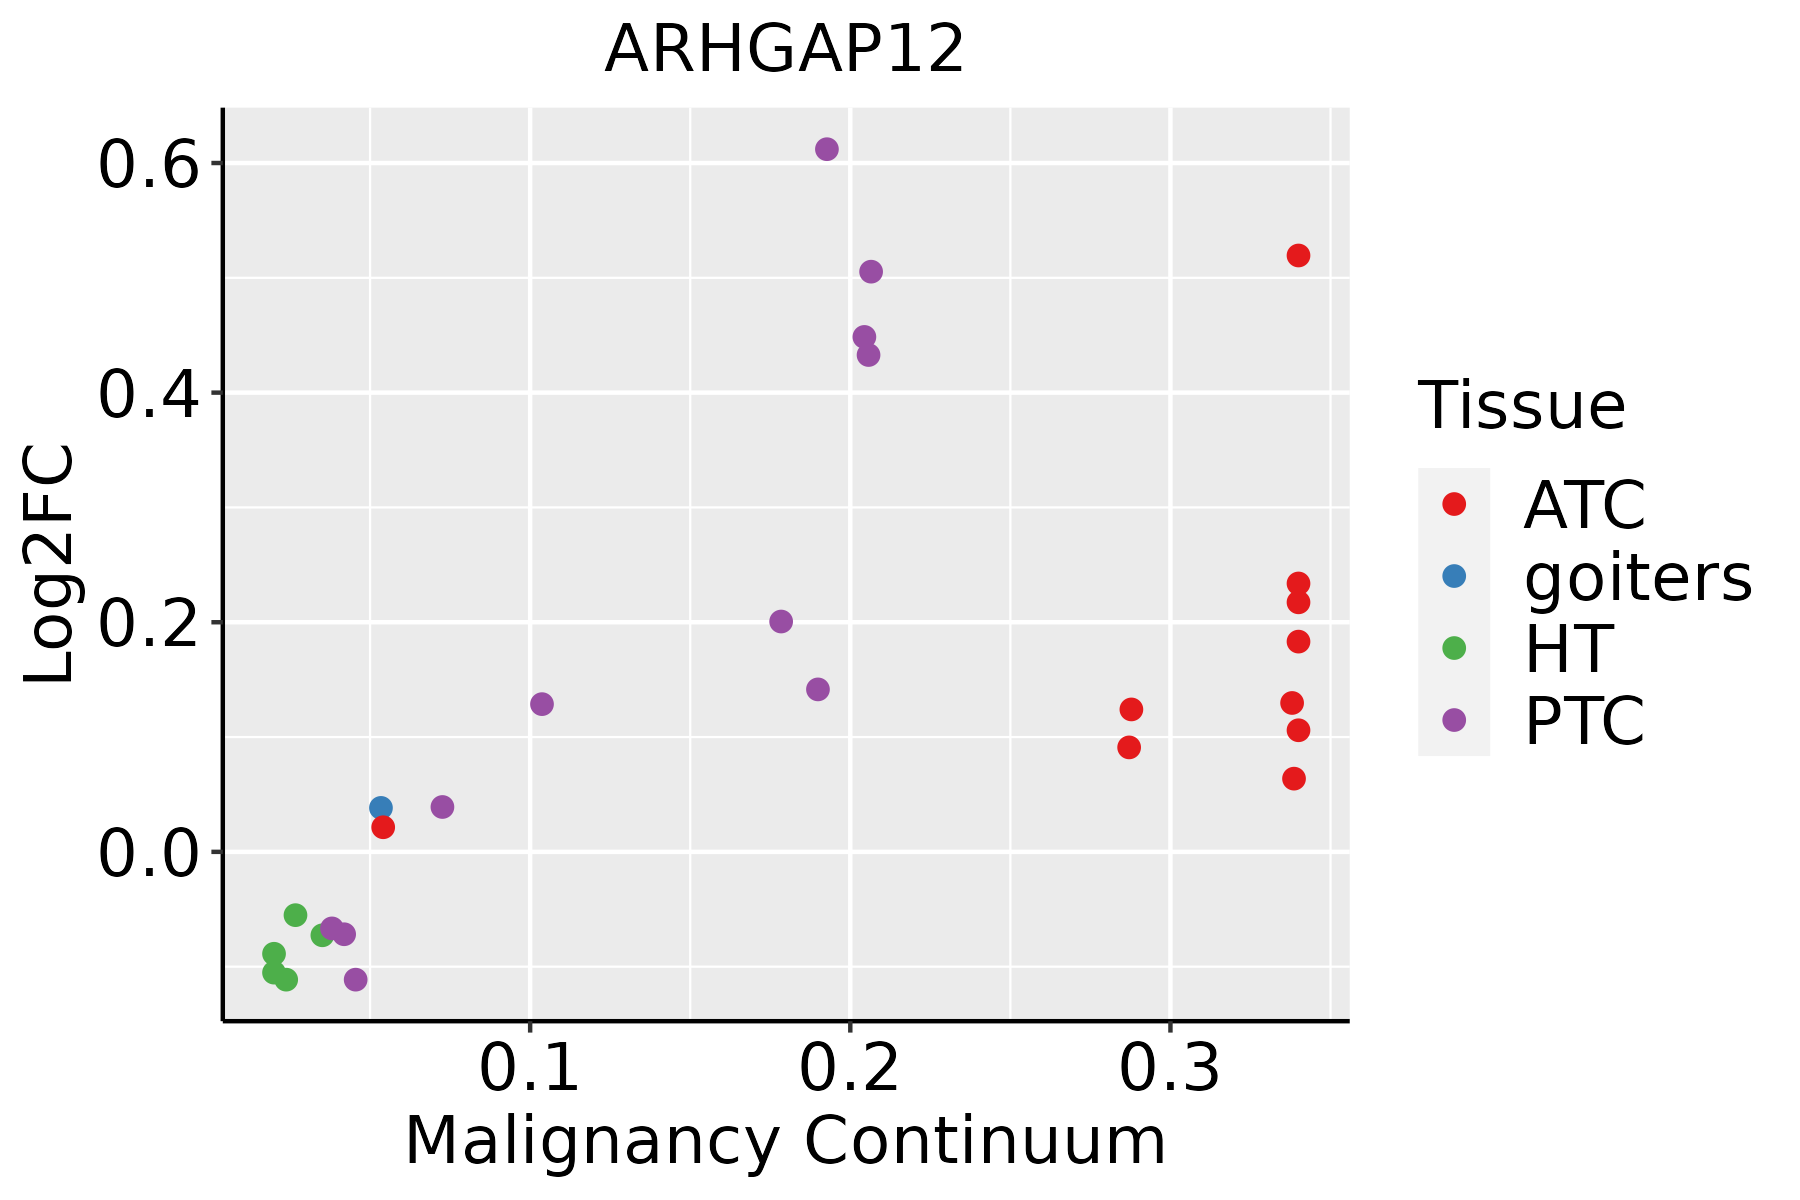
ATC: Anaplastic thyroid cancer
HT: Hashimoto's thyroiditis
PTC: Papillary thyroid cancer
∗log2FC in expression of this searched gene in stem-like cells from each diseased tissue sample relative to stem-like cells in normal samples in each tissue plotted against the malignancy continuum. Samples are colored based on if they are from different disease stage.

Top

Malignant transformation related pathway analysis

check buttonFind out the enriched GO biological processes and KEGG pathways involved in transition from healthy to precancer to cancer
check button Figure of enriched GO biological processes.
TissueDisease StageEnriched GO biological Processes
ColorectumADGO analysis - Figure of enriched GO biological processes: Top 15 enriched GO BP terms are showed in the bar plot of each disease state in each tissue. Each row represents a significant GO biological process which is colored according to the -log10(p.adjust).
ColorectumSERGO analysis - Figure of enriched GO biological processes: Top 15 enriched GO BP terms are showed in the bar plot of each disease state in each tissue. Each row represents a significant GO biological process which is colored according to the -log10(p.adjust).
ColorectumMSSGO analysis - Figure of enriched GO biological processes: Top 15 enriched GO BP terms are showed in the bar plot of each disease state in each tissue. Each row represents a significant GO biological process which is colored according to the -log10(p.adjust).
ColorectumMSI-HGO analysis - Figure of enriched GO biological processes: Top 15 enriched GO BP terms are showed in the bar plot of each disease state in each tissue. Each row represents a significant GO biological process which is colored according to the -log10(p.adjust).
ColorectumFAPGO analysis - Figure of enriched GO biological processes: Top 15 enriched GO BP terms are showed in the bar plot of each disease state in each tissue. Each row represents a significant GO biological process which is colored according to the -log10(p.adjust).
∗Top 15 enriched GO BP terms are showed in the bar plot of each disease state in each tissue. Each row represents a significant GO biological process which is colored according to the -log10(p.adjust).
Page: 1 2 3 4 5 6 7 8 9 

check button Enriched GO biological processes.
GO IDTissueDisease StageDescriptionGene RatioBg Ratiopvaluep.adjustCount
GO:0007015ColorectumADactin filament organization167/3918442/187231.65e-167.94e-14167
GO:0043087ColorectumADregulation of GTPase activity110/3918348/187231.64e-065.03e-05110
GO:0051056ColorectumADregulation of small GTPase mediated signal transduction94/3918302/187231.81e-053.76e-0494
GO:0051058ColorectumADnegative regulation of small GTPase mediated signal transduction21/391856/187233.26e-032.39e-0221
GO:00070152ColorectumMSSactin filament organization146/3467442/187231.16e-132.67e-11146
GO:00430872ColorectumMSSregulation of GTPase activity101/3467348/187231.00e-063.46e-05101
GO:00510561ColorectumMSSregulation of small GTPase mediated signal transduction82/3467302/187231.31e-041.99e-0382
GO:00070154ColorectumFAPactin filament organization125/2622442/187231.97e-153.03e-12125
GO:00510562ColorectumFAPregulation of small GTPase mediated signal transduction78/2622302/187233.25e-082.85e-0678
GO:00430873ColorectumFAPregulation of GTPase activity85/2622348/187231.20e-077.68e-0685
GO:00510581ColorectumFAPnegative regulation of small GTPase mediated signal transduction16/262256/187233.40e-032.47e-0216
GO:00070155ColorectumCRCactin filament organization104/2078442/187234.75e-147.12e-11104
GO:00510563ColorectumCRCregulation of small GTPase mediated signal transduction69/2078302/187233.34e-099.08e-0769
GO:00430874ColorectumCRCregulation of GTPase activity69/2078348/187231.11e-066.69e-0569
GO:00510582ColorectumCRCnegative regulation of small GTPase mediated signal transduction14/207856/187232.65e-032.42e-0214
GO:000701527EsophagusESCCactin filament organization259/8552442/187232.37e-084.50e-07259
GO:00020115EsophagusESCCmorphogenesis of an epithelial sheet42/855257/187231.62e-051.45e-0442
GO:004308715EsophagusESCCregulation of GTPase activity183/8552348/187235.34e-032.00e-02183
GO:005105610EsophagusESCCregulation of small GTPase mediated signal transduction157/8552302/187231.55e-024.98e-02157
GO:00070157LiverNAFLDactin filament organization78/1882442/187235.44e-073.21e-0578
Page: 1 2 3 

check button Enriched KEGG pathways.
Pathway IDTissueDisease StageDescriptionGene RatioBg Ratiopvaluep.adjustqvalueCount
Page: 1 

Top

Cell-cell communication analysis

check buttonIdentification of potential cell-cell interactions between two cell types and their ligand-receptor pairs for different disease states
LigandReceptorLRpairPathwayTissueDisease Stage
Page: 1 

Top

Single-cell gene regulatory network inference analysis

check buttonFind out the significant the regulons (TFs) and the target genes of each regulon across cell types for different disease states
TFCell TypeTissueDisease StageTarget GeneRSSRegulon Activity
∗The dot plots of a searched regulon are shown for all cell subpopulations in each disease state of each tissue based on the regulon specific score inferred using pySCENIC and by calculating the average expression.
Page: 1 

Top

Somatic mutation of malignant transformation related genes

check buttonAnnotation of somatic variants for genes involved in malignant transformation
Hugo SymbolVariant ClassVariant ClassificationdbSNP RSHGVScHGVSpHGVSp ShortSWISSPROTBIOTYPESIFTPolyPhenTumor Sample BarcodeTissueHistologySexAgeStageTherapy TypesDrugsOutcome
ARHGAP12SNVMissense_Mutationc.288N>Cp.Gln96Hisp.Q96HQ8IWW6protein_codingtolerated(0.33)benign(0.001)TCGA-A8-A07I-01Breastbreast invasive carcinomaFemale>=65III/IVChemotherapy5-fluorouracilCR
ARHGAP12SNVMissense_Mutationc.1717A>Gp.Thr573Alap.T573AQ8IWW6protein_codingtolerated(0.23)benign(0.039)TCGA-AN-A041-01Breastbreast invasive carcinomaFemale<65I/IIUnknownUnknownSD
ARHGAP12SNVMissense_Mutationc.60N>Tp.Glu20Aspp.E20DQ8IWW6protein_codingdeleterious(0.03)probably_damaging(0.999)TCGA-B6-A0I8-01Breastbreast invasive carcinomaFemale<65I/IIUnknownUnknownPD
ARHGAP12SNVMissense_Mutationc.1072N>Ap.Asp358Asnp.D358NQ8IWW6protein_codingdeleterious(0)possibly_damaging(0.848)TCGA-B6-A0RG-01Breastbreast invasive carcinomaFemale<65I/IIUnknownUnknownSD
ARHGAP12SNVMissense_Mutationc.359C>Tp.Ser120Leup.S120LQ8IWW6protein_codingdeleterious(0.01)benign(0.177)TCGA-D8-A1J8-01Breastbreast invasive carcinomaFemale>=65I/IIHormone TherapynolvadexSD
ARHGAP12SNVMissense_Mutationc.1379N>Tp.Ser460Ilep.S460IQ8IWW6protein_codingtolerated(0.16)benign(0.003)TCGA-GM-A2DL-01Breastbreast invasive carcinomaFemale<65I/IIHormone TherapytamoxiphenCR
ARHGAP12SNVMissense_Mutationc.2029N>Gp.Ile677Valp.I677VQ8IWW6protein_codingdeleterious(0.02)probably_damaging(0.995)TCGA-GM-A2DM-01Breastbreast invasive carcinomaFemale<65I/IIChemotherapytaxolCR
ARHGAP12SNVMissense_Mutationnovelc.763N>Ap.Ala255Thrp.A255TQ8IWW6protein_codingtolerated(0.19)benign(0.001)TCGA-VS-A9UD-01Cervixcervical & endocervical cancerFemale>=65III/IVChemotherapycisplatinCR
ARHGAP12SNVMissense_Mutationnovelc.2425N>Cp.Gly809Argp.G809RQ8IWW6protein_codingdeleterious(0)probably_damaging(1)TCGA-VS-A9UO-01Cervixcervical & endocervical cancerFemale<65I/IIChemotherapycisplatinCR
ARHGAP12SNVMissense_Mutationnovelc.2188N>Gp.Leu730Valp.L730VQ8IWW6protein_codingdeleterious(0)probably_damaging(0.997)TCGA-ZJ-AAXU-01Cervixcervical & endocervical cancerFemale<65I/IIUnknownUnknownSD
Page: 1 2 3 4 5 6 7 8 9 

Top

Related drugs of malignant transformation related genes

check buttonIdentification of chemicals and drugs interact with genes involved in malignant transfromation
(DGIdb 4.0)
Entrez IDSymbolCategoryInteraction TypesDrug Claim NameDrug NamePMIDs
94134ARHGAP12ENZYMEmethylphenidateMETHYLPHENIDATE29382897
Page: 1