
|
|||||
|
 | |
| |
| |
| |
| |
| |
|
Gene: ARHGAP10 |
Gene summary for ARHGAP10 |
| Gene information | Species | Human | Gene symbol | ARHGAP10 | Gene ID | 79658 |
| Gene name | Rho GTPase activating protein 10 | |
| Gene Alias | GRAF2 | |
| Cytomap | 4q31.23 | |
| Gene Type | protein-coding | GO ID | GO:0006915 | UniProtAcc | A1A4S6 |
Top |
Malignant transformation analysis |
| Identification of the aberrant gene expression in precancerous and cancerous lesions by comparing the gene expression of stem-like cells in diseased tissues with normal stem cells |
| Entrez ID | Symbol | Replicates | Species | Organ | Tissue | Adj P-value | Log2FC | Malignancy |
| 79658 | ARHGAP10 | LZE4T | Human | Esophagus | ESCC | 1.54e-06 | 1.89e-01 | 0.0811 |
| 79658 | ARHGAP10 | P2T-E | Human | Esophagus | ESCC | 2.87e-21 | 4.14e-01 | 0.1177 |
| 79658 | ARHGAP10 | P5T-E | Human | Esophagus | ESCC | 2.25e-03 | 1.20e-01 | 0.1327 |
| 79658 | ARHGAP10 | P8T-E | Human | Esophagus | ESCC | 1.26e-09 | 5.00e-02 | 0.0889 |
| 79658 | ARHGAP10 | P9T-E | Human | Esophagus | ESCC | 7.67e-05 | 2.63e-01 | 0.1131 |
| 79658 | ARHGAP10 | P10T-E | Human | Esophagus | ESCC | 9.31e-16 | 2.18e-01 | 0.116 |
| 79658 | ARHGAP10 | P11T-E | Human | Esophagus | ESCC | 3.66e-10 | 4.81e-01 | 0.1426 |
| 79658 | ARHGAP10 | P12T-E | Human | Esophagus | ESCC | 6.26e-17 | 1.53e-01 | 0.1122 |
| 79658 | ARHGAP10 | P15T-E | Human | Esophagus | ESCC | 2.17e-07 | 2.35e-01 | 0.1149 |
| 79658 | ARHGAP10 | P16T-E | Human | Esophagus | ESCC | 2.30e-12 | 6.32e-02 | 0.1153 |
| 79658 | ARHGAP10 | P20T-E | Human | Esophagus | ESCC | 2.66e-08 | 1.63e-01 | 0.1124 |
| 79658 | ARHGAP10 | P21T-E | Human | Esophagus | ESCC | 3.07e-11 | 2.07e-01 | 0.1617 |
| 79658 | ARHGAP10 | P22T-E | Human | Esophagus | ESCC | 3.94e-11 | 1.53e-01 | 0.1236 |
| 79658 | ARHGAP10 | P24T-E | Human | Esophagus | ESCC | 8.88e-12 | 1.62e-01 | 0.1287 |
| 79658 | ARHGAP10 | P26T-E | Human | Esophagus | ESCC | 9.84e-23 | 4.37e-01 | 0.1276 |
| 79658 | ARHGAP10 | P28T-E | Human | Esophagus | ESCC | 5.66e-08 | 1.94e-01 | 0.1149 |
| 79658 | ARHGAP10 | P31T-E | Human | Esophagus | ESCC | 1.98e-15 | 3.22e-01 | 0.1251 |
| 79658 | ARHGAP10 | P32T-E | Human | Esophagus | ESCC | 4.82e-17 | 3.61e-01 | 0.1666 |
| 79658 | ARHGAP10 | P37T-E | Human | Esophagus | ESCC | 6.50e-13 | 2.88e-01 | 0.1371 |
| 79658 | ARHGAP10 | P39T-E | Human | Esophagus | ESCC | 1.28e-02 | 4.95e-03 | 0.0894 |
| Page: 1 2 3 4 |
| Tissue | Expression Dynamics | Abbreviation |
| Esophagus |  | ESCC: Esophageal squamous cell carcinoma |
| HGIN: High-grade intraepithelial neoplasias | ||
| LGIN: Low-grade intraepithelial neoplasias | ||
| Oral Cavity | 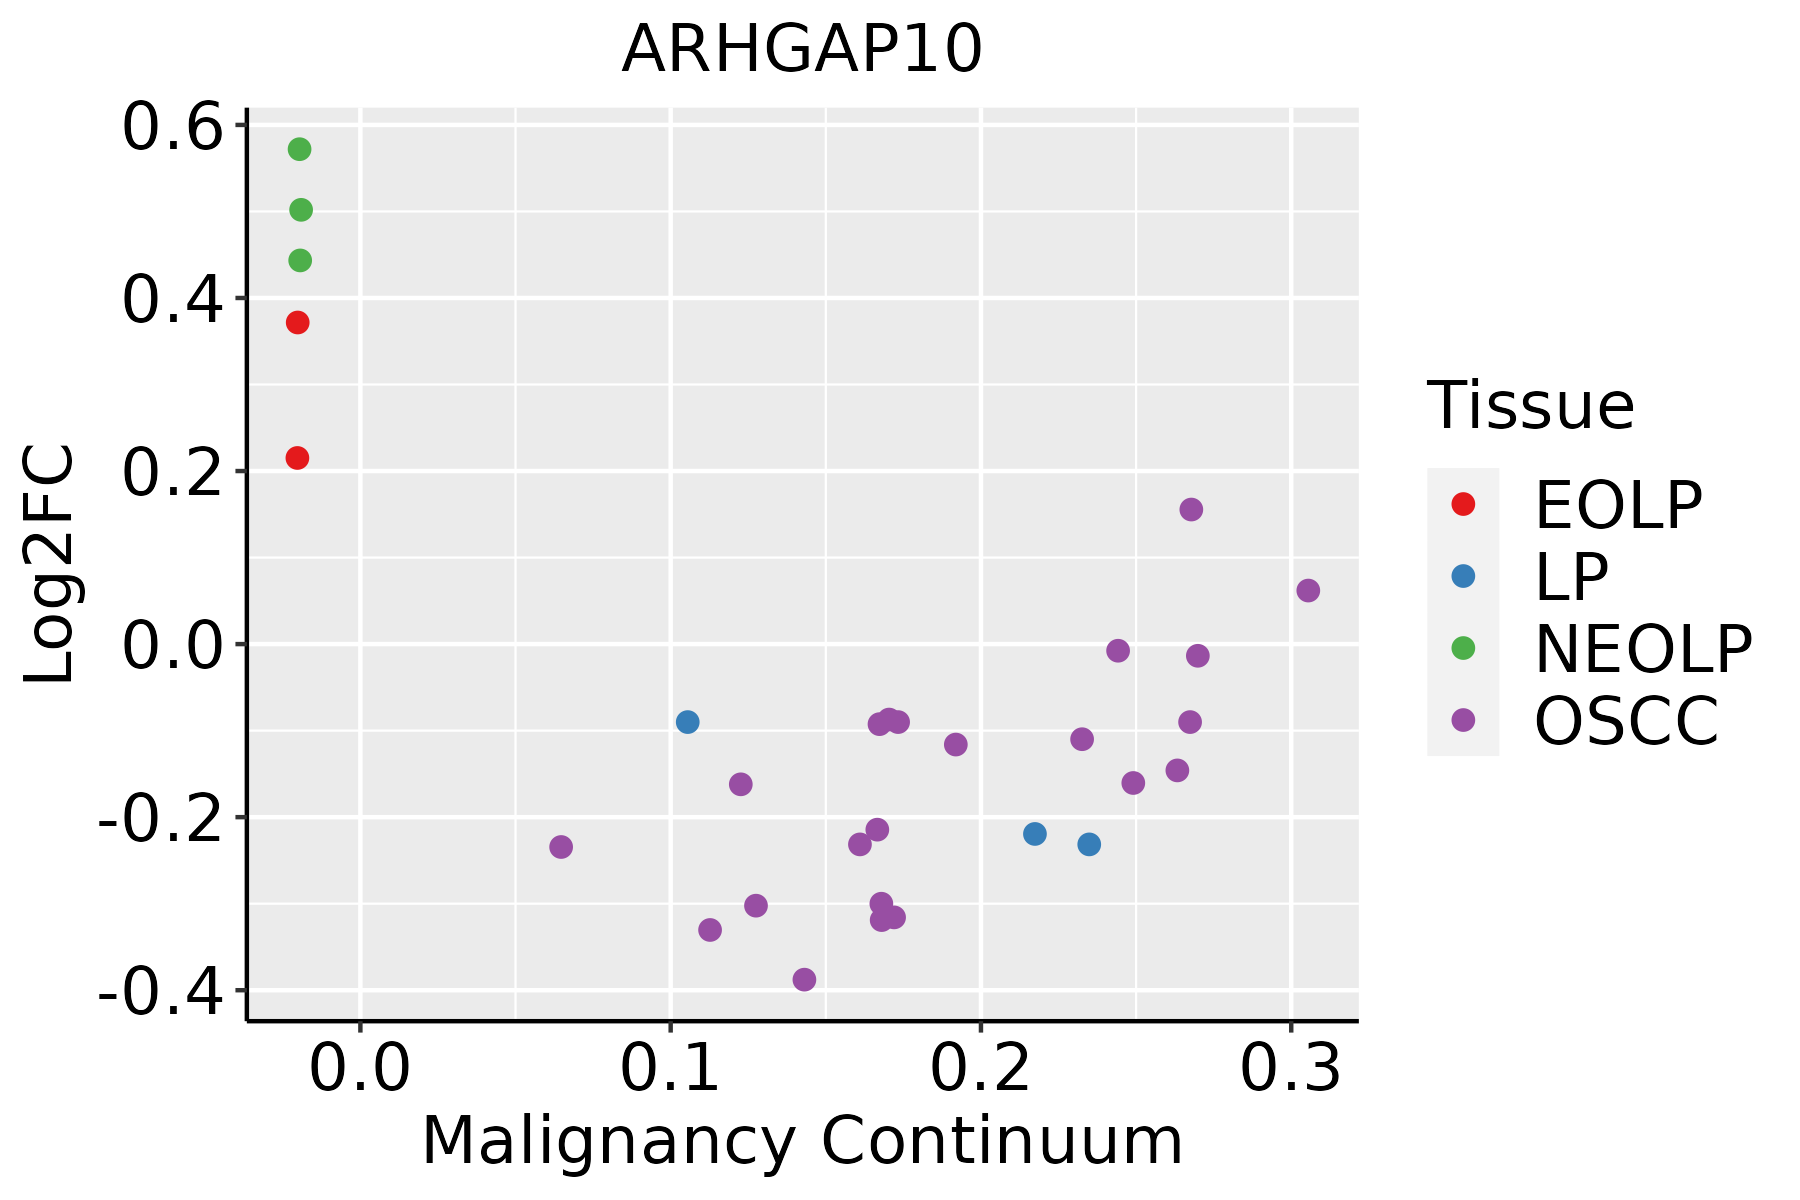 | EOLP: Erosive Oral lichen planus |
| LP: leukoplakia | ||
| NEOLP: Non-erosive oral lichen planus | ||
| OSCC: Oral squamous cell carcinoma | ||
| Prostate | 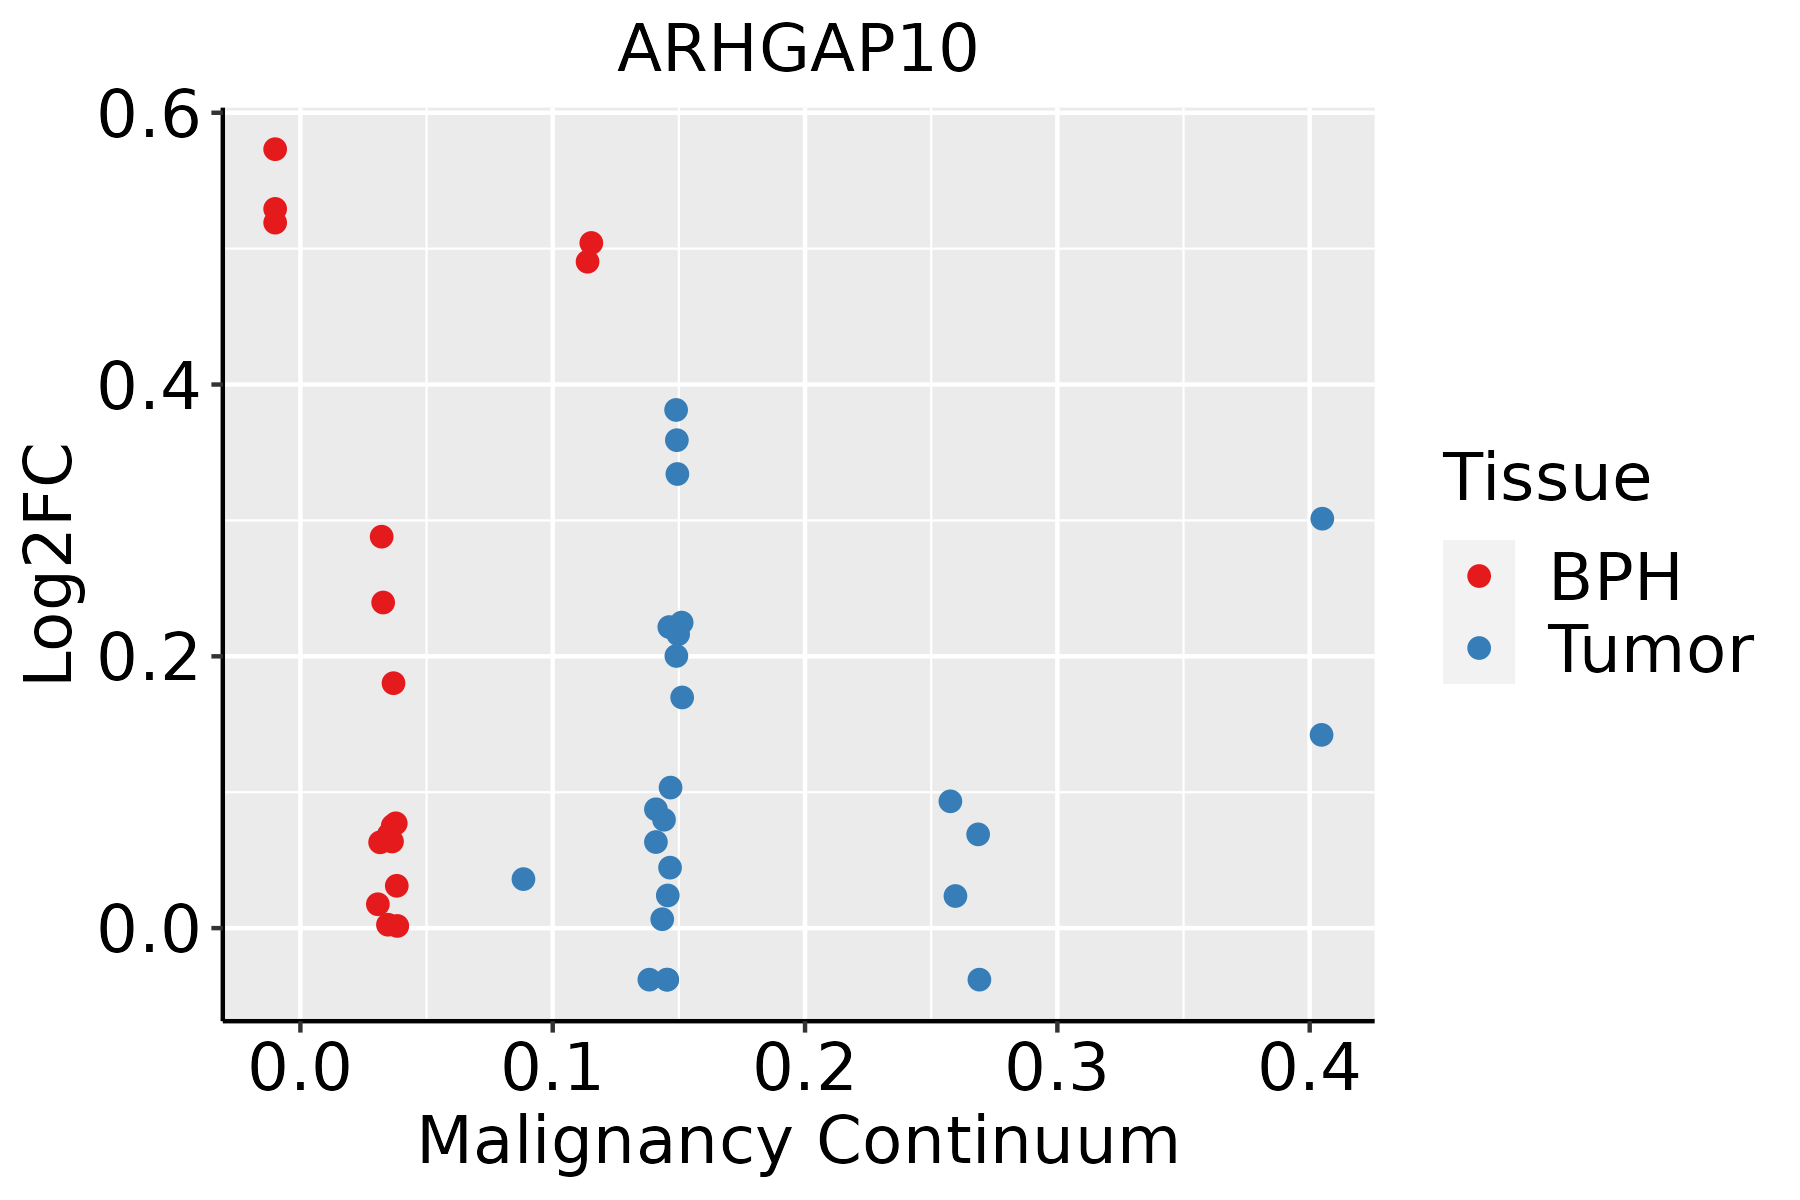 | BPH: Benign Prostatic Hyperplasia |
| Thyroid | 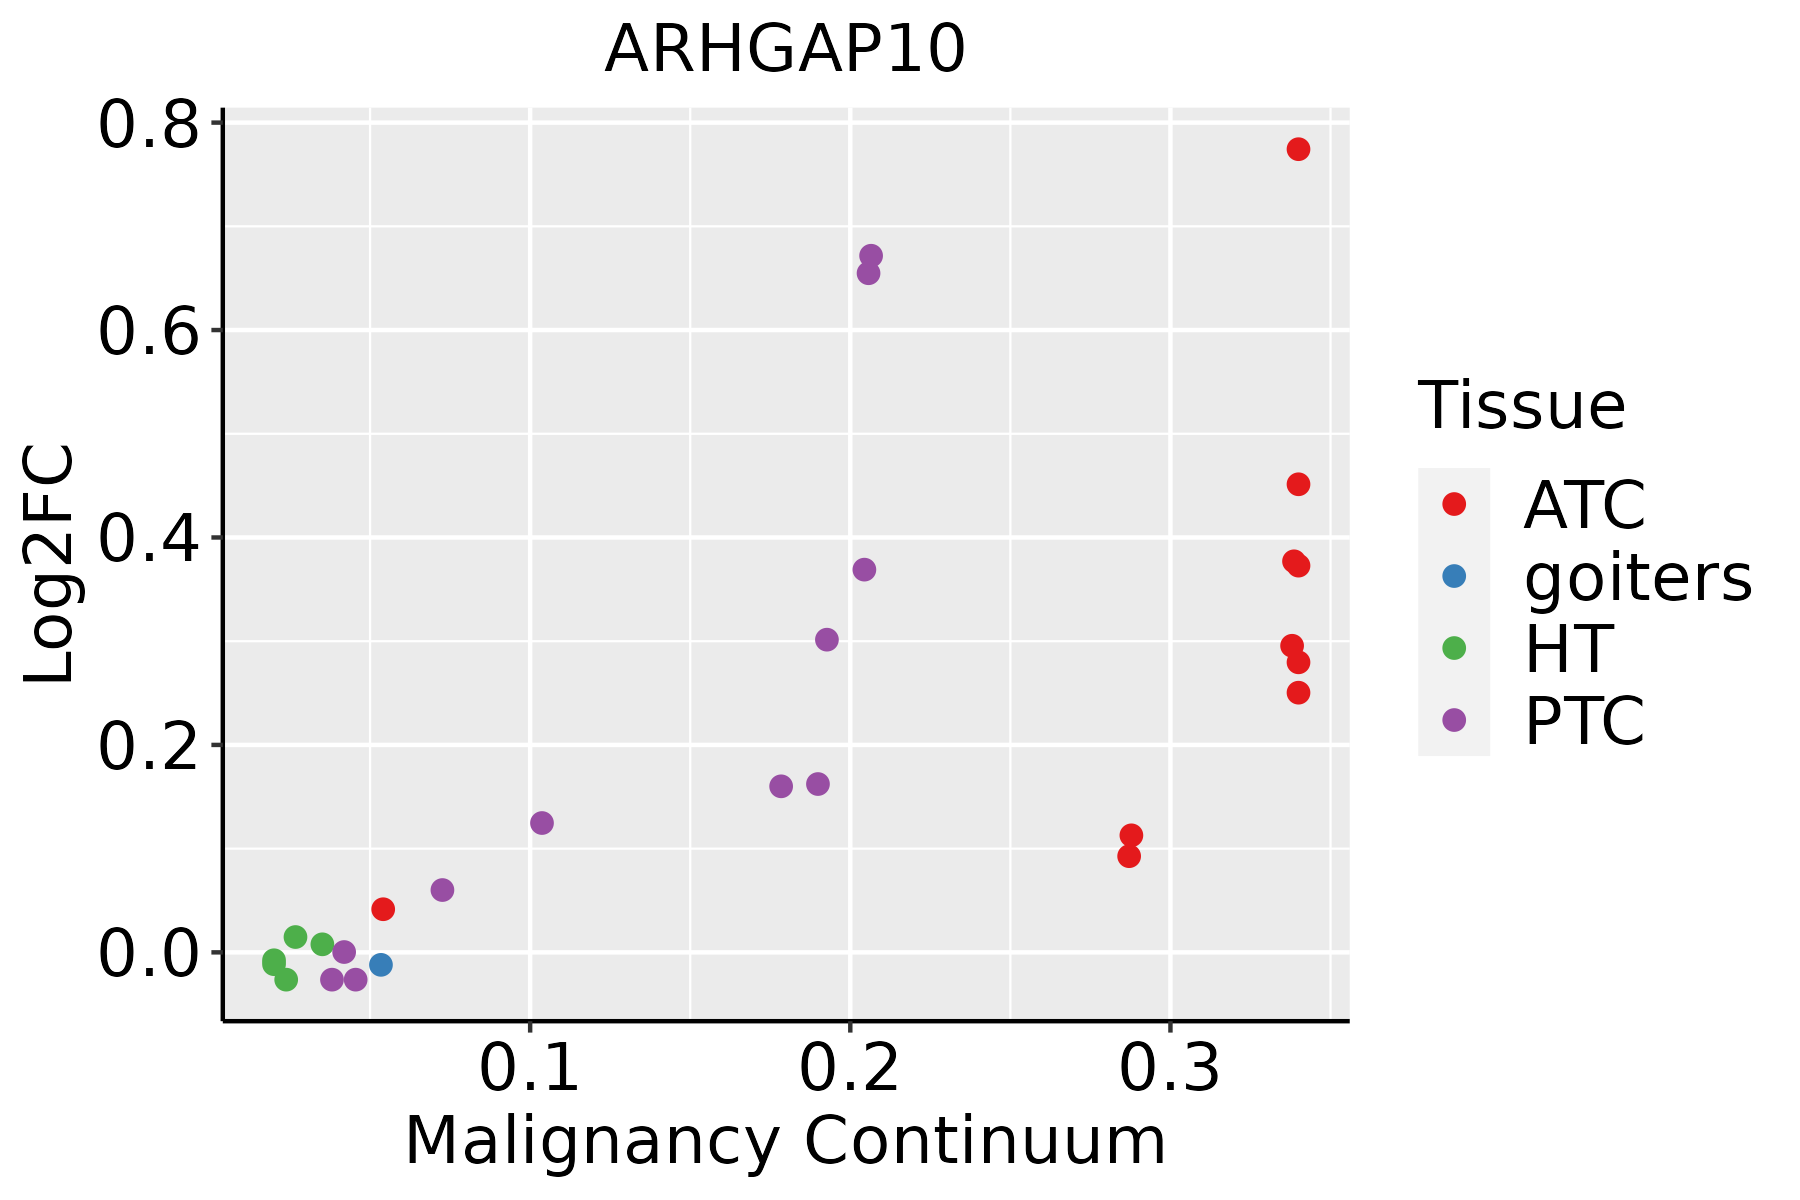 | ATC: Anaplastic thyroid cancer |
| HT: Hashimoto's thyroiditis | ||
| PTC: Papillary thyroid cancer |
| ∗log2FC in expression of this searched gene in stem-like cells from each diseased tissue sample relative to stem-like cells in normal samples in each tissue plotted against the malignancy continuum. Samples are colored based on if they are from different disease stage. |
Top |
Malignant transformation related pathway analysis |
| Find out the enriched GO biological processes and KEGG pathways involved in transition from healthy to precancer to cancer |
| Tissue | Disease Stage | Enriched GO biological Processes |
| Colorectum | AD |  |
| Colorectum | SER |  |
| Colorectum | MSS |  |
| Colorectum | MSI-H |  |
| Colorectum | FAP |  |
| ∗Top 15 enriched GO BP terms are showed in the bar plot of each disease state in each tissue. Each row represents a significant GO biological process which is colored according to the -log10(p.adjust). |
| Page: 1 2 3 4 5 6 7 8 9 |
| GO ID | Tissue | Disease Stage | Description | Gene Ratio | Bg Ratio | pvalue | p.adjust | Count |
| GO:005105610 | Esophagus | ESCC | regulation of small GTPase mediated signal transduction | 157/8552 | 302/18723 | 1.55e-02 | 4.98e-02 | 157 |
| GO:005105614 | Oral cavity | NEOLP | regulation of small GTPase mediated signal transduction | 49/2005 | 302/18723 | 2.04e-03 | 1.36e-02 | 49 |
| GO:00510568 | Prostate | BPH | regulation of small GTPase mediated signal transduction | 78/3107 | 302/18723 | 2.69e-05 | 3.16e-04 | 78 |
| GO:005105613 | Prostate | Tumor | regulation of small GTPase mediated signal transduction | 80/3246 | 302/18723 | 3.96e-05 | 4.57e-04 | 80 |
| GO:005105617 | Thyroid | PTC | regulation of small GTPase mediated signal transduction | 132/5968 | 302/18723 | 9.26e-06 | 1.04e-04 | 132 |
| GO:005105618 | Thyroid | ATC | regulation of small GTPase mediated signal transduction | 141/6293 | 302/18723 | 1.43e-06 | 1.77e-05 | 141 |
| Page: 1 |
| Pathway ID | Tissue | Disease Stage | Description | Gene Ratio | Bg Ratio | pvalue | p.adjust | qvalue | Count |
| hsa05100211 | Esophagus | ESCC | Bacterial invasion of epithelial cells | 59/4205 | 77/8465 | 1.05e-06 | 6.76e-06 | 3.46e-06 | 59 |
| hsa05100310 | Esophagus | ESCC | Bacterial invasion of epithelial cells | 59/4205 | 77/8465 | 1.05e-06 | 6.76e-06 | 3.46e-06 | 59 |
| hsa0510030 | Oral cavity | OSCC | Bacterial invasion of epithelial cells | 48/3704 | 77/8465 | 7.51e-04 | 2.19e-03 | 1.11e-03 | 48 |
| hsa05100113 | Oral cavity | OSCC | Bacterial invasion of epithelial cells | 48/3704 | 77/8465 | 7.51e-04 | 2.19e-03 | 1.11e-03 | 48 |
| hsa0510061 | Oral cavity | NEOLP | Bacterial invasion of epithelial cells | 22/1112 | 77/8465 | 2.55e-04 | 1.62e-03 | 1.02e-03 | 22 |
| hsa0510071 | Oral cavity | NEOLP | Bacterial invasion of epithelial cells | 22/1112 | 77/8465 | 2.55e-04 | 1.62e-03 | 1.02e-03 | 22 |
| hsa0510028 | Prostate | BPH | Bacterial invasion of epithelial cells | 35/1718 | 77/8465 | 5.15e-07 | 4.86e-06 | 3.00e-06 | 35 |
| hsa05100112 | Prostate | BPH | Bacterial invasion of epithelial cells | 35/1718 | 77/8465 | 5.15e-07 | 4.86e-06 | 3.00e-06 | 35 |
| hsa0510029 | Prostate | Tumor | Bacterial invasion of epithelial cells | 36/1791 | 77/8465 | 4.38e-07 | 4.53e-06 | 2.81e-06 | 36 |
| hsa0510037 | Prostate | Tumor | Bacterial invasion of epithelial cells | 36/1791 | 77/8465 | 4.38e-07 | 4.53e-06 | 2.81e-06 | 36 |
| Page: 1 |
Top |
Cell-cell communication analysis |
| Identification of potential cell-cell interactions between two cell types and their ligand-receptor pairs for different disease states |
| Ligand | Receptor | LRpair | Pathway | Tissue | Disease Stage |
| Page: 1 |
Top |
Single-cell gene regulatory network inference analysis |
| Find out the significant the regulons (TFs) and the target genes of each regulon across cell types for different disease states |
| TF | Cell Type | Tissue | Disease Stage | Target Gene | RSS | Regulon Activity |
| ∗The dot plots of a searched regulon are shown for all cell subpopulations in each disease state of each tissue based on the regulon specific score inferred using pySCENIC and by calculating the average expression. |
| Page: 1 |
Top |
Somatic mutation of malignant transformation related genes |
| Annotation of somatic variants for genes involved in malignant transformation |
| Hugo Symbol | Variant Class | Variant Classification | dbSNP RS | HGVSc | HGVSp | HGVSp Short | SWISSPROT | BIOTYPE | SIFT | PolyPhen | Tumor Sample Barcode | Tissue | Histology | Sex | Age | Stage | Therapy Types | Drugs | Outcome |
| ARHGAP10 | SNV | Missense_Mutation | c.1891N>A | p.Glu631Lys | p.E631K | A1A4S6 | protein_coding | tolerated(0.31) | benign(0.115) | TCGA-BH-A0HF-01 | Breast | breast invasive carcinoma | Female | >=65 | I/II | Hormone Therapy | arimidex | SD | |
| ARHGAP10 | SNV | Missense_Mutation | c.759C>G | p.Ile253Met | p.I253M | A1A4S6 | protein_coding | tolerated(1) | benign(0.202) | TCGA-D8-A1JA-01 | Breast | breast invasive carcinoma | Female | <65 | III/IV | Chemotherapy | adriamycin | PD | |
| ARHGAP10 | insertion | In_Frame_Ins | novel | c.2010_2011insGGGGTG | p.Gly670_Asp671insGlyVal | p.G670_D671insGV | A1A4S6 | protein_coding | TCGA-BH-A0AY-01 | Breast | breast invasive carcinoma | Female | <65 | I/II | Chemotherapy | SD | |||
| ARHGAP10 | insertion | Frame_Shift_Ins | novel | c.2012_2013insGGGCTTCTCCCAGTCCCTATTTCCACATGAAGAGC | p.Asp671GlufsTer44 | p.D671Efs*44 | A1A4S6 | protein_coding | TCGA-BH-A0AY-01 | Breast | breast invasive carcinoma | Female | <65 | I/II | Chemotherapy | SD | |||
| ARHGAP10 | SNV | Missense_Mutation | novel | c.224N>T | p.Ala75Val | p.A75V | A1A4S6 | protein_coding | deleterious(0) | possibly_damaging(0.714) | TCGA-C5-A905-01 | Cervix | cervical & endocervical cancer | Female | <65 | I/II | Unknown | Unknown | SD |
| ARHGAP10 | SNV | Missense_Mutation | c.54C>G | p.Phe18Leu | p.F18L | A1A4S6 | protein_coding | deleterious(0.03) | benign(0.011) | TCGA-Q1-A73O-01 | Cervix | cervical & endocervical cancer | Female | <65 | I/II | Chemotherapy | cisplatin | CR | |
| ARHGAP10 | SNV | Missense_Mutation | rs145234400 | c.1651N>A | p.Ala551Thr | p.A551T | A1A4S6 | protein_coding | deleterious(0) | possibly_damaging(0.81) | TCGA-A6-2686-01 | Colorectum | colon adenocarcinoma | Female | >=65 | I/II | Unknown | Unknown | SD |
| ARHGAP10 | SNV | Missense_Mutation | novel | c.103N>C | p.Phe35Leu | p.F35L | A1A4S6 | protein_coding | tolerated(0.06) | benign(0.444) | TCGA-AA-3984-01 | Colorectum | colon adenocarcinoma | Female | <65 | I/II | Unknown | Unknown | SD |
| ARHGAP10 | SNV | Missense_Mutation | c.353N>C | p.Lys118Thr | p.K118T | A1A4S6 | protein_coding | deleterious(0.03) | benign(0) | TCGA-AA-A010-01 | Colorectum | colon adenocarcinoma | Female | <65 | I/II | Chemotherapy | folinic | CR | |
| ARHGAP10 | SNV | Missense_Mutation | novel | c.1715N>T | p.Lys572Met | p.K572M | A1A4S6 | protein_coding | deleterious(0) | benign(0.267) | TCGA-AM-5820-01 | Colorectum | colon adenocarcinoma | Female | <65 | I/II | Unknown | Unknown | SD |
| Page: 1 2 3 4 5 6 7 8 9 |
Top |
Related drugs of malignant transformation related genes |
| Identification of chemicals and drugs interact with genes involved in malignant transfromation |
| (DGIdb 4.0) |
| Entrez ID | Symbol | Category | Interaction Types | Drug Claim Name | Drug Name | PMIDs |
| Page: 1 |

Copyright 2023-Present -The University of Texas Health Science Center at Houston |