
|
|||||
|
 | |
| |
| |
| |
| |
| |
|
Gene: ARG1 |
Gene summary for ARG1 |
| Gene information | Species | Human | Gene symbol | ARG1 | Gene ID | 383 |
| Gene name | arginase 1 | |
| Gene Alias | ARG1 | |
| Cytomap | 6q23.2 | |
| Gene Type | protein-coding | GO ID | GO:0000003 | UniProtAcc | P05089 |
Top |
Malignant transformation analysis |
| Identification of the aberrant gene expression in precancerous and cancerous lesions by comparing the gene expression of stem-like cells in diseased tissues with normal stem cells |
| Entrez ID | Symbol | Replicates | Species | Organ | Tissue | Adj P-value | Log2FC | Malignancy |
| 383 | ARG1 | NAFLD1 | Human | Liver | NAFLD | 2.74e-10 | 1.20e+00 | -0.04 |
| 383 | ARG1 | S41 | Human | Liver | Cirrhotic | 1.98e-02 | 7.14e-01 | -0.0343 |
| 383 | ARG1 | S43 | Human | Liver | Cirrhotic | 5.32e-07 | -2.13e-01 | -0.0187 |
| 383 | ARG1 | HCC1_Meng | Human | Liver | HCC | 4.32e-31 | -2.36e-01 | 0.0246 |
| 383 | ARG1 | HCC2_Meng | Human | Liver | HCC | 8.79e-13 | -3.47e-01 | 0.0107 |
| 383 | ARG1 | cirrhotic1 | Human | Liver | Cirrhotic | 9.64e-09 | -3.17e-01 | 0.0202 |
| 383 | ARG1 | cirrhotic2 | Human | Liver | Cirrhotic | 2.79e-10 | -3.43e-01 | 0.0201 |
| 383 | ARG1 | HCC1 | Human | Liver | HCC | 6.61e-15 | 5.32e+00 | 0.5336 |
| 383 | ARG1 | HCC2 | Human | Liver | HCC | 1.33e-42 | 4.74e+00 | 0.5341 |
| 383 | ARG1 | Pt13.a | Human | Liver | HCC | 4.53e-08 | 3.00e-01 | 0.021 |
| 383 | ARG1 | Pt13.b | Human | Liver | HCC | 7.72e-17 | 4.23e-02 | 0.0251 |
| 383 | ARG1 | Pt14.b | Human | Liver | HCC | 4.42e-08 | 5.61e-01 | 0.018 |
| 383 | ARG1 | S016 | Human | Liver | HCC | 4.71e-04 | -3.43e-01 | 0.2243 |
| 383 | ARG1 | S028 | Human | Liver | HCC | 6.26e-03 | -3.48e-01 | 0.2503 |
| 383 | ARG1 | S029 | Human | Liver | HCC | 3.23e-02 | -3.48e-01 | 0.2581 |
| Page: 1 |
| Tissue | Expression Dynamics | Abbreviation |
| Liver | 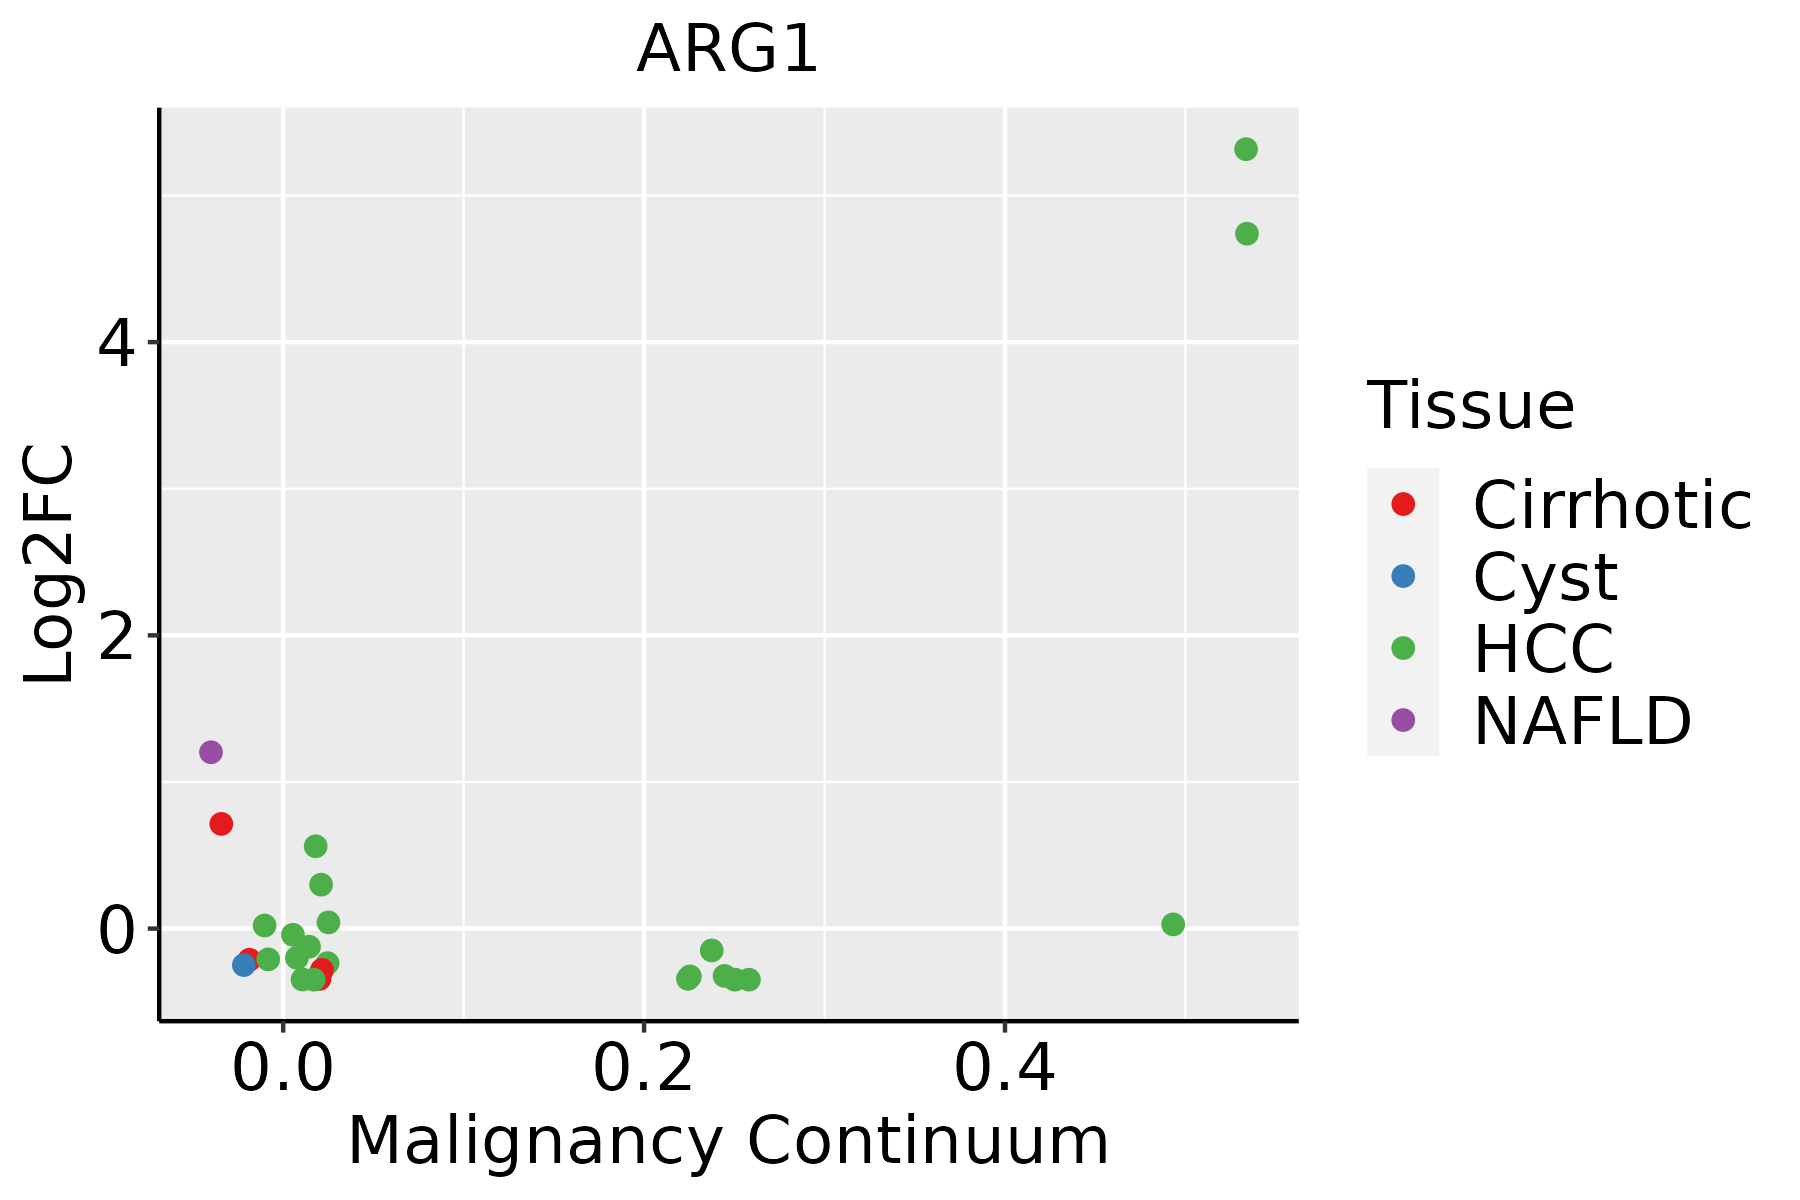 | HCC: Hepatocellular carcinoma |
| NAFLD: Non-alcoholic fatty liver disease |
| ∗log2FC in expression of this searched gene in stem-like cells from each diseased tissue sample relative to stem-like cells in normal samples in each tissue plotted against the malignancy continuum. Samples are colored based on if they are from different disease stage. |
Top |
Malignant transformation related pathway analysis |
| Find out the enriched GO biological processes and KEGG pathways involved in transition from healthy to precancer to cancer |
| Tissue | Disease Stage | Enriched GO biological Processes |
| Colorectum | AD |  |
| Colorectum | SER |  |
| Colorectum | MSS |  |
| Colorectum | MSI-H |  |
| Colorectum | FAP |  |
| ∗Top 15 enriched GO BP terms are showed in the bar plot of each disease state in each tissue. Each row represents a significant GO biological process which is colored according to the -log10(p.adjust). |
| Page: 1 2 3 4 5 6 7 8 9 |
| GO ID | Tissue | Disease Stage | Description | Gene Ratio | Bg Ratio | pvalue | p.adjust | Count |
| GO:00463953 | Liver | NAFLD | carboxylic acid catabolic process | 73/1882 | 236/18723 | 4.16e-19 | 1.22e-15 | 73 |
| GO:00160544 | Liver | NAFLD | organic acid catabolic process | 73/1882 | 240/18723 | 1.20e-18 | 2.34e-15 | 73 |
| GO:00442825 | Liver | NAFLD | small molecule catabolic process | 91/1882 | 376/18723 | 8.96e-16 | 1.31e-12 | 91 |
| GO:00485457 | Liver | NAFLD | response to steroid hormone | 75/1882 | 339/18723 | 3.44e-11 | 1.12e-08 | 75 |
| GO:0009063 | Liver | NAFLD | cellular amino acid catabolic process | 36/1882 | 110/18723 | 6.56e-11 | 1.99e-08 | 36 |
| GO:00713755 | Liver | NAFLD | cellular response to peptide hormone stimulus | 65/1882 | 290/18723 | 3.95e-10 | 9.62e-08 | 65 |
| GO:00065203 | Liver | NAFLD | cellular amino acid metabolic process | 63/1882 | 284/18723 | 1.14e-09 | 2.17e-07 | 63 |
| GO:00094107 | Liver | NAFLD | response to xenobiotic stimulus | 88/1882 | 462/18723 | 2.53e-09 | 4.11e-07 | 88 |
| GO:00713836 | Liver | NAFLD | cellular response to steroid hormone stimulus | 48/1882 | 204/18723 | 1.50e-08 | 1.83e-06 | 48 |
| GO:19016536 | Liver | NAFLD | cellular response to peptide | 71/1882 | 359/18723 | 1.82e-08 | 2.09e-06 | 71 |
| GO:19016053 | Liver | NAFLD | alpha-amino acid metabolic process | 46/1882 | 195/18723 | 2.74e-08 | 2.86e-06 | 46 |
| GO:00610087 | Liver | NAFLD | hepaticobiliary system development | 38/1882 | 150/18723 | 5.94e-08 | 5.42e-06 | 38 |
| GO:00316677 | Liver | NAFLD | response to nutrient levels | 85/1882 | 474/18723 | 8.23e-08 | 7.09e-06 | 85 |
| GO:00018897 | Liver | NAFLD | liver development | 37/1882 | 147/18723 | 1.06e-07 | 8.12e-06 | 37 |
| GO:00434346 | Liver | NAFLD | response to peptide hormone | 76/1882 | 414/18723 | 1.51e-07 | 1.09e-05 | 76 |
| GO:00513846 | Liver | NAFLD | response to glucocorticoid | 36/1882 | 148/18723 | 3.88e-07 | 2.52e-05 | 36 |
| GO:00069797 | Liver | NAFLD | response to oxidative stress | 78/1882 | 446/18723 | 7.85e-07 | 4.29e-05 | 78 |
| GO:1901606 | Liver | NAFLD | alpha-amino acid catabolic process | 25/1882 | 87/18723 | 8.67e-07 | 4.60e-05 | 25 |
| GO:00715593 | Liver | NAFLD | response to transforming growth factor beta | 51/1882 | 256/18723 | 1.43e-06 | 6.58e-05 | 51 |
| GO:00319606 | Liver | NAFLD | response to corticosteroid | 37/1882 | 167/18723 | 3.03e-06 | 1.23e-04 | 37 |
| Page: 1 2 3 4 5 6 7 8 9 10 |
| Pathway ID | Tissue | Disease Stage | Description | Gene Ratio | Bg Ratio | pvalue | p.adjust | qvalue | Count |
| hsa012304 | Liver | Cirrhotic | Biosynthesis of amino acids | 35/2530 | 75/8465 | 1.54e-03 | 7.83e-03 | 4.83e-03 | 35 |
| hsa0123011 | Liver | Cirrhotic | Biosynthesis of amino acids | 35/2530 | 75/8465 | 1.54e-03 | 7.83e-03 | 4.83e-03 | 35 |
| hsa0123021 | Liver | HCC | Biosynthesis of amino acids | 53/4020 | 75/8465 | 3.79e-05 | 2.11e-04 | 1.18e-04 | 53 |
| hsa0033021 | Liver | HCC | Arginine and proline metabolism | 33/4020 | 50/8465 | 6.28e-03 | 1.77e-02 | 9.83e-03 | 33 |
| hsa0123031 | Liver | HCC | Biosynthesis of amino acids | 53/4020 | 75/8465 | 3.79e-05 | 2.11e-04 | 1.18e-04 | 53 |
| hsa0033031 | Liver | HCC | Arginine and proline metabolism | 33/4020 | 50/8465 | 6.28e-03 | 1.77e-02 | 9.83e-03 | 33 |
| Page: 1 |
Top |
Cell-cell communication analysis |
| Identification of potential cell-cell interactions between two cell types and their ligand-receptor pairs for different disease states |
| Ligand | Receptor | LRpair | Pathway | Tissue | Disease Stage |
| Page: 1 |
Top |
Single-cell gene regulatory network inference analysis |
| Find out the significant the regulons (TFs) and the target genes of each regulon across cell types for different disease states |
| TF | Cell Type | Tissue | Disease Stage | Target Gene | RSS | Regulon Activity |
| ∗The dot plots of a searched regulon are shown for all cell subpopulations in each disease state of each tissue based on the regulon specific score inferred using pySCENIC and by calculating the average expression. |
| Page: 1 |
Top |
Somatic mutation of malignant transformation related genes |
| Annotation of somatic variants for genes involved in malignant transformation |
| Hugo Symbol | Variant Class | Variant Classification | dbSNP RS | HGVSc | HGVSp | HGVSp Short | SWISSPROT | BIOTYPE | SIFT | PolyPhen | Tumor Sample Barcode | Tissue | Histology | Sex | Age | Stage | Therapy Types | Drugs | Outcome |
| ARG1 | SNV | Missense_Mutation | c.510C>G | p.Phe170Leu | p.F170L | P05089 | protein_coding | deleterious(0.04) | benign(0.023) | TCGA-A2-A0SY-01 | Breast | breast invasive carcinoma | Female | <65 | III/IV | Hormone Therapy | arimidex | SD | |
| ARG1 | SNV | Missense_Mutation | novel | c.709C>A | p.Leu237Ile | p.L237I | P05089 | protein_coding | deleterious(0.03) | possibly_damaging(0.708) | TCGA-AN-A046-01 | Breast | breast invasive carcinoma | Female | >=65 | I/II | Unknown | Unknown | SD |
| ARG1 | SNV | Missense_Mutation | novel | c.114N>C | p.Glu38Asp | p.E38D | P05089 | protein_coding | tolerated(0.35) | benign(0.003) | TCGA-VS-A958-01 | Cervix | cervical & endocervical cancer | Female | <65 | I/II | Chemotherapy | cisplatin | CR |
| ARG1 | SNV | Missense_Mutation | rs372489226 | c.793N>A | p.Gly265Ser | p.G265S | P05089 | protein_coding | deleterious(0.01) | probably_damaging(0.973) | TCGA-AA-A017-01 | Colorectum | colon adenocarcinoma | Female | <65 | I/II | Unknown | Unknown | SD |
| ARG1 | SNV | Missense_Mutation | novel | c.142N>G | p.Phe48Val | p.F48V | P05089 | protein_coding | tolerated(0.48) | benign(0) | TCGA-CA-6717-01 | Colorectum | colon adenocarcinoma | Male | <65 | I/II | Chemotherapy | oxaliplatin | CR |
| ARG1 | SNV | Missense_Mutation | novel | c.101C>G | p.Ala34Gly | p.A34G | P05089 | protein_coding | tolerated(0.06) | benign(0.043) | TCGA-AJ-A3EL-01 | Endometrium | uterine corpus endometrioid carcinoma | Female | <65 | I/II | Unknown | Unknown | SD |
| ARG1 | SNV | Missense_Mutation | novel | c.440N>C | p.Asn147Thr | p.N147T | P05089 | protein_coding | deleterious(0) | probably_damaging(0.98) | TCGA-AX-A06F-01 | Endometrium | uterine corpus endometrioid carcinoma | Female | <65 | III/IV | Chemotherapy | carboplatin | SD |
| ARG1 | SNV | Missense_Mutation | c.58C>T | p.Pro20Ser | p.P20S | P05089 | protein_coding | tolerated(0.16) | benign(0.015) | TCGA-B5-A11E-01 | Endometrium | uterine corpus endometrioid carcinoma | Female | <65 | I/II | Unknown | Unknown | SD | |
| ARG1 | SNV | Missense_Mutation | c.239C>A | p.Ser80Tyr | p.S80Y | P05089 | protein_coding | tolerated(0.59) | possibly_damaging(0.476) | TCGA-B5-A11E-01 | Endometrium | uterine corpus endometrioid carcinoma | Female | <65 | I/II | Unknown | Unknown | SD | |
| ARG1 | SNV | Missense_Mutation | c.359N>T | p.Ala120Val | p.A120V | P05089 | protein_coding | tolerated(0.12) | benign(0.153) | TCGA-B5-A11H-01 | Endometrium | uterine corpus endometrioid carcinoma | Female | >=65 | III/IV | Hormone Therapy | megace | SD |
| Page: 1 2 3 4 |
Top |
Related drugs of malignant transformation related genes |
| Identification of chemicals and drugs interact with genes involved in malignant transfromation |
| (DGIdb 4.0) |
| Entrez ID | Symbol | Category | Interaction Types | Drug Claim Name | Drug Name | PMIDs |
| 383 | ARG1 | ENZYME | sodium benzoate / sodium phenylacetate | |||
| 383 | ARG1 | ENZYME | L-2-AMINOHISTIDINE | CHEMBL1099167 | 20441173 | |
| 383 | ARG1 | ENZYME | inhibitor | 178101800 | ||
| 383 | ARG1 | ENZYME | selective beta-2-adrenoreceptor agonists | |||
| 383 | ARG1 | ENZYME | inhibitor | 252827464 | ||
| 383 | ARG1 | ENZYME | 2-AMINOHOMOHISTIDINE | CHEMBL1099168 | 20441173 | |
| 383 | ARG1 | ENZYME | inhibitor | 315661102 |
| Page: 1 |

Copyright 2023-Present -The University of Texas Health Science Center at Houston |