Schematic overview of the cellular and molecular mechanisms involved in the cancer progression, including the proposed cellular and molecular mechanisms in cancer cells trajectory. AT1: alveolar type 1 cells; AT2: alveolar type 2 cells; AAH: atypical adenomatous hyperplasia; AIS: adenocarcinoma in situ; MIA: minimally invasive adenocarcinoma; IA: invasive adenocarcinoma; EMT: epithelial-mesenchymal transition

Home

Download

Statistics

Help

Contact

Center for Computational Systems Medicine
leaf

Gene summary

leaf

Malignant transformation analysis

leaf

Malignant transformation related pathway analysis

leaf

Cell-cell communication analysis

leaf

Single-cell gene regulatory network inference analysis

leaf

Somatic mutation of malignant transformation related genes

leaf

Related drugs of malignant transformation related genes

Gene: ARFIP2

Gene summary for ARFIP2

check button Gene summary.

Gene informationSpeciesHuman
Gene symbol

ARFIP2

Gene ID

23647

Gene nameADP ribosylation factor interacting protein 2
Gene AliasPOR1
Cytomap11p15.4
Gene Typeprotein-coding
GO ID

GO:0006810

UniProtAcc

A0A087X1E4


Top

Malignant transformation analysis

check button Identification of the aberrant gene expression in precancerous and cancerous lesions by comparing the gene expression of stem-like cells in diseased tissues with normal stem cells
check button Malignant transformation involving gene list.
Entrez IDSymbolReplicatesSpeciesOrganTissueAdj P-valueLog2FCMalignancy
23647ARFIP2LZE4THumanEsophagusESCC8.89e-041.24e-010.0811
23647ARFIP2LZE5THumanEsophagusESCC1.27e-033.03e-010.0514
23647ARFIP2LZE7THumanEsophagusESCC4.42e-033.54e-010.0667
23647ARFIP2LZE8THumanEsophagusESCC5.78e-042.00e-010.067
23647ARFIP2LZE20THumanEsophagusESCC7.89e-051.03e-010.0662
23647ARFIP2LZE24THumanEsophagusESCC2.49e-175.22e-010.0596
23647ARFIP2LZE21THumanEsophagusESCC4.37e-031.39e-010.0655
23647ARFIP2P1T-EHumanEsophagusESCC9.51e-043.73e-010.0875
23647ARFIP2P2T-EHumanEsophagusESCC5.18e-193.82e-010.1177
23647ARFIP2P4T-EHumanEsophagusESCC1.33e-152.20e-010.1323
23647ARFIP2P5T-EHumanEsophagusESCC4.59e-171.18e-010.1327
23647ARFIP2P8T-EHumanEsophagusESCC1.57e-232.22e-010.0889
23647ARFIP2P9T-EHumanEsophagusESCC9.23e-123.47e-010.1131
23647ARFIP2P10T-EHumanEsophagusESCC3.15e-234.79e-010.116
23647ARFIP2P11T-EHumanEsophagusESCC4.62e-075.68e-010.1426
23647ARFIP2P12T-EHumanEsophagusESCC4.54e-212.73e-010.1122
23647ARFIP2P15T-EHumanEsophagusESCC2.06e-133.16e-010.1149
23647ARFIP2P16T-EHumanEsophagusESCC3.47e-112.81e-010.1153
23647ARFIP2P17T-EHumanEsophagusESCC2.44e-095.77e-010.1278
23647ARFIP2P20T-EHumanEsophagusESCC5.68e-093.86e-010.1124
Page: 1 2 3 4 5 6 

check button Transcriptomic changes along malignancy continuum.
TissueExpression DynamicsAbbreviation
EsophagusThe image shows the transcriptomic changes along malignancy continuum.log2FC in expression of this searched gene in stem-like cells from each diseased tissue sample relative to stem-like cells in normal samples in each tissue plotted against the malignancy continuum. Samples are colored based on if they are from different disease stage.
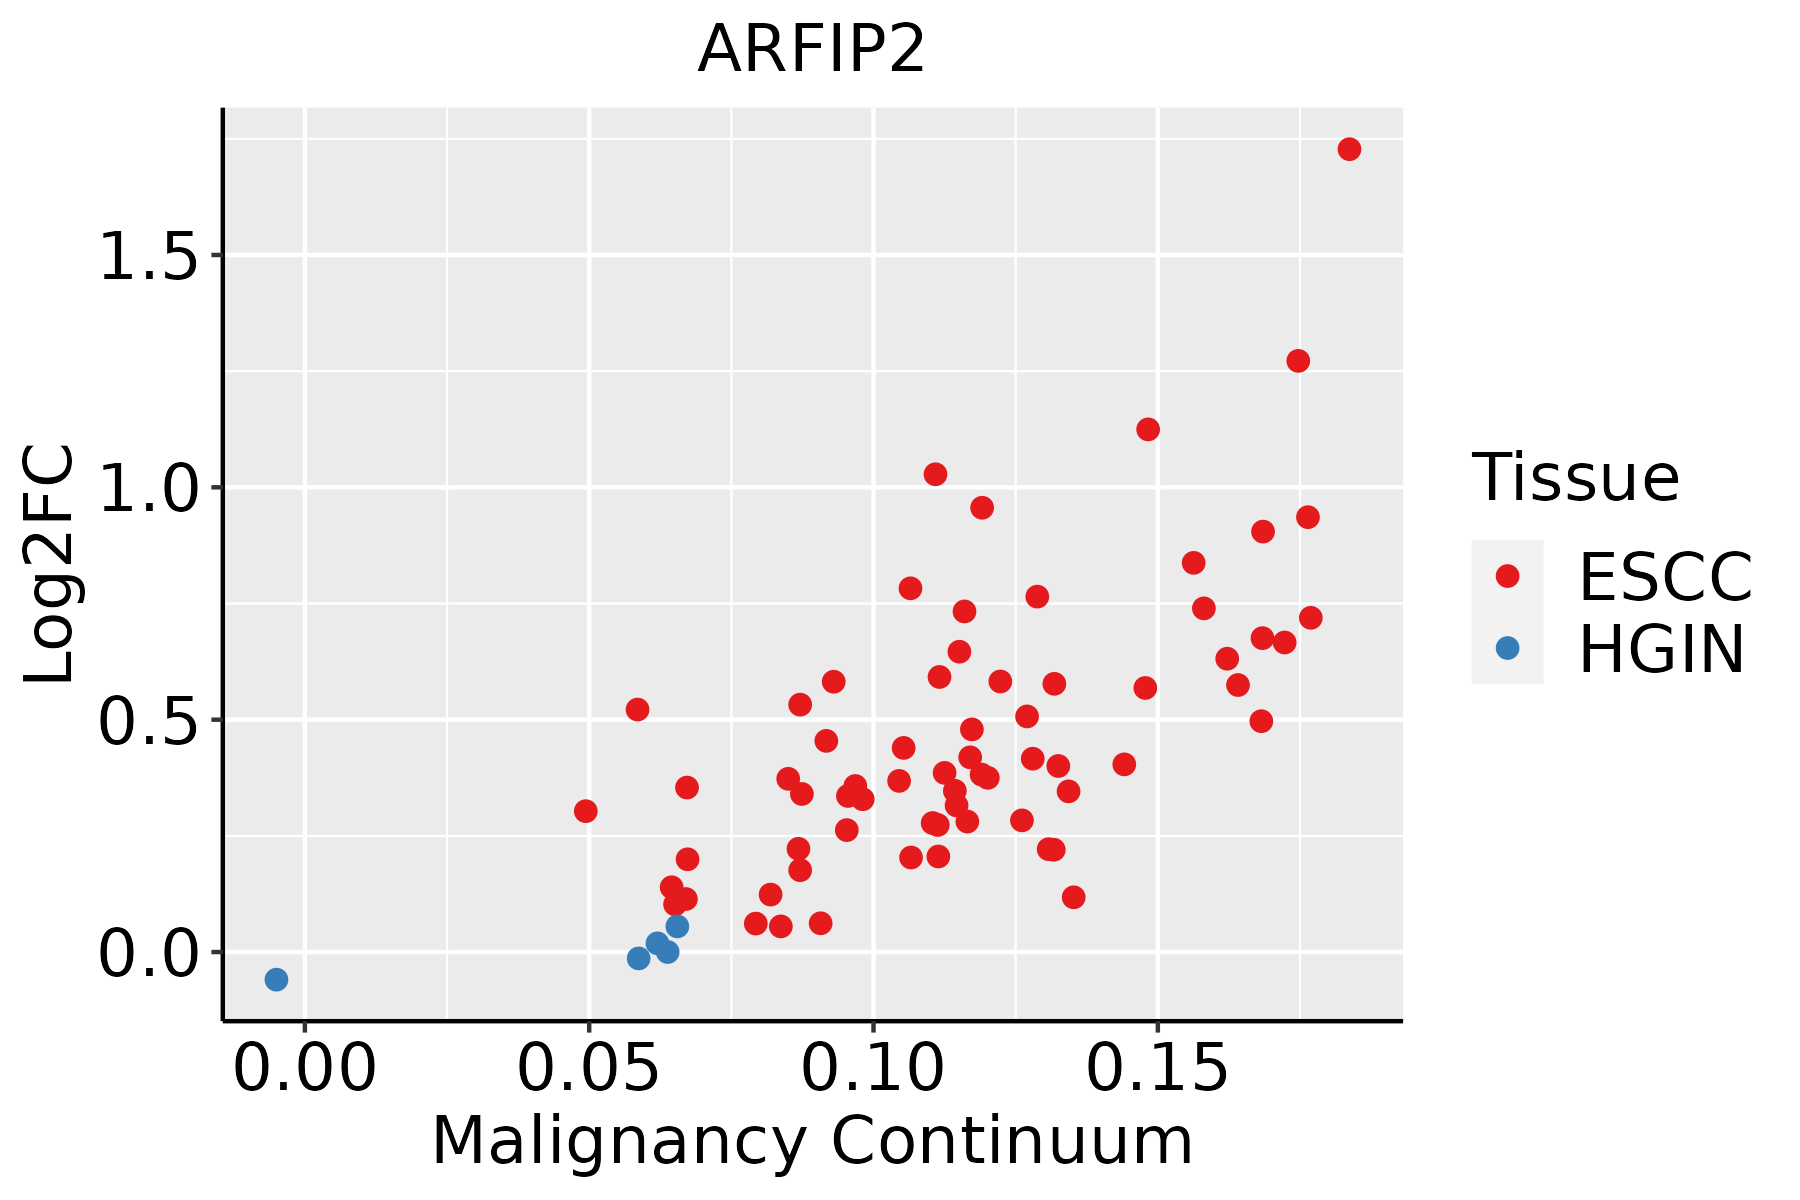
ESCC: Esophageal squamous cell carcinoma
HGIN: High-grade intraepithelial neoplasias
LGIN: Low-grade intraepithelial neoplasias
LiverThe image shows the transcriptomic changes along malignancy continuum.log2FC in expression of this searched gene in stem-like cells from each diseased tissue sample relative to stem-like cells in normal samples in each tissue plotted against the malignancy continuum. Samples are colored based on if they are from different disease stage.
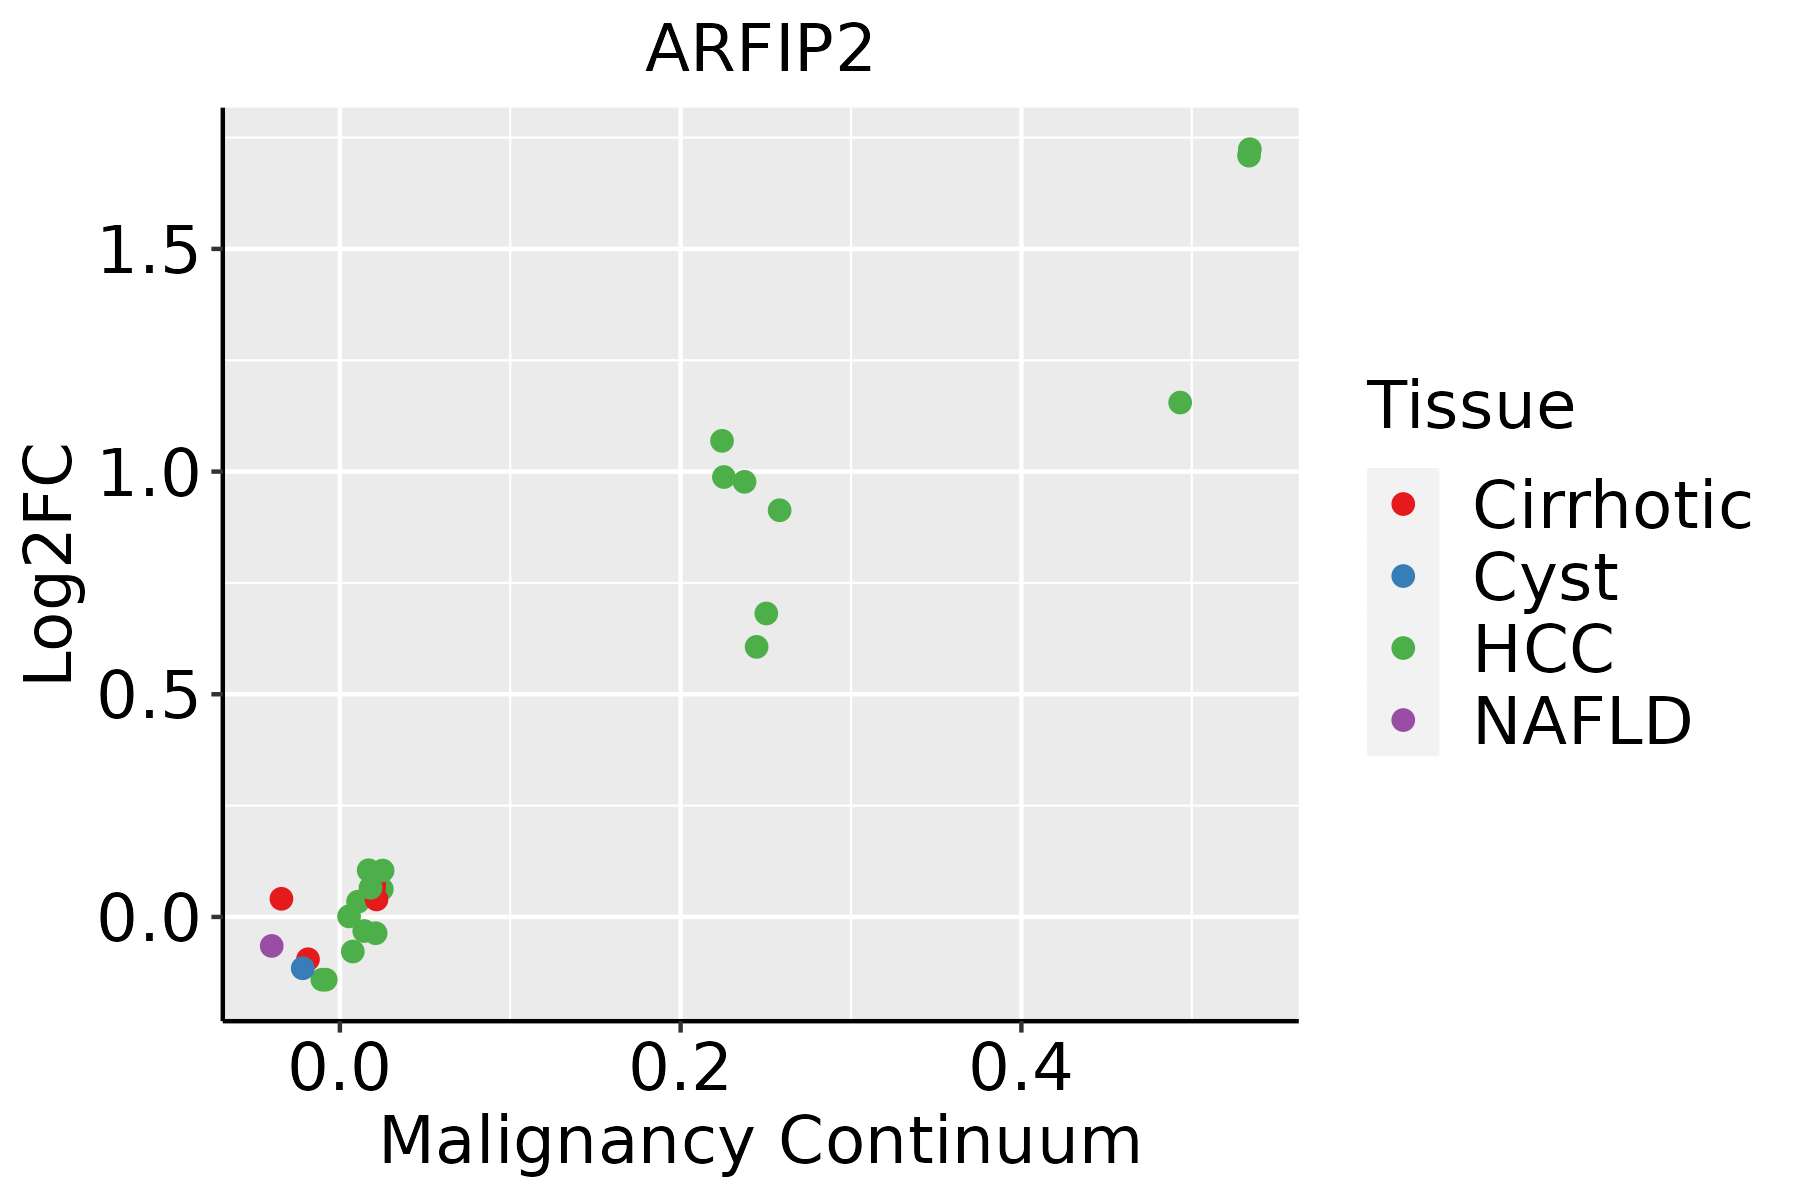
HCC: Hepatocellular carcinoma
NAFLD: Non-alcoholic fatty liver disease
Oral CavityThe image shows the transcriptomic changes along malignancy continuum.log2FC in expression of this searched gene in stem-like cells from each diseased tissue sample relative to stem-like cells in normal samples in each tissue plotted against the malignancy continuum. Samples are colored based on if they are from different disease stage.
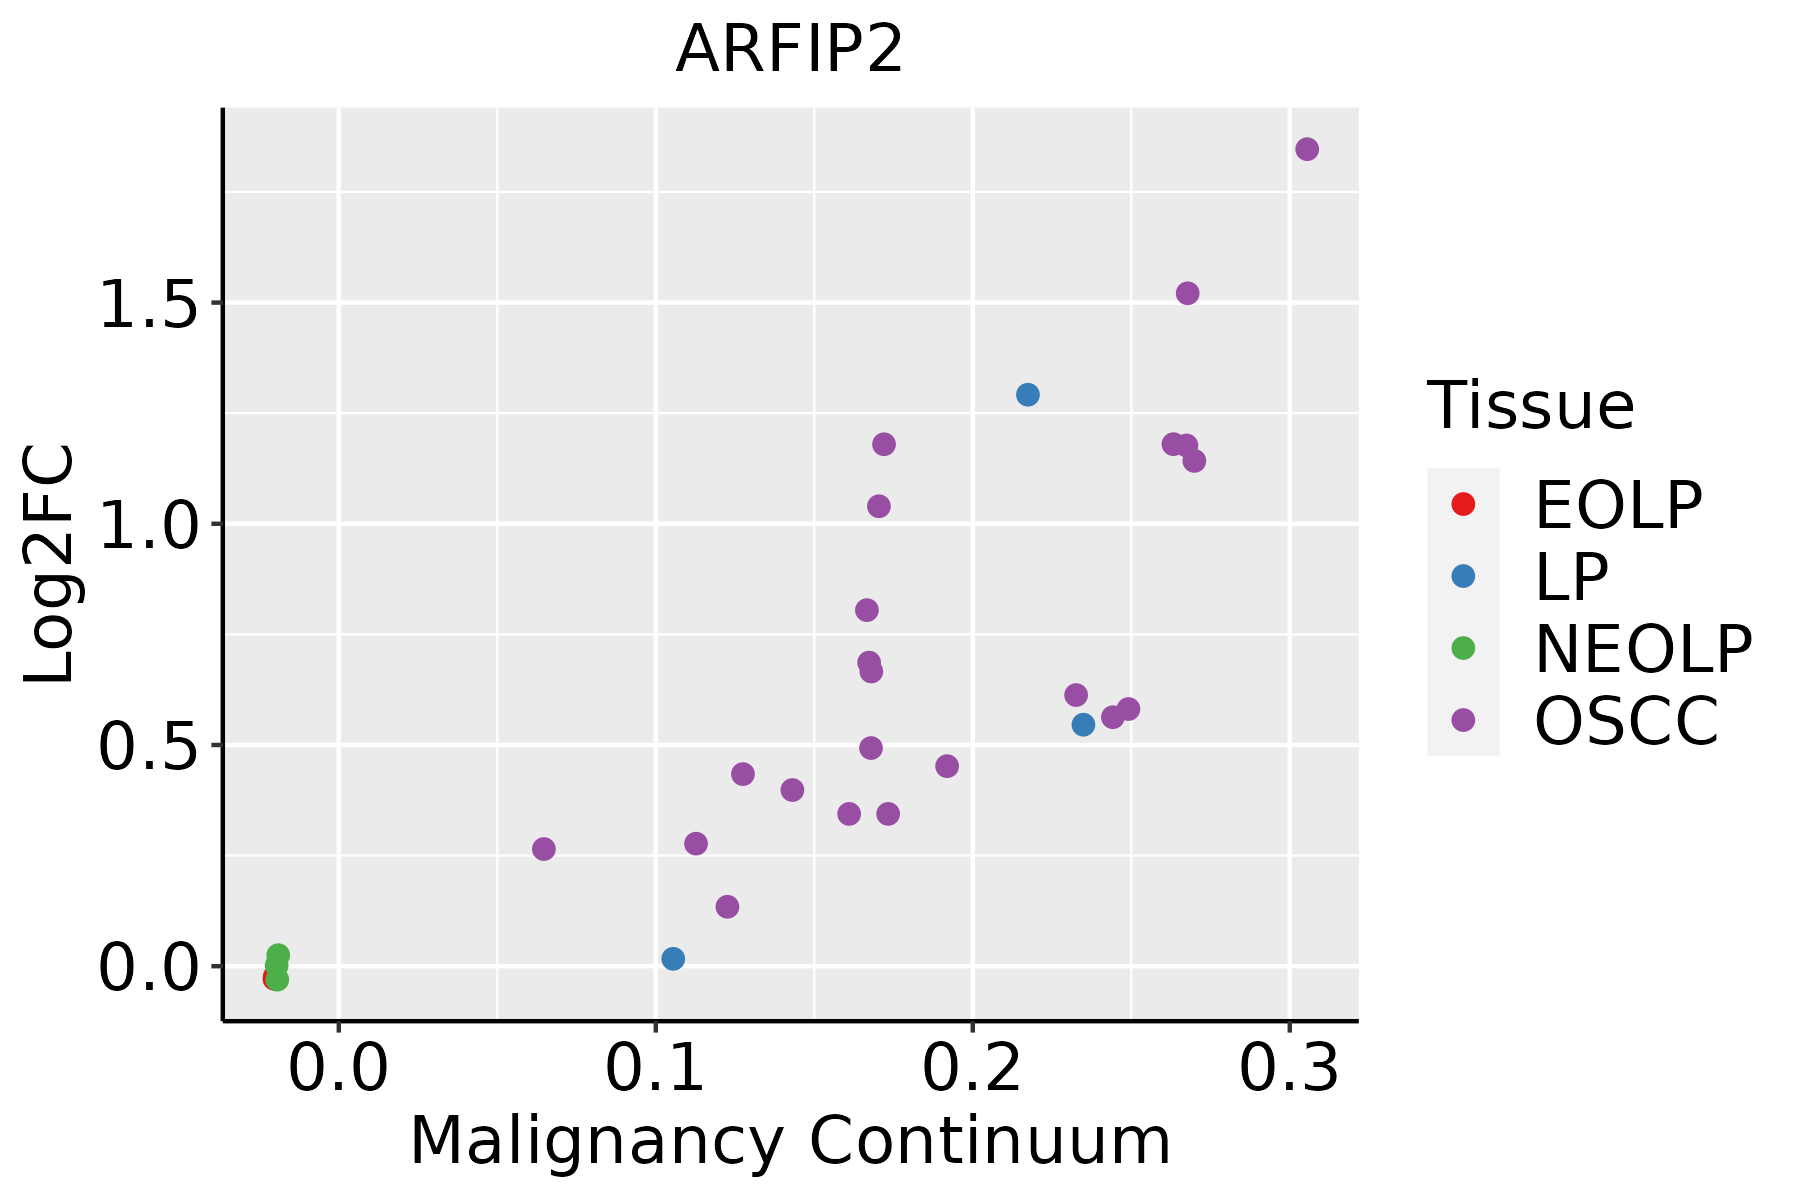
EOLP: Erosive Oral lichen planus
LP: leukoplakia
NEOLP: Non-erosive oral lichen planus
OSCC: Oral squamous cell carcinoma
ProstateThe image shows the transcriptomic changes along malignancy continuum.log2FC in expression of this searched gene in stem-like cells from each diseased tissue sample relative to stem-like cells in normal samples in each tissue plotted against the malignancy continuum. Samples are colored based on if they are from different disease stage.
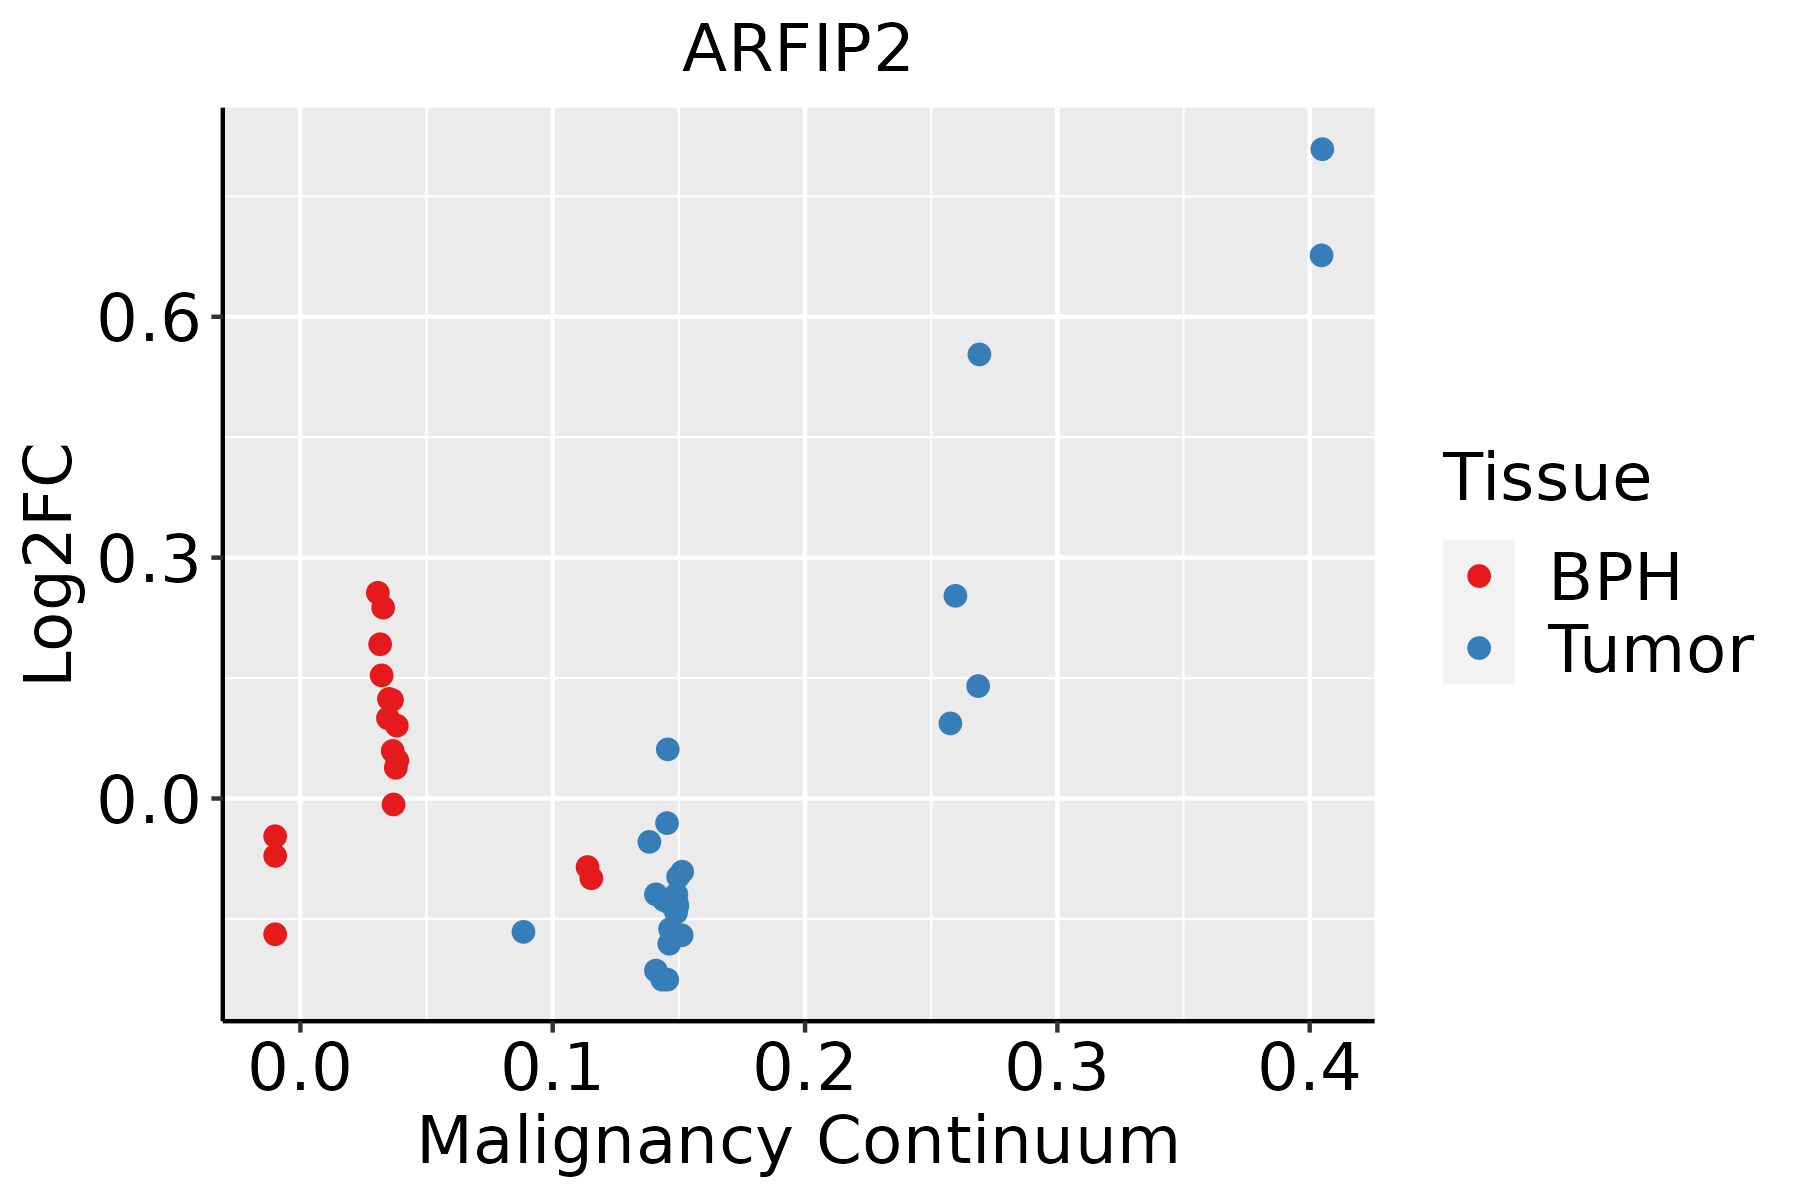
BPH: Benign Prostatic Hyperplasia
SkinThe image shows the transcriptomic changes along malignancy continuum.log2FC in expression of this searched gene in stem-like cells from each diseased tissue sample relative to stem-like cells in normal samples in each tissue plotted against the malignancy continuum. Samples are colored based on if they are from different disease stage.
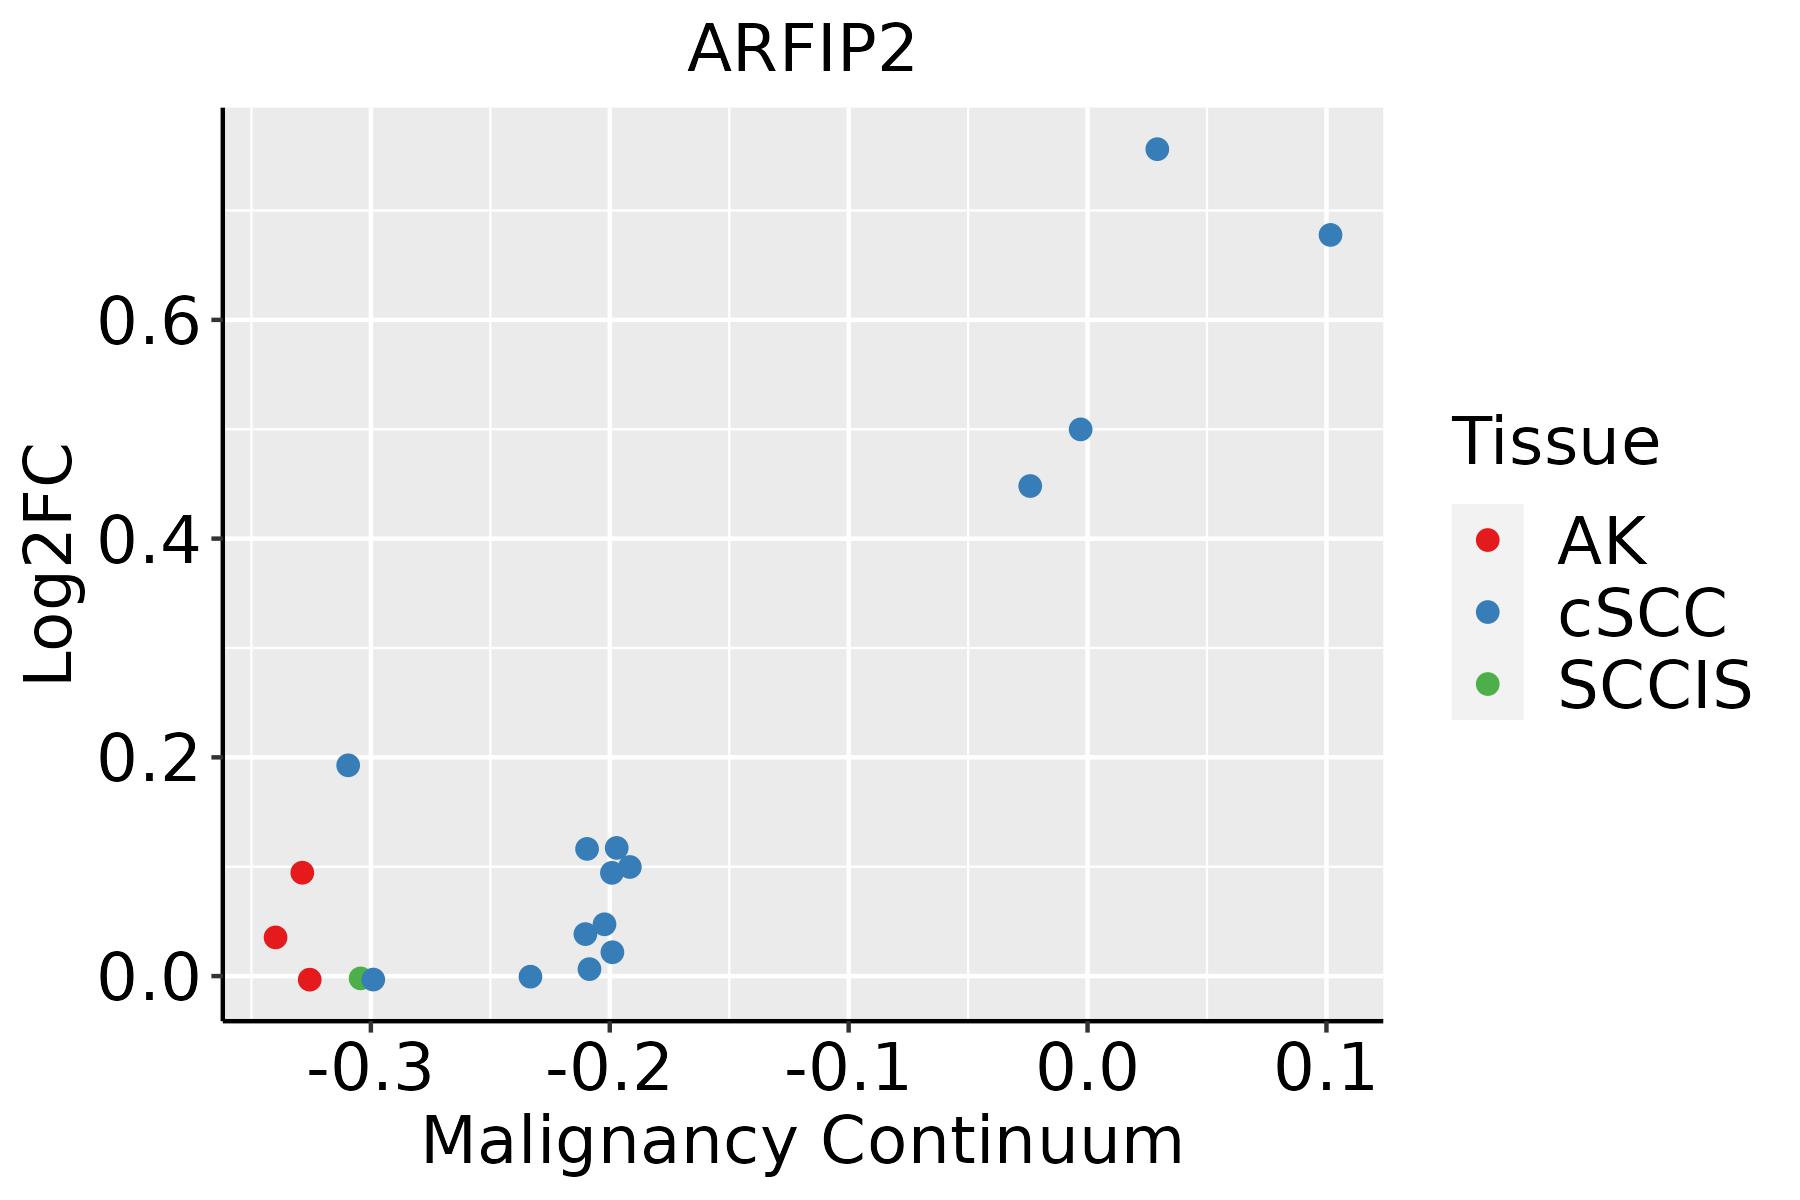
AK: Actinic keratosis
cSCC: Cutaneous squamous cell carcinoma
SCCIS:squamous cell carcinoma in situ
ThyroidThe image shows the transcriptomic changes along malignancy continuum.log2FC in expression of this searched gene in stem-like cells from each diseased tissue sample relative to stem-like cells in normal samples in each tissue plotted against the malignancy continuum. Samples are colored based on if they are from different disease stage.
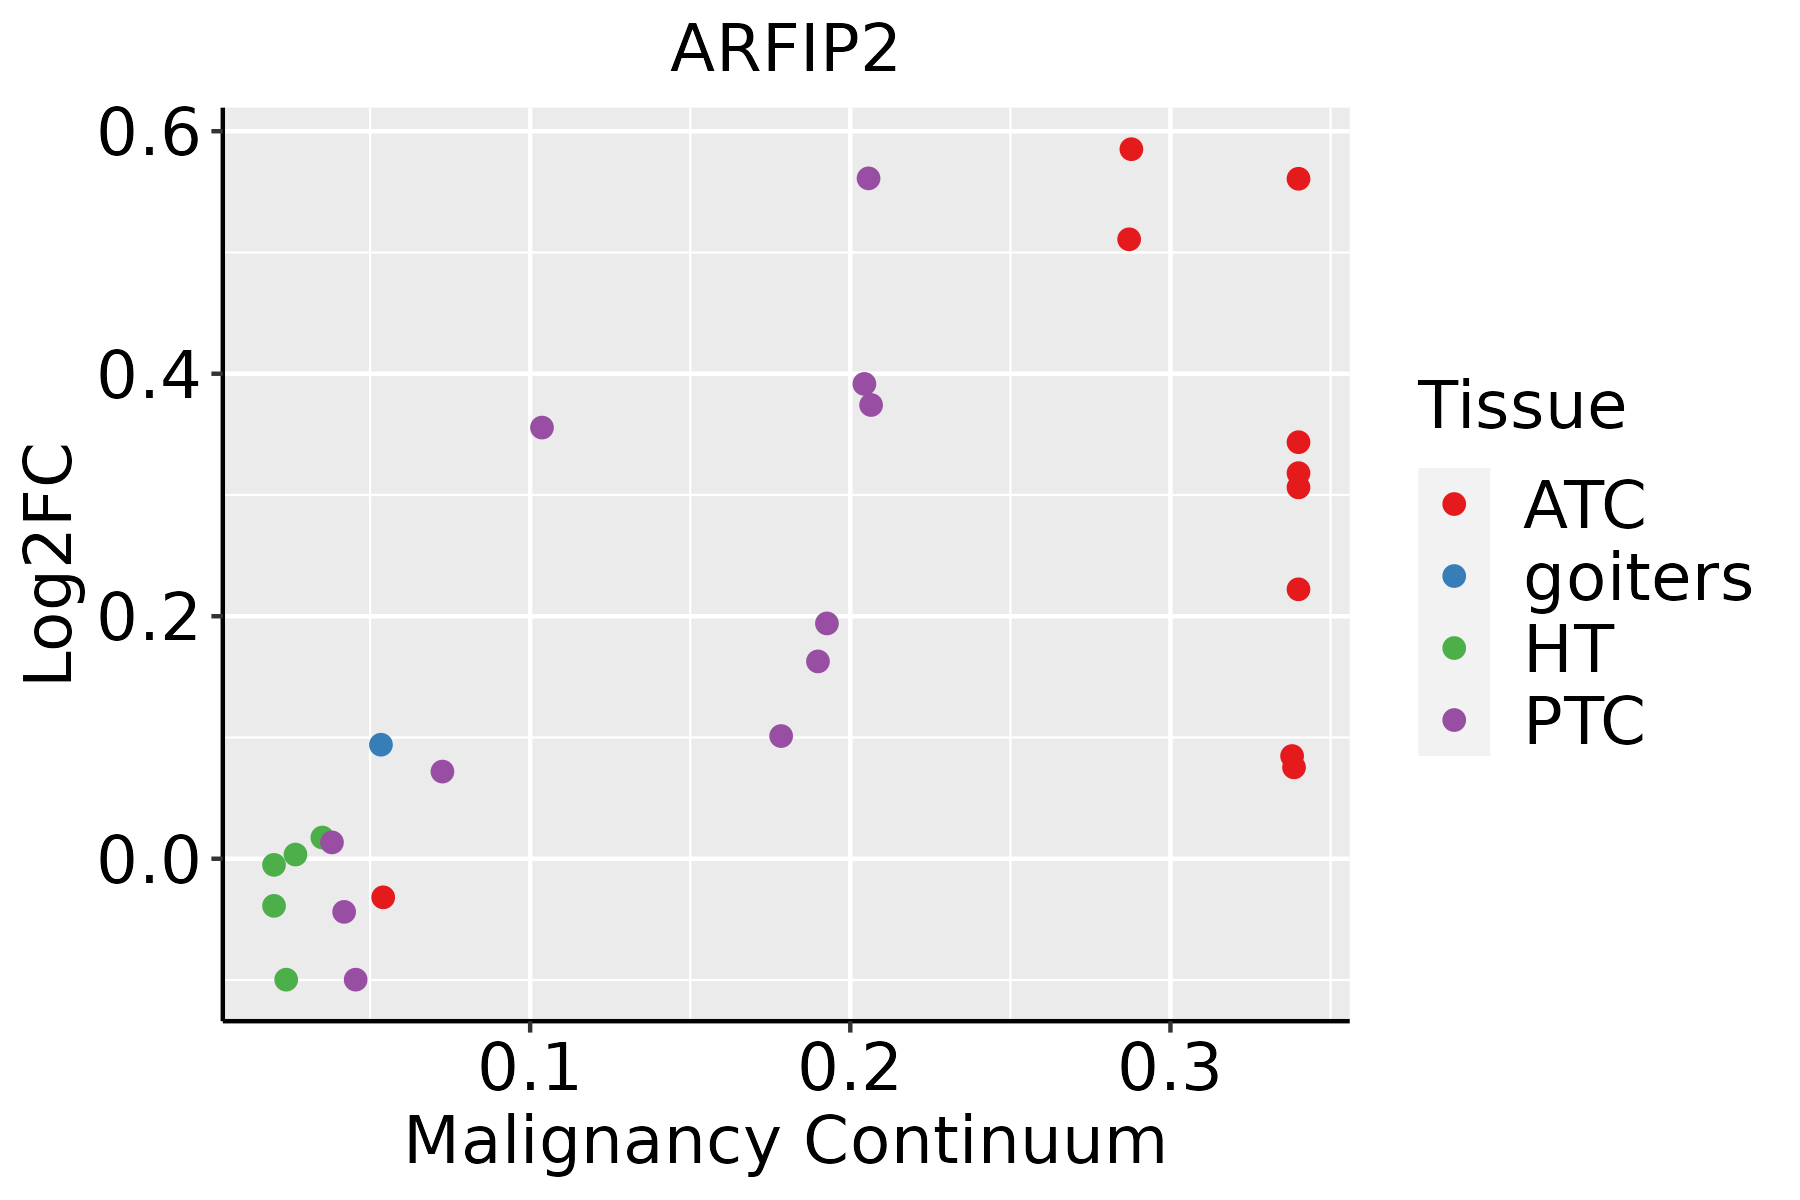
ATC: Anaplastic thyroid cancer
HT: Hashimoto's thyroiditis
PTC: Papillary thyroid cancer
∗log2FC in expression of this searched gene in stem-like cells from each diseased tissue sample relative to stem-like cells in normal samples in each tissue plotted against the malignancy continuum. Samples are colored based on if they are from different disease stage.

Top

Malignant transformation related pathway analysis

check buttonFind out the enriched GO biological processes and KEGG pathways involved in transition from healthy to precancer to cancer
check button Figure of enriched GO biological processes.
TissueDisease StageEnriched GO biological Processes
ColorectumADGO analysis - Figure of enriched GO biological processes: Top 15 enriched GO BP terms are showed in the bar plot of each disease state in each tissue. Each row represents a significant GO biological process which is colored according to the -log10(p.adjust).
ColorectumSERGO analysis - Figure of enriched GO biological processes: Top 15 enriched GO BP terms are showed in the bar plot of each disease state in each tissue. Each row represents a significant GO biological process which is colored according to the -log10(p.adjust).
ColorectumMSSGO analysis - Figure of enriched GO biological processes: Top 15 enriched GO BP terms are showed in the bar plot of each disease state in each tissue. Each row represents a significant GO biological process which is colored according to the -log10(p.adjust).
ColorectumMSI-HGO analysis - Figure of enriched GO biological processes: Top 15 enriched GO BP terms are showed in the bar plot of each disease state in each tissue. Each row represents a significant GO biological process which is colored according to the -log10(p.adjust).
ColorectumFAPGO analysis - Figure of enriched GO biological processes: Top 15 enriched GO BP terms are showed in the bar plot of each disease state in each tissue. Each row represents a significant GO biological process which is colored according to the -log10(p.adjust).
∗Top 15 enriched GO BP terms are showed in the bar plot of each disease state in each tissue. Each row represents a significant GO biological process which is colored according to the -log10(p.adjust).
Page: 1 2 3 4 5 6 7 8 9 

check button Enriched GO biological processes.
GO IDTissueDisease StageDescriptionGene RatioBg Ratiopvaluep.adjustCount
GO:0043254111EsophagusESCCregulation of protein-containing complex assembly278/8552428/187233.81e-162.77e-14278
GO:0031334111EsophagusESCCpositive regulation of protein-containing complex assembly166/8552237/187232.06e-141.07e-12166
GO:1902905111EsophagusESCCpositive regulation of supramolecular fiber organization142/8552209/187235.51e-111.76e-09142
GO:1902903111EsophagusESCCregulation of supramolecular fiber organization237/8552383/187239.06e-112.75e-09237
GO:005149520EsophagusESCCpositive regulation of cytoskeleton organization147/8552226/187232.93e-096.38e-08147
GO:0051258111EsophagusESCCprotein polymerization183/8552297/187231.94e-083.75e-07183
GO:000701527EsophagusESCCactin filament organization259/8552442/187232.37e-084.50e-07259
GO:0032273111EsophagusESCCpositive regulation of protein polymerization95/8552138/187232.97e-085.57e-0795
GO:003253520EsophagusESCCregulation of cellular component size227/8552383/187234.77e-088.60e-07227
GO:0032970111EsophagusESCCregulation of actin filament-based process231/8552397/187232.91e-074.20e-06231
GO:0032956111EsophagusESCCregulation of actin cytoskeleton organization210/8552358/187234.40e-076.00e-06210
GO:0032271111EsophagusESCCregulation of protein polymerization143/8552233/187239.21e-071.17e-05143
GO:011005327EsophagusESCCregulation of actin filament organization166/8552278/187231.54e-061.85e-05166
GO:003083819EsophagusESCCpositive regulation of actin filament polymerization66/855299/187231.96e-051.72e-0466
GO:000815420EsophagusESCCactin polymerization or depolymerization130/8552218/187232.19e-051.88e-04130
GO:0030041110EsophagusESCCactin filament polymerization114/8552191/187236.46e-054.92e-04114
GO:000806419EsophagusESCCregulation of actin polymerization or depolymerization112/8552188/187238.31e-056.06e-04112
GO:003083218EsophagusESCCregulation of actin filament length112/8552189/187231.13e-047.85e-04112
GO:003083320EsophagusESCCregulation of actin filament polymerization103/8552172/187231.19e-048.15e-04103
GO:00315299EsophagusESCCruffle organization39/855256/187232.44e-041.51e-0339
Page: 1 2 3 4 5 6 7 8 9 10 11 12 13 

check button Enriched KEGG pathways.
Pathway IDTissueDisease StageDescriptionGene RatioBg Ratiopvaluep.adjustqvalueCount
Page: 1 

Top

Cell-cell communication analysis

check buttonIdentification of potential cell-cell interactions between two cell types and their ligand-receptor pairs for different disease states
LigandReceptorLRpairPathwayTissueDisease Stage
Page: 1 

Top

Single-cell gene regulatory network inference analysis

check buttonFind out the significant the regulons (TFs) and the target genes of each regulon across cell types for different disease states
TFCell TypeTissueDisease StageTarget GeneRSSRegulon Activity
∗The dot plots of a searched regulon are shown for all cell subpopulations in each disease state of each tissue based on the regulon specific score inferred using pySCENIC and by calculating the average expression.
Page: 1 

Top

Somatic mutation of malignant transformation related genes

check buttonAnnotation of somatic variants for genes involved in malignant transformation
Hugo SymbolVariant ClassVariant ClassificationdbSNP RSHGVScHGVSpHGVSp ShortSWISSPROTBIOTYPESIFTPolyPhenTumor Sample BarcodeTissueHistologySexAgeStageTherapy TypesDrugsOutcome
ARFIP2SNVMissense_Mutationnovelc.373N>Cp.Lys125Glnp.K125Qprotein_codingdeleterious(0.02)probably_damaging(0.995)TCGA-3C-AALJ-01Breastbreast invasive carcinomaFemale<65I/IIChemotherapydoxorubicinSD
ARFIP2SNVMissense_Mutationnovelc.472N>Ap.Glu158Lysp.E158Kprotein_codingdeleterious(0.01)probably_damaging(0.984)TCGA-AR-A2LE-01Breastbreast invasive carcinomaFemale>=65I/IIHormone TherapytamoxiphenPD
ARFIP2insertionFrame_Shift_Insnovelc.425_426insTTp.Gln142HisfsTer19p.Q142Hfs*19protein_codingTCGA-A2-A0CT-01Breastbreast invasive carcinomaFemale>=65I/IIChemotherapycytoxanSD
ARFIP2insertionFrame_Shift_Insnovelc.424_425insTTTTAATAAATAAAAATTTAGAAAAGp.Gln142LeufsTer27p.Q142Lfs*27protein_codingTCGA-A2-A0CT-01Breastbreast invasive carcinomaFemale>=65I/IIChemotherapycytoxanSD
ARFIP2insertionNonsense_Mutationnovelc.1047_1048insTCTTCTGGGCTTTGATCAp.Leu349_Glu350insSerSerGlyLeuTerSerp.L349_E350insSSGL*Sprotein_codingTCGA-AN-A0FN-01Breastbreast invasive carcinomaFemale<65I/IIUnknownUnknownSD
ARFIP2SNVMissense_Mutationrs773493084c.1081C>Tp.Arg361Trpp.R361Wprotein_codingdeleterious(0)possibly_damaging(0.847)TCGA-EK-A2PL-01Cervixcervical & endocervical cancerFemale<65III/IVUnknownUnknownSD
ARFIP2SNVMissense_Mutationc.502N>Cp.Glu168Glnp.E168Qprotein_codingdeleterious(0)benign(0.234)TCGA-EK-A3GK-01Cervixcervical & endocervical cancerFemale<65I/IIUnknownUnknownSD
ARFIP2SNVMissense_Mutationrs766340094c.221G>Ap.Arg74Lysp.R74Kprotein_codingtolerated(0.95)benign(0)TCGA-JX-A3Q0-01Cervixcervical & endocervical cancerFemale<65III/IVUnknownUnknownSD
ARFIP2SNVMissense_Mutationc.458N>Tp.Arg153Leup.R153Lprotein_codingdeleterious(0)probably_damaging(0.984)TCGA-AA-3966-01Colorectumcolon adenocarcinomaFemale>=65I/IIUnknownUnknownSD
ARFIP2SNVMissense_Mutationnovelc.358N>Ap.Gly120Serp.G120Sprotein_codingtolerated(0.43)probably_damaging(0.999)TCGA-AJ-A23O-01Endometriumuterine corpus endometrioid carcinomaFemale>=65I/IIUnknownUnknownSD
Page: 1 2 3 4 

Top

Related drugs of malignant transformation related genes

check buttonIdentification of chemicals and drugs interact with genes involved in malignant transfromation
(DGIdb 4.0)
Entrez IDSymbolCategoryInteraction TypesDrug Claim NameDrug NamePMIDs
Page: 1