
|
|||||
|
 | |
| |
| |
| |
| |
| |
|
Gene: ARFGEF2 |
Gene summary for ARFGEF2 |
| Gene information | Species | Human | Gene symbol | ARFGEF2 | Gene ID | 10564 |
| Gene name | ADP ribosylation factor guanine nucleotide exchange factor 2 | |
| Gene Alias | BIG2 | |
| Cytomap | 20q13.13 | |
| Gene Type | protein-coding | GO ID | GO:0001816 | UniProtAcc | Q59FR3 |
Top |
Malignant transformation analysis |
| Identification of the aberrant gene expression in precancerous and cancerous lesions by comparing the gene expression of stem-like cells in diseased tissues with normal stem cells |
| Entrez ID | Symbol | Replicates | Species | Organ | Tissue | Adj P-value | Log2FC | Malignancy |
| 10564 | ARFGEF2 | CCI_1 | Human | Cervix | CC | 7.75e-06 | 6.08e-01 | 0.528 |
| 10564 | ARFGEF2 | CCI_2 | Human | Cervix | CC | 1.78e-02 | 6.65e-01 | 0.5249 |
| 10564 | ARFGEF2 | CCI_3 | Human | Cervix | CC | 1.20e-08 | 6.78e-01 | 0.516 |
| 10564 | ARFGEF2 | HTA11_3410_2000001011 | Human | Colorectum | AD | 1.26e-22 | -6.38e-01 | 0.0155 |
| 10564 | ARFGEF2 | HTA11_347_2000001011 | Human | Colorectum | AD | 1.04e-10 | 6.06e-01 | -0.1954 |
| 10564 | ARFGEF2 | HTA11_9408_2000001011 | Human | Colorectum | AD | 3.26e-02 | -6.12e-01 | 0.0451 |
| 10564 | ARFGEF2 | HTA11_10711_2000001011 | Human | Colorectum | AD | 5.46e-03 | -2.90e-01 | 0.0338 |
| 10564 | ARFGEF2 | HTA11_7696_3000711011 | Human | Colorectum | AD | 2.30e-05 | -3.53e-01 | 0.0674 |
| 10564 | ARFGEF2 | HTA11_6818_2000001021 | Human | Colorectum | AD | 1.35e-02 | -4.54e-01 | 0.0588 |
| 10564 | ARFGEF2 | HTA11_99999965104_69814 | Human | Colorectum | MSS | 4.59e-04 | 5.15e-01 | 0.281 |
| 10564 | ARFGEF2 | HTA11_99999971662_82457 | Human | Colorectum | MSS | 1.64e-03 | 7.01e-01 | 0.3859 |
| 10564 | ARFGEF2 | F007 | Human | Colorectum | FAP | 1.02e-04 | -3.29e-01 | 0.1176 |
| 10564 | ARFGEF2 | A002-C-010 | Human | Colorectum | FAP | 1.37e-04 | -2.59e-01 | 0.242 |
| 10564 | ARFGEF2 | A001-C-207 | Human | Colorectum | FAP | 4.71e-04 | -3.27e-01 | 0.1278 |
| 10564 | ARFGEF2 | A015-C-203 | Human | Colorectum | FAP | 5.10e-40 | -5.31e-01 | -0.1294 |
| 10564 | ARFGEF2 | A015-C-204 | Human | Colorectum | FAP | 7.03e-08 | -3.22e-01 | -0.0228 |
| 10564 | ARFGEF2 | A014-C-040 | Human | Colorectum | FAP | 1.12e-06 | -5.04e-01 | -0.1184 |
| 10564 | ARFGEF2 | A002-C-201 | Human | Colorectum | FAP | 4.77e-17 | -4.05e-01 | 0.0324 |
| 10564 | ARFGEF2 | A002-C-203 | Human | Colorectum | FAP | 7.80e-12 | -2.91e-01 | 0.2786 |
| 10564 | ARFGEF2 | A001-C-119 | Human | Colorectum | FAP | 1.13e-10 | -4.09e-01 | -0.1557 |
| Page: 1 2 3 4 5 6 7 8 |
| Tissue | Expression Dynamics | Abbreviation |
| Cervix | 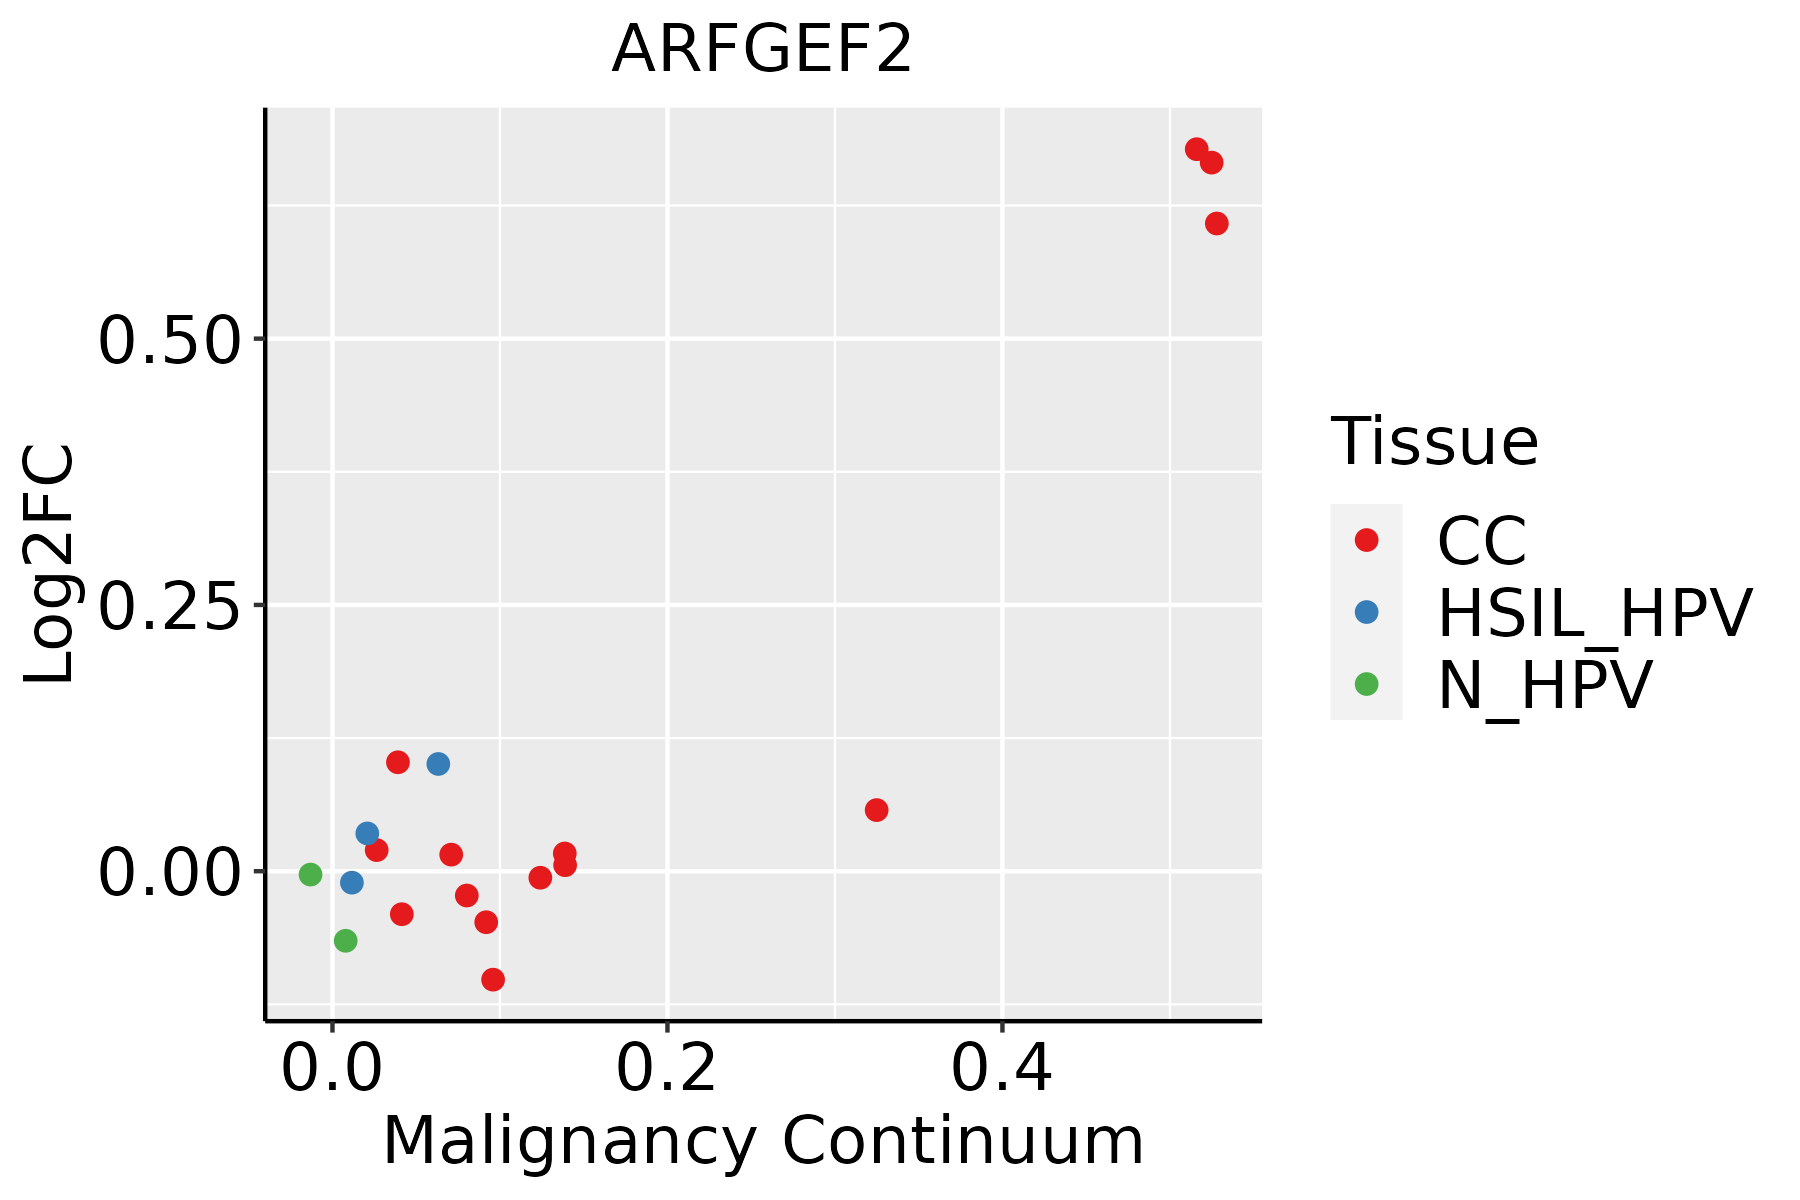 | CC: Cervix cancer |
| HSIL_HPV: HPV-infected high-grade squamous intraepithelial lesions | ||
| N_HPV: HPV-infected normal cervix | ||
| Colorectum (GSE201348) | 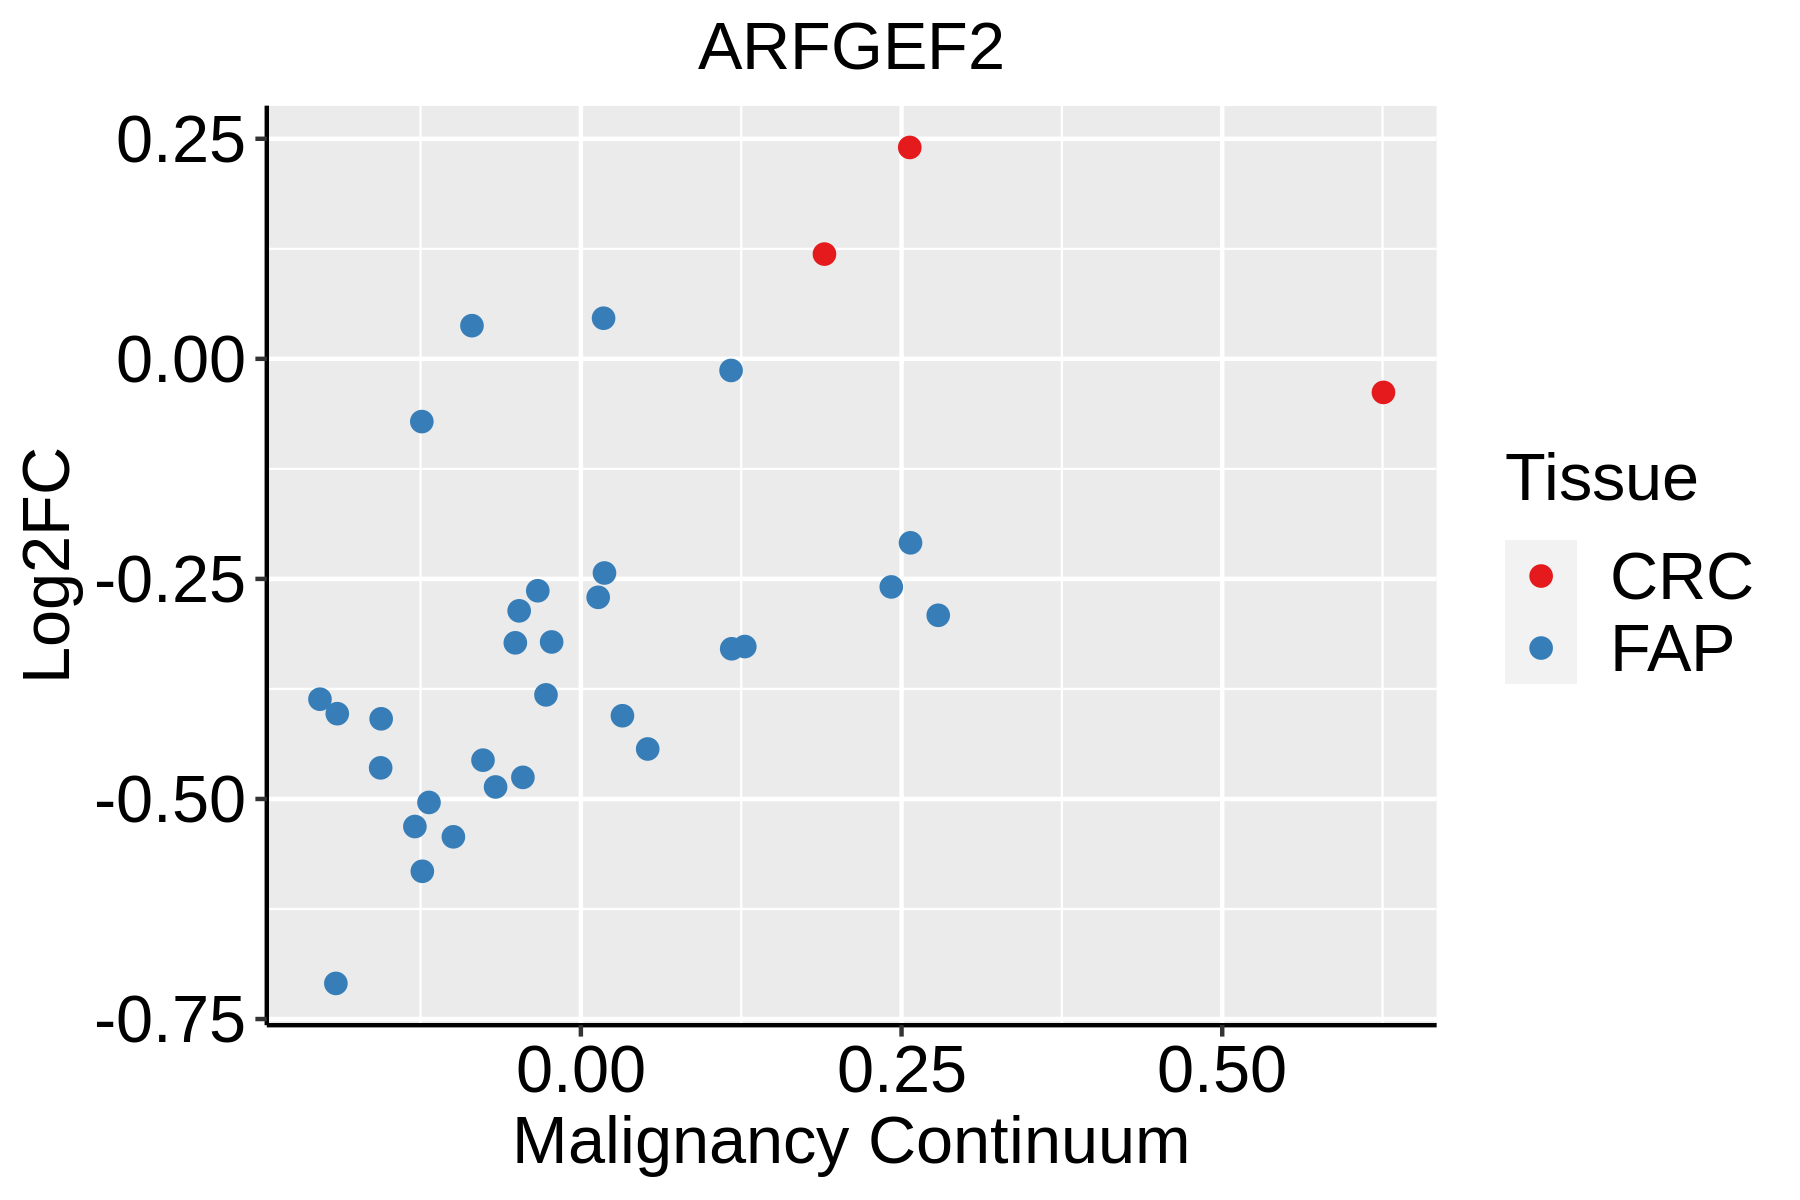 | FAP: Familial adenomatous polyposis |
| CRC: Colorectal cancer | ||
| Colorectum (HTA11) |  | AD: Adenomas |
| SER: Sessile serrated lesions | ||
| MSI-H: Microsatellite-high colorectal cancer | ||
| MSS: Microsatellite stable colorectal cancer | ||
| Esophagus |  | ESCC: Esophageal squamous cell carcinoma |
| HGIN: High-grade intraepithelial neoplasias | ||
| LGIN: Low-grade intraepithelial neoplasias | ||
| Liver | 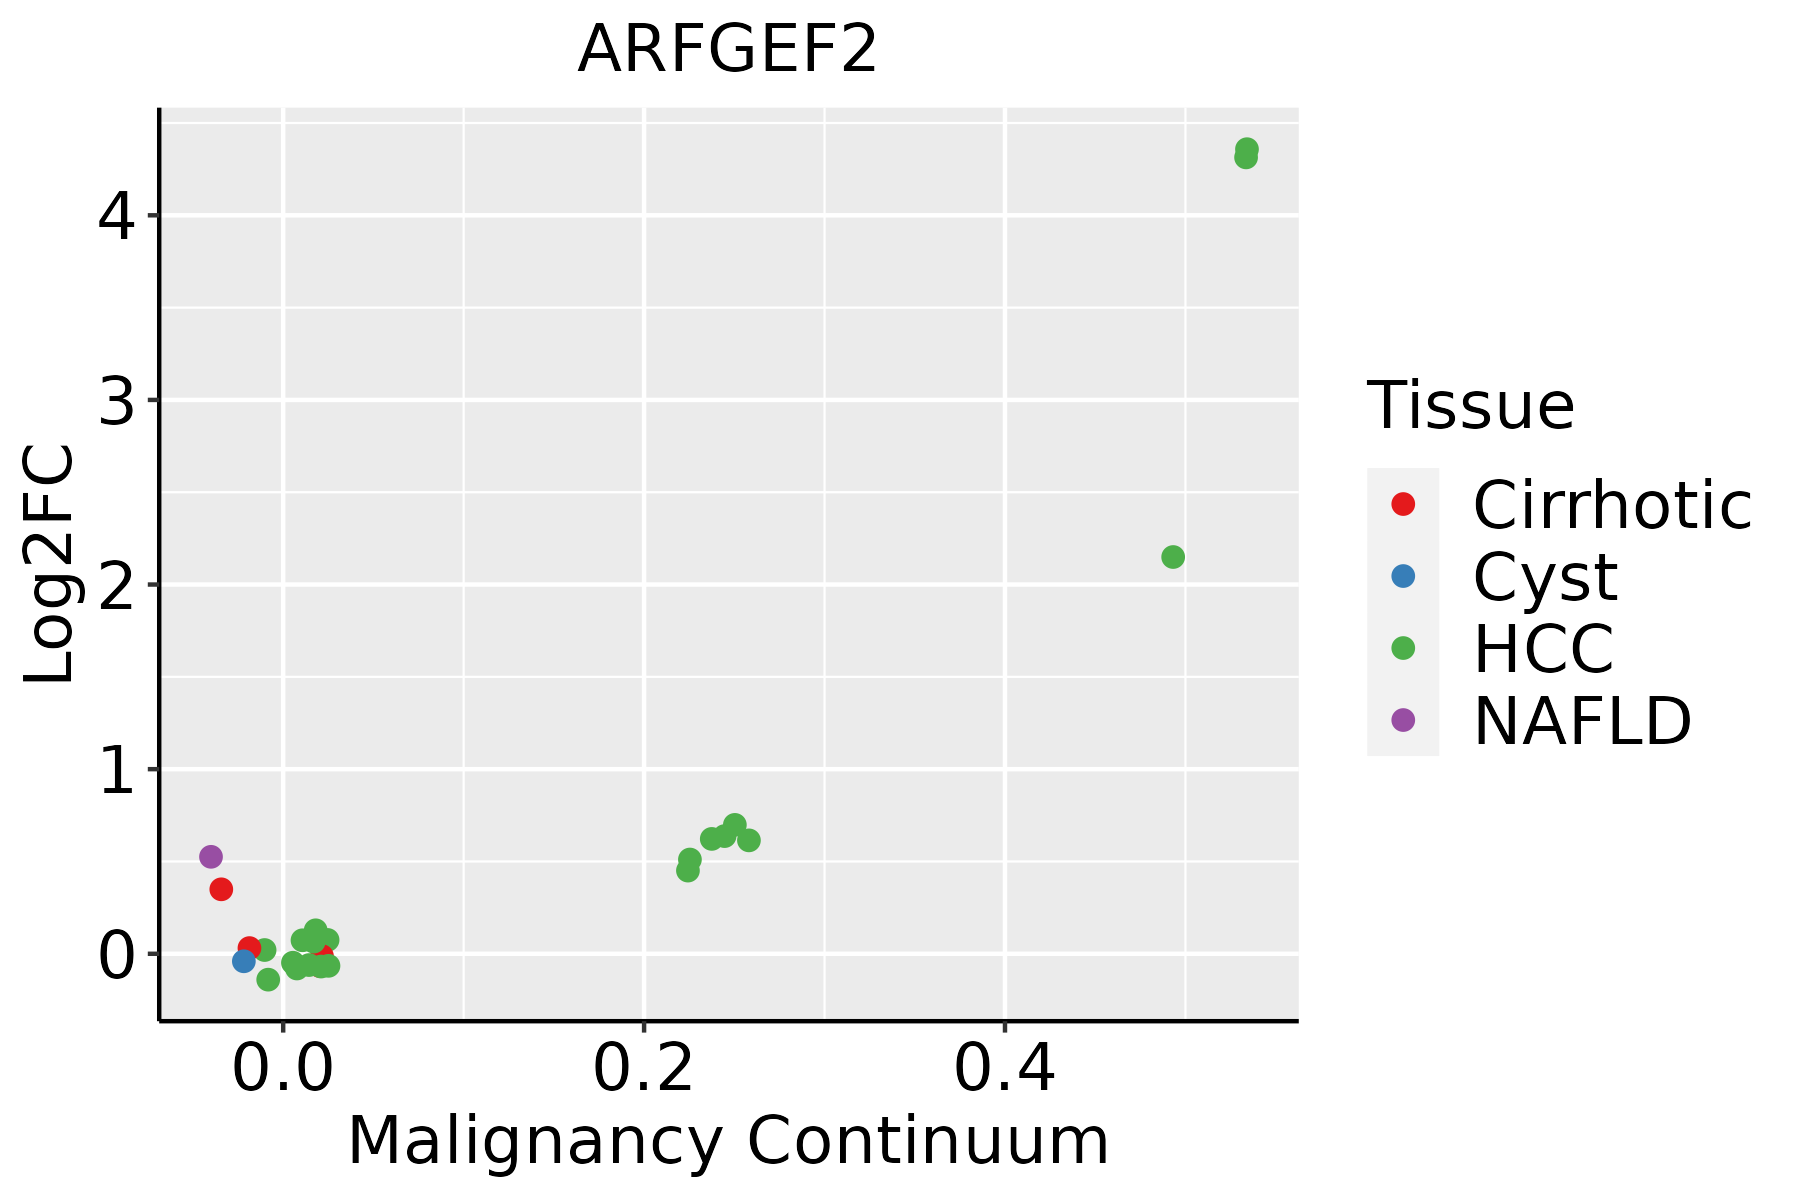 | HCC: Hepatocellular carcinoma |
| NAFLD: Non-alcoholic fatty liver disease | ||
| Lung | 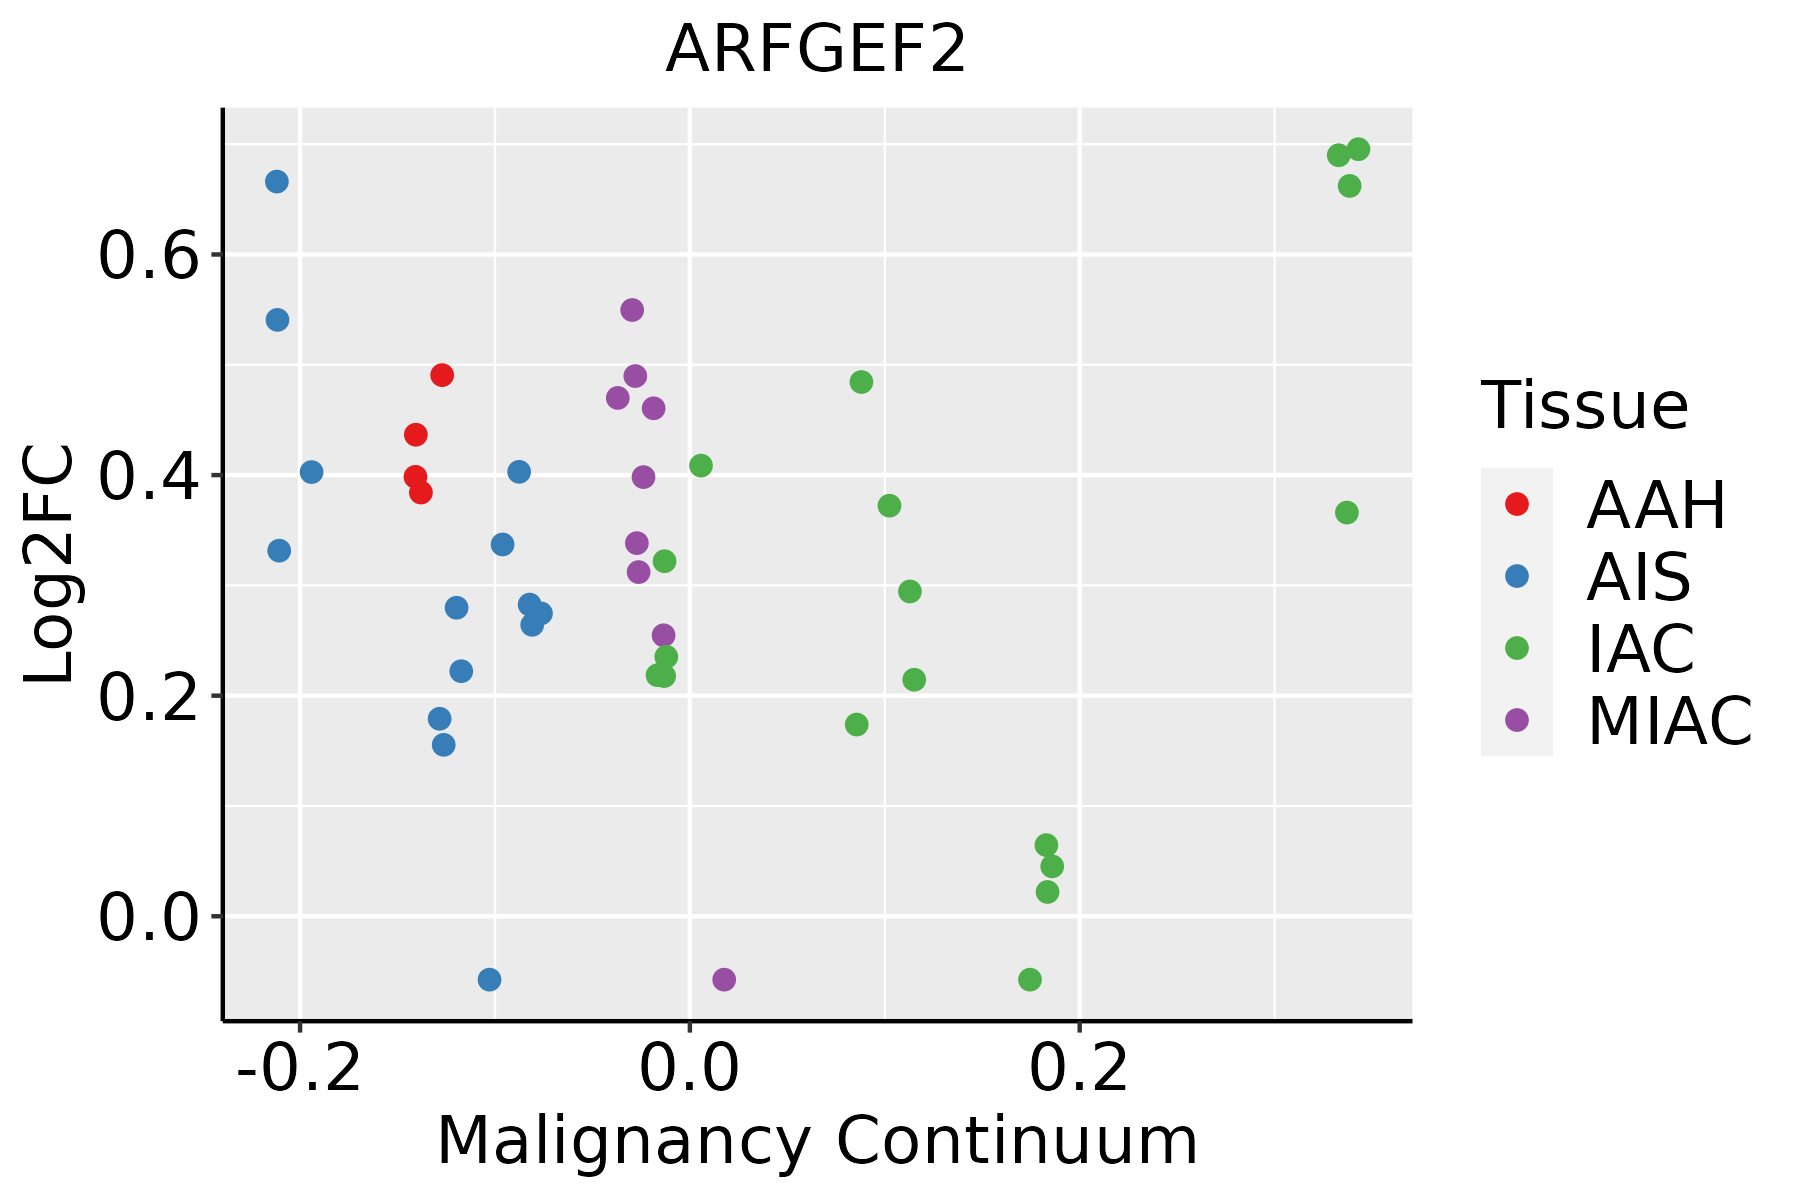 | AAH: Atypical adenomatous hyperplasia |
| AIS: Adenocarcinoma in situ | ||
| IAC: Invasive lung adenocarcinoma | ||
| MIA: Minimally invasive adenocarcinoma | ||
| Prostate | 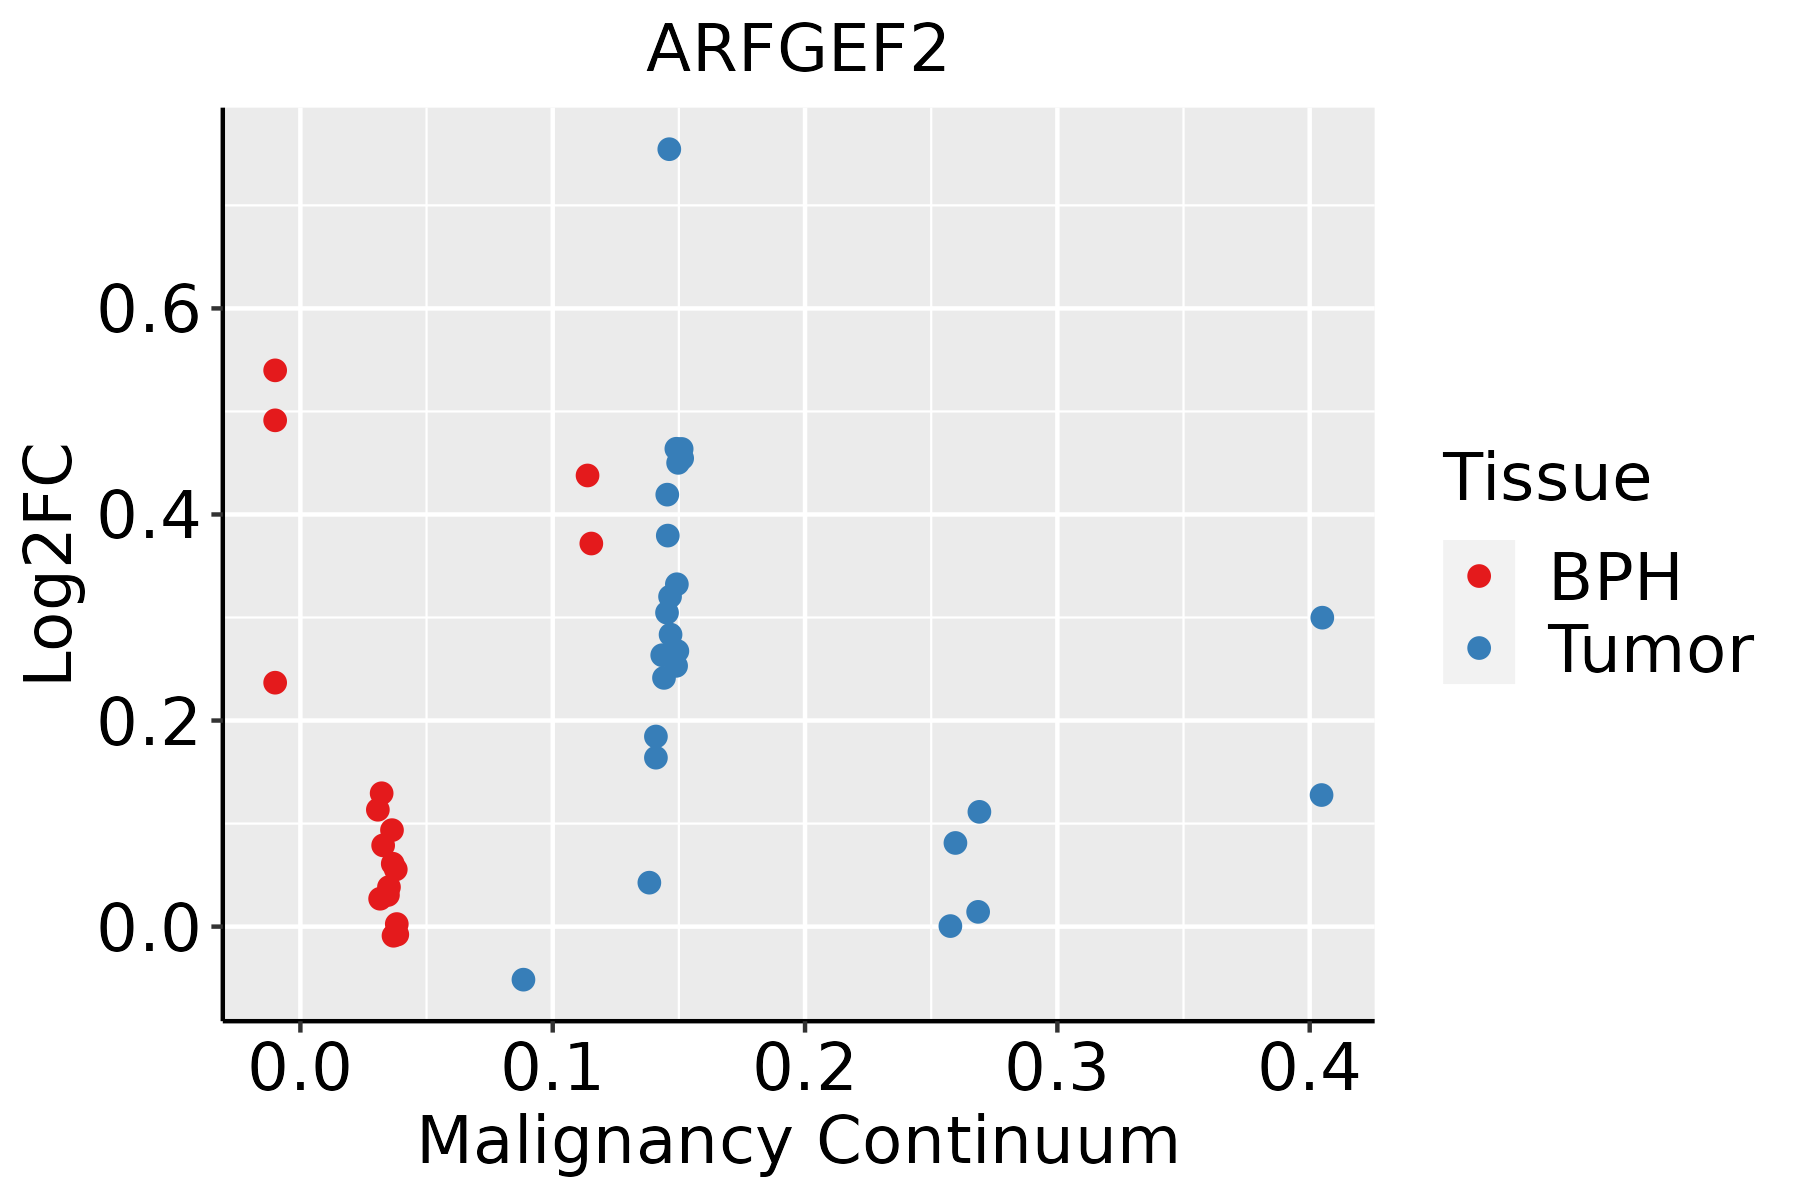 | BPH: Benign Prostatic Hyperplasia |
| Thyroid |  | ATC: Anaplastic thyroid cancer |
| HT: Hashimoto's thyroiditis | ||
| PTC: Papillary thyroid cancer |
| ∗log2FC in expression of this searched gene in stem-like cells from each diseased tissue sample relative to stem-like cells in normal samples in each tissue plotted against the malignancy continuum. Samples are colored based on if they are from different disease stage. |
Top |
Malignant transformation related pathway analysis |
| Find out the enriched GO biological processes and KEGG pathways involved in transition from healthy to precancer to cancer |
| Tissue | Disease Stage | Enriched GO biological Processes |
| Colorectum | AD |  |
| Colorectum | SER |  |
| Colorectum | MSS |  |
| Colorectum | MSI-H |  |
| Colorectum | FAP |  |
| ∗Top 15 enriched GO BP terms are showed in the bar plot of each disease state in each tissue. Each row represents a significant GO biological process which is colored according to the -log10(p.adjust). |
| Page: 1 2 3 4 5 6 7 8 9 |
| GO ID | Tissue | Disease Stage | Description | Gene Ratio | Bg Ratio | pvalue | p.adjust | Count |
| GO:00510566 | Cervix | CC | regulation of small GTPase mediated signal transduction | 75/2311 | 302/18723 | 1.54e-09 | 1.74e-07 | 75 |
| GO:00072656 | Cervix | CC | Ras protein signal transduction | 79/2311 | 337/18723 | 9.49e-09 | 7.77e-07 | 79 |
| GO:00018197 | Cervix | CC | positive regulation of cytokine production | 95/2311 | 467/18723 | 4.88e-07 | 1.85e-05 | 95 |
| GO:00465785 | Cervix | CC | regulation of Ras protein signal transduction | 44/2311 | 189/18723 | 2.05e-05 | 3.73e-04 | 44 |
| GO:00988767 | Cervix | CC | vesicle-mediated transport to the plasma membrane | 34/2311 | 136/18723 | 3.75e-05 | 5.91e-04 | 34 |
| GO:00068927 | Cervix | CC | post-Golgi vesicle-mediated transport | 28/2311 | 104/18723 | 4.31e-05 | 6.61e-04 | 28 |
| GO:00481938 | Cervix | CC | Golgi vesicle transport | 58/2311 | 296/18723 | 2.24e-04 | 2.54e-03 | 58 |
| GO:00431127 | Cervix | CC | receptor metabolic process | 37/2311 | 166/18723 | 2.31e-04 | 2.58e-03 | 37 |
| GO:00068936 | Cervix | CC | Golgi to plasma membrane transport | 16/2311 | 60/18723 | 2.00e-03 | 1.46e-02 | 16 |
| GO:00160506 | Cervix | CC | vesicle organization | 54/2311 | 300/18723 | 2.71e-03 | 1.85e-02 | 54 |
| GO:00068873 | Cervix | CC | exocytosis | 59/2311 | 352/18723 | 8.74e-03 | 4.48e-02 | 59 |
| GO:0048193 | Colorectum | AD | Golgi vesicle transport | 109/3918 | 296/18723 | 1.80e-10 | 1.68e-08 | 109 |
| GO:0098876 | Colorectum | AD | vesicle-mediated transport to the plasma membrane | 57/3918 | 136/18723 | 2.30e-08 | 1.27e-06 | 57 |
| GO:0016050 | Colorectum | AD | vesicle organization | 101/3918 | 300/18723 | 1.65e-07 | 7.17e-06 | 101 |
| GO:0006892 | Colorectum | AD | post-Golgi vesicle-mediated transport | 45/3918 | 104/18723 | 2.22e-07 | 9.26e-06 | 45 |
| GO:0043112 | Colorectum | AD | receptor metabolic process | 62/3918 | 166/18723 | 8.18e-07 | 2.85e-05 | 62 |
| GO:0007265 | Colorectum | AD | Ras protein signal transduction | 104/3918 | 337/18723 | 1.01e-05 | 2.35e-04 | 104 |
| GO:0051056 | Colorectum | AD | regulation of small GTPase mediated signal transduction | 94/3918 | 302/18723 | 1.81e-05 | 3.76e-04 | 94 |
| GO:0001881 | Colorectum | AD | receptor recycling | 18/3918 | 33/18723 | 2.23e-05 | 4.40e-04 | 18 |
| GO:0006893 | Colorectum | AD | Golgi to plasma membrane transport | 27/3918 | 60/18723 | 2.41e-05 | 4.66e-04 | 27 |
| Page: 1 2 3 4 5 6 7 8 |
| Pathway ID | Tissue | Disease Stage | Description | Gene Ratio | Bg Ratio | pvalue | p.adjust | qvalue | Count |
| hsa0414418 | Cervix | CC | Endocytosis | 64/1267 | 251/8465 | 6.97e-06 | 6.10e-05 | 3.61e-05 | 64 |
| hsa0414419 | Cervix | CC | Endocytosis | 64/1267 | 251/8465 | 6.97e-06 | 6.10e-05 | 3.61e-05 | 64 |
| hsa04144 | Colorectum | AD | Endocytosis | 111/2092 | 251/8465 | 5.95e-12 | 1.42e-10 | 9.08e-11 | 111 |
| hsa041441 | Colorectum | AD | Endocytosis | 111/2092 | 251/8465 | 5.95e-12 | 1.42e-10 | 9.08e-11 | 111 |
| hsa041444 | Colorectum | MSS | Endocytosis | 102/1875 | 251/8465 | 1.85e-11 | 4.43e-10 | 2.71e-10 | 102 |
| hsa041445 | Colorectum | MSS | Endocytosis | 102/1875 | 251/8465 | 1.85e-11 | 4.43e-10 | 2.71e-10 | 102 |
| hsa041446 | Colorectum | FAP | Endocytosis | 78/1404 | 251/8465 | 6.20e-09 | 2.96e-07 | 1.80e-07 | 78 |
| hsa041447 | Colorectum | FAP | Endocytosis | 78/1404 | 251/8465 | 6.20e-09 | 2.96e-07 | 1.80e-07 | 78 |
| hsa041448 | Colorectum | CRC | Endocytosis | 65/1091 | 251/8465 | 1.27e-08 | 1.06e-06 | 7.19e-07 | 65 |
| hsa041449 | Colorectum | CRC | Endocytosis | 65/1091 | 251/8465 | 1.27e-08 | 1.06e-06 | 7.19e-07 | 65 |
| hsa04144210 | Esophagus | ESCC | Endocytosis | 186/4205 | 251/8465 | 9.74e-16 | 4.66e-14 | 2.39e-14 | 186 |
| hsa0414437 | Esophagus | ESCC | Endocytosis | 186/4205 | 251/8465 | 9.74e-16 | 4.66e-14 | 2.39e-14 | 186 |
| hsa0414422 | Liver | HCC | Endocytosis | 178/4020 | 251/8465 | 2.03e-14 | 5.22e-13 | 2.91e-13 | 178 |
| hsa0414432 | Liver | HCC | Endocytosis | 178/4020 | 251/8465 | 2.03e-14 | 5.22e-13 | 2.91e-13 | 178 |
| hsa0414414 | Lung | IAC | Endocytosis | 51/1053 | 251/8465 | 2.25e-04 | 2.54e-03 | 1.68e-03 | 51 |
| hsa0414415 | Lung | IAC | Endocytosis | 51/1053 | 251/8465 | 2.25e-04 | 2.54e-03 | 1.68e-03 | 51 |
| hsa0414423 | Lung | AIS | Endocytosis | 52/961 | 251/8465 | 9.74e-06 | 3.04e-04 | 1.95e-04 | 52 |
| hsa0414433 | Lung | AIS | Endocytosis | 52/961 | 251/8465 | 9.74e-06 | 3.04e-04 | 1.95e-04 | 52 |
| hsa0414425 | Prostate | BPH | Endocytosis | 89/1718 | 251/8465 | 1.06e-08 | 1.29e-07 | 7.99e-08 | 89 |
| hsa04144111 | Prostate | BPH | Endocytosis | 89/1718 | 251/8465 | 1.06e-08 | 1.29e-07 | 7.99e-08 | 89 |
| Page: 1 2 |
Top |
Cell-cell communication analysis |
| Identification of potential cell-cell interactions between two cell types and their ligand-receptor pairs for different disease states |
| Ligand | Receptor | LRpair | Pathway | Tissue | Disease Stage |
| Page: 1 |
Top |
Single-cell gene regulatory network inference analysis |
| Find out the significant the regulons (TFs) and the target genes of each regulon across cell types for different disease states |
| TF | Cell Type | Tissue | Disease Stage | Target Gene | RSS | Regulon Activity |
| ∗The dot plots of a searched regulon are shown for all cell subpopulations in each disease state of each tissue based on the regulon specific score inferred using pySCENIC and by calculating the average expression. |
| Page: 1 |
Top |
Somatic mutation of malignant transformation related genes |
| Annotation of somatic variants for genes involved in malignant transformation |
| Hugo Symbol | Variant Class | Variant Classification | dbSNP RS | HGVSc | HGVSp | HGVSp Short | SWISSPROT | BIOTYPE | SIFT | PolyPhen | Tumor Sample Barcode | Tissue | Histology | Sex | Age | Stage | Therapy Types | Drugs | Outcome |
| ARFGEF2 | SNV | Missense_Mutation | c.1962N>G | p.Phe654Leu | p.F654L | Q9Y6D5 | protein_coding | deleterious(0) | probably_damaging(1) | TCGA-BH-A0DZ-01 | Breast | breast invasive carcinoma | Female | <65 | I/II | Chemotherapy | docetaxel | SD | |
| ARFGEF2 | SNV | Missense_Mutation | c.2026N>A | p.Glu676Lys | p.E676K | Q9Y6D5 | protein_coding | tolerated(0.23) | benign(0.391) | TCGA-BH-A0H9-01 | Breast | breast invasive carcinoma | Female | >=65 | I/II | Hormone Therapy | arimidex | SD | |
| ARFGEF2 | SNV | Missense_Mutation | c.817N>A | p.Glu273Lys | p.E273K | Q9Y6D5 | protein_coding | tolerated(0.46) | benign(0.014) | TCGA-D8-A27G-01 | Breast | breast invasive carcinoma | Female | >=65 | I/II | Unknown | Unknown | SD | |
| ARFGEF2 | SNV | Missense_Mutation | c.2851N>C | p.Phe951Leu | p.F951L | Q9Y6D5 | protein_coding | deleterious(0) | probably_damaging(0.999) | TCGA-E2-A1IL-01 | Breast | breast invasive carcinoma | Female | >=65 | I/II | Hormone Therapy | arimidex | SD | |
| ARFGEF2 | SNV | Missense_Mutation | novel | c.1595N>A | p.Arg532His | p.R532H | Q9Y6D5 | protein_coding | tolerated(0.15) | probably_damaging(0.986) | TCGA-E9-A54Y-01 | Breast | breast invasive carcinoma | Female | <65 | III/IV | Unknown | Unknown | SD |
| ARFGEF2 | SNV | Missense_Mutation | c.3508G>A | p.Glu1170Lys | p.E1170K | Q9Y6D5 | protein_coding | deleterious(0) | probably_damaging(1) | TCGA-EW-A1J5-01 | Breast | breast invasive carcinoma | Female | <65 | I/II | Chemotherapy | adriamycin | SD | |
| ARFGEF2 | insertion | In_Frame_Ins | novel | c.1886_1887insAAACCCCACTTCTACTAAAAA | p.Thr629_Val630insAsnProThrSerThrLysAsn | p.T629_V630insNPTSTKN | Q9Y6D5 | protein_coding | TCGA-A2-A04Y-01 | Breast | breast invasive carcinoma | Female | <65 | I/II | Chemotherapy | cytoxan | SD | ||
| ARFGEF2 | insertion | Nonsense_Mutation | novel | c.3959_3960insCGTGTTGTAAGCGCTTGATGAGTATTAATCT | p.Gly1321ValfsTer3 | p.G1321Vfs*3 | Q9Y6D5 | protein_coding | TCGA-A8-A06X-01 | Breast | breast invasive carcinoma | Female | >=65 | I/II | Unknown | Unknown | SD | ||
| ARFGEF2 | insertion | Nonsense_Mutation | novel | c.4621_4622insTCCCAAAACACTGAAATAGGGTGAAAA | p.Ala1541delinsValProLysHisTerAsnArgValLysThr | p.A1541delinsVPKH*NRVKT | Q9Y6D5 | protein_coding | TCGA-B6-A0IN-01 | Breast | breast invasive carcinoma | Female | <65 | I/II | Unknown | Unknown | PD | ||
| ARFGEF2 | insertion | Nonsense_Mutation | novel | c.2502_2503insTTTTAGTCATCTTTATAT | p.Glu834_Leu835insPheTerSerSerLeuTyr | p.E834_L835insF*SSLY | Q9Y6D5 | protein_coding | TCGA-BH-A0GY-01 | Breast | breast invasive carcinoma | Female | >=65 | I/II | Chemotherapy | cyotxan | SD |
| Page: 1 2 3 4 5 6 7 8 9 10 11 12 13 14 15 16 17 18 19 20 21 |
Top |
Related drugs of malignant transformation related genes |
| Identification of chemicals and drugs interact with genes involved in malignant transfromation |
| (DGIdb 4.0) |
| Entrez ID | Symbol | Category | Interaction Types | Drug Claim Name | Drug Name | PMIDs |
| Page: 1 |

Copyright 2023-Present -The University of Texas Health Science Center at Houston |