
|
|||||
|
 | |
| |
| |
| |
| |
| |
|
Gene: ARFGAP3 |
Gene summary for ARFGAP3 |
| Gene information | Species | Human | Gene symbol | ARFGAP3 | Gene ID | 26286 |
| Gene name | ADP ribosylation factor GTPase activating protein 3 | |
| Gene Alias | ARFGAP1 | |
| Cytomap | 22q13.2 | |
| Gene Type | protein-coding | GO ID | GO:0006810 | UniProtAcc | Q9NP61 |
Top |
Malignant transformation analysis |
| Identification of the aberrant gene expression in precancerous and cancerous lesions by comparing the gene expression of stem-like cells in diseased tissues with normal stem cells |
| Entrez ID | Symbol | Replicates | Species | Organ | Tissue | Adj P-value | Log2FC | Malignancy |
| 26286 | ARFGAP3 | HTA11_347_2000001011 | Human | Colorectum | AD | 3.76e-02 | 2.10e-01 | -0.1954 |
| 26286 | ARFGAP3 | HTA11_411_2000001011 | Human | Colorectum | SER | 7.98e-03 | 7.44e-01 | -0.2602 |
| 26286 | ARFGAP3 | HTA11_99999971662_82457 | Human | Colorectum | MSS | 4.21e-03 | 3.23e-01 | 0.3859 |
| 26286 | ARFGAP3 | A002-C-016 | Human | Colorectum | FAP | 4.90e-02 | -1.05e-01 | 0.0521 |
| 26286 | ARFGAP3 | A001-C-203 | Human | Colorectum | FAP | 3.22e-02 | -1.60e-01 | -0.0481 |
| 26286 | ARFGAP3 | A002-C-116 | Human | Colorectum | FAP | 1.03e-05 | -1.49e-01 | -0.0452 |
| 26286 | ARFGAP3 | LZE4T | Human | Esophagus | ESCC | 1.04e-14 | 2.86e-01 | 0.0811 |
| 26286 | ARFGAP3 | LZE7T | Human | Esophagus | ESCC | 1.01e-06 | 3.35e-01 | 0.0667 |
| 26286 | ARFGAP3 | LZE8T | Human | Esophagus | ESCC | 5.35e-07 | 6.74e-02 | 0.067 |
| 26286 | ARFGAP3 | LZE20T | Human | Esophagus | ESCC | 9.07e-03 | 1.80e-01 | 0.0662 |
| 26286 | ARFGAP3 | LZE22T | Human | Esophagus | ESCC | 9.37e-05 | 2.61e-01 | 0.068 |
| 26286 | ARFGAP3 | LZE24T | Human | Esophagus | ESCC | 2.26e-18 | 6.60e-01 | 0.0596 |
| 26286 | ARFGAP3 | LZE21T | Human | Esophagus | ESCC | 1.98e-05 | 1.37e-01 | 0.0655 |
| 26286 | ARFGAP3 | LZE6T | Human | Esophagus | ESCC | 7.48e-08 | 2.22e-01 | 0.0845 |
| 26286 | ARFGAP3 | P1T-E | Human | Esophagus | ESCC | 2.17e-02 | 3.99e-01 | 0.0875 |
| 26286 | ARFGAP3 | P2T-E | Human | Esophagus | ESCC | 1.33e-21 | 3.42e-01 | 0.1177 |
| 26286 | ARFGAP3 | P4T-E | Human | Esophagus | ESCC | 1.29e-19 | 3.10e-01 | 0.1323 |
| 26286 | ARFGAP3 | P5T-E | Human | Esophagus | ESCC | 1.76e-20 | 2.94e-01 | 0.1327 |
| 26286 | ARFGAP3 | P8T-E | Human | Esophagus | ESCC | 2.30e-25 | 4.49e-01 | 0.0889 |
| 26286 | ARFGAP3 | P9T-E | Human | Esophagus | ESCC | 1.76e-18 | 3.63e-01 | 0.1131 |
| Page: 1 2 3 4 5 6 7 |
| Tissue | Expression Dynamics | Abbreviation |
| Colorectum (GSE201348) |  | FAP: Familial adenomatous polyposis |
| CRC: Colorectal cancer | ||
| Colorectum (HTA11) |  | AD: Adenomas |
| SER: Sessile serrated lesions | ||
| MSI-H: Microsatellite-high colorectal cancer | ||
| MSS: Microsatellite stable colorectal cancer | ||
| Esophagus | 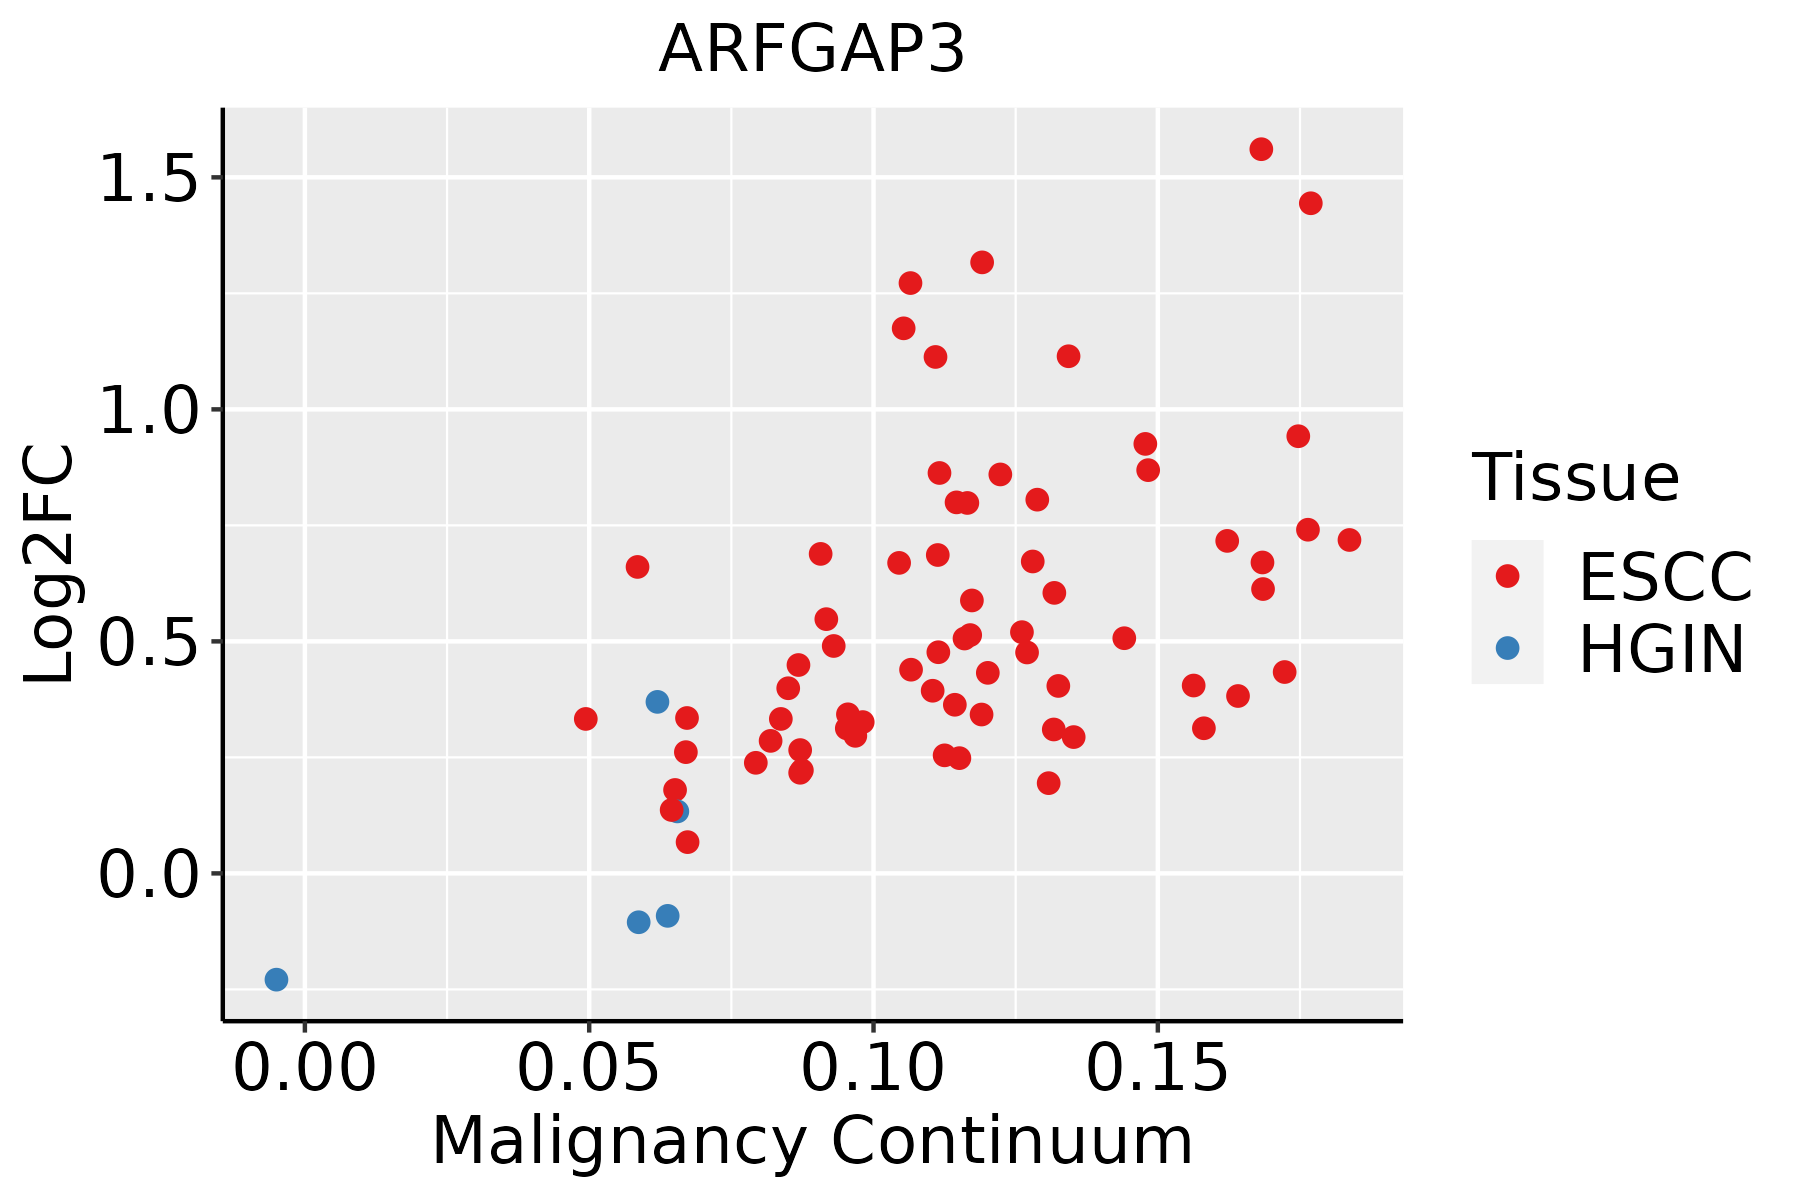 | ESCC: Esophageal squamous cell carcinoma |
| HGIN: High-grade intraepithelial neoplasias | ||
| LGIN: Low-grade intraepithelial neoplasias | ||
| Liver | 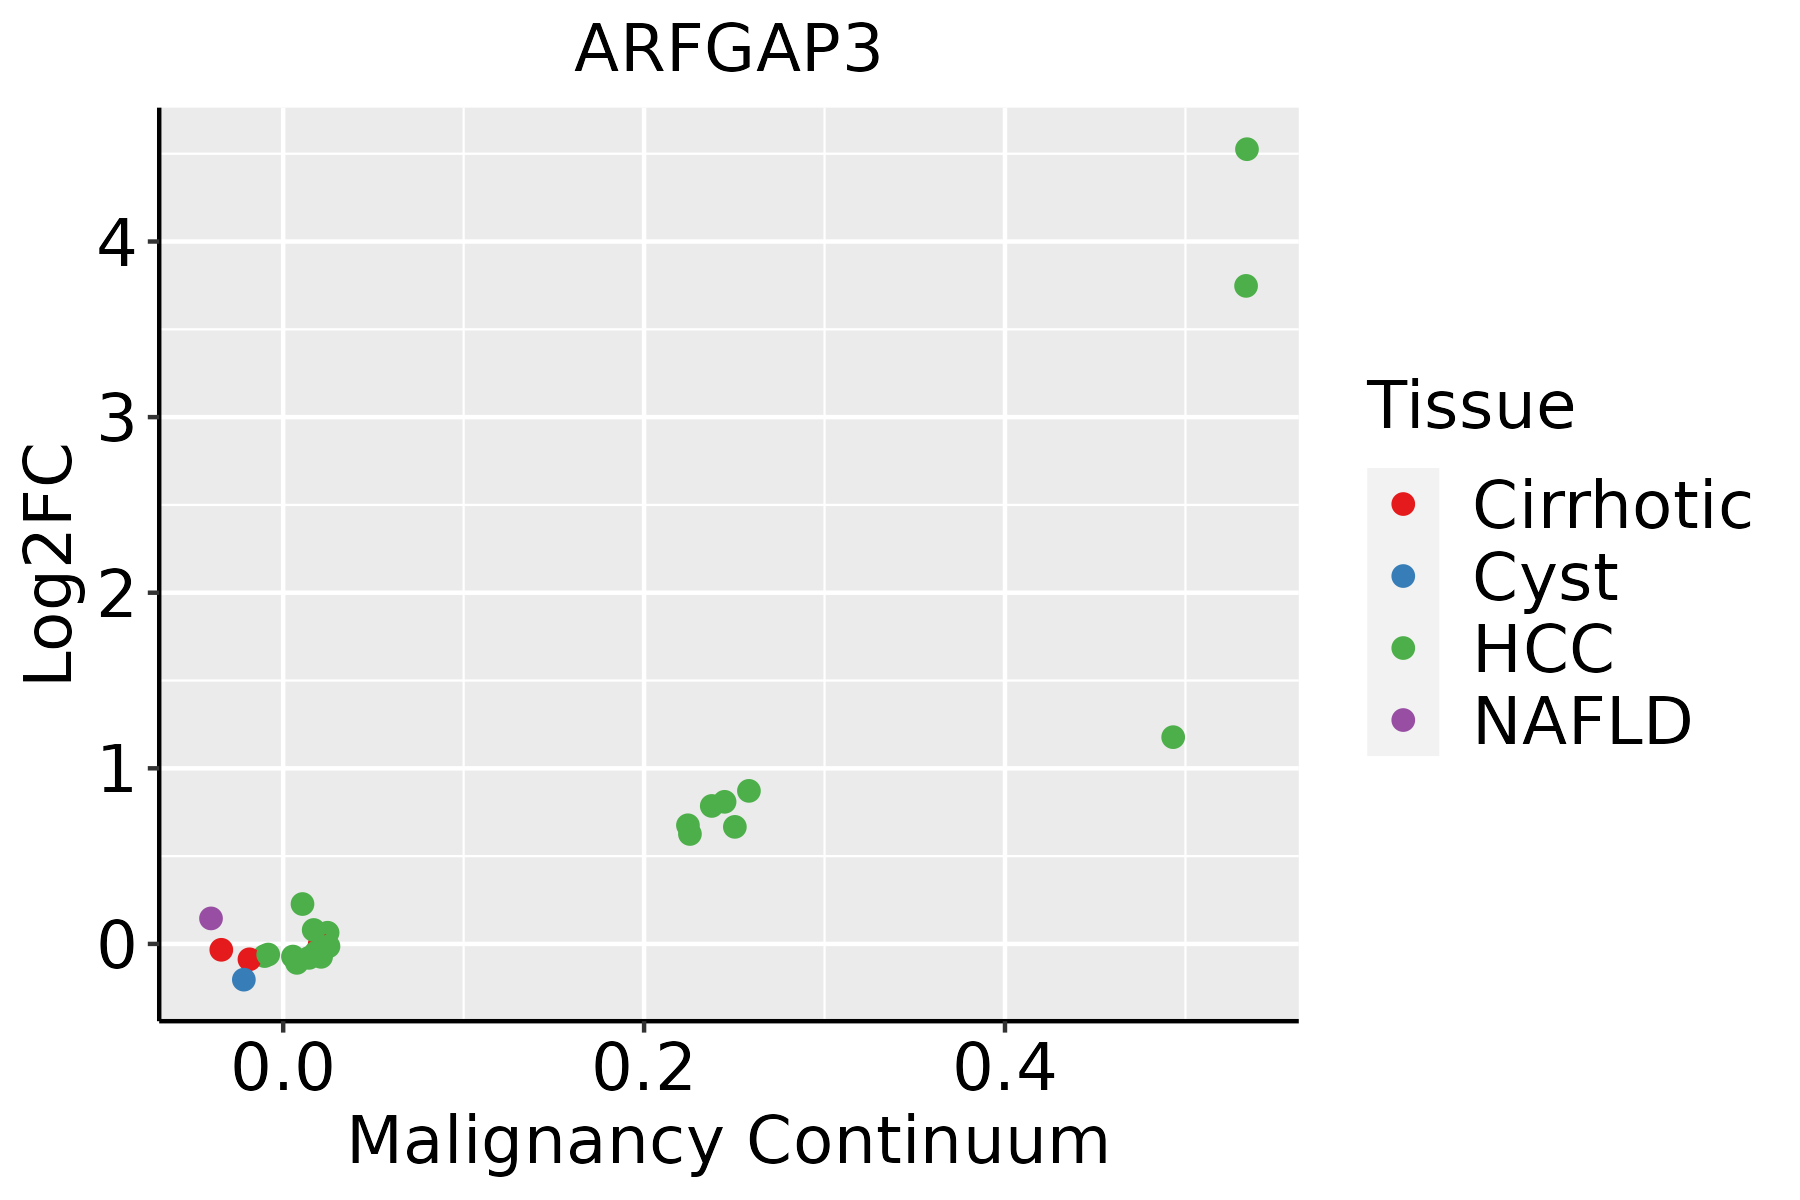 | HCC: Hepatocellular carcinoma |
| NAFLD: Non-alcoholic fatty liver disease | ||
| Oral Cavity | 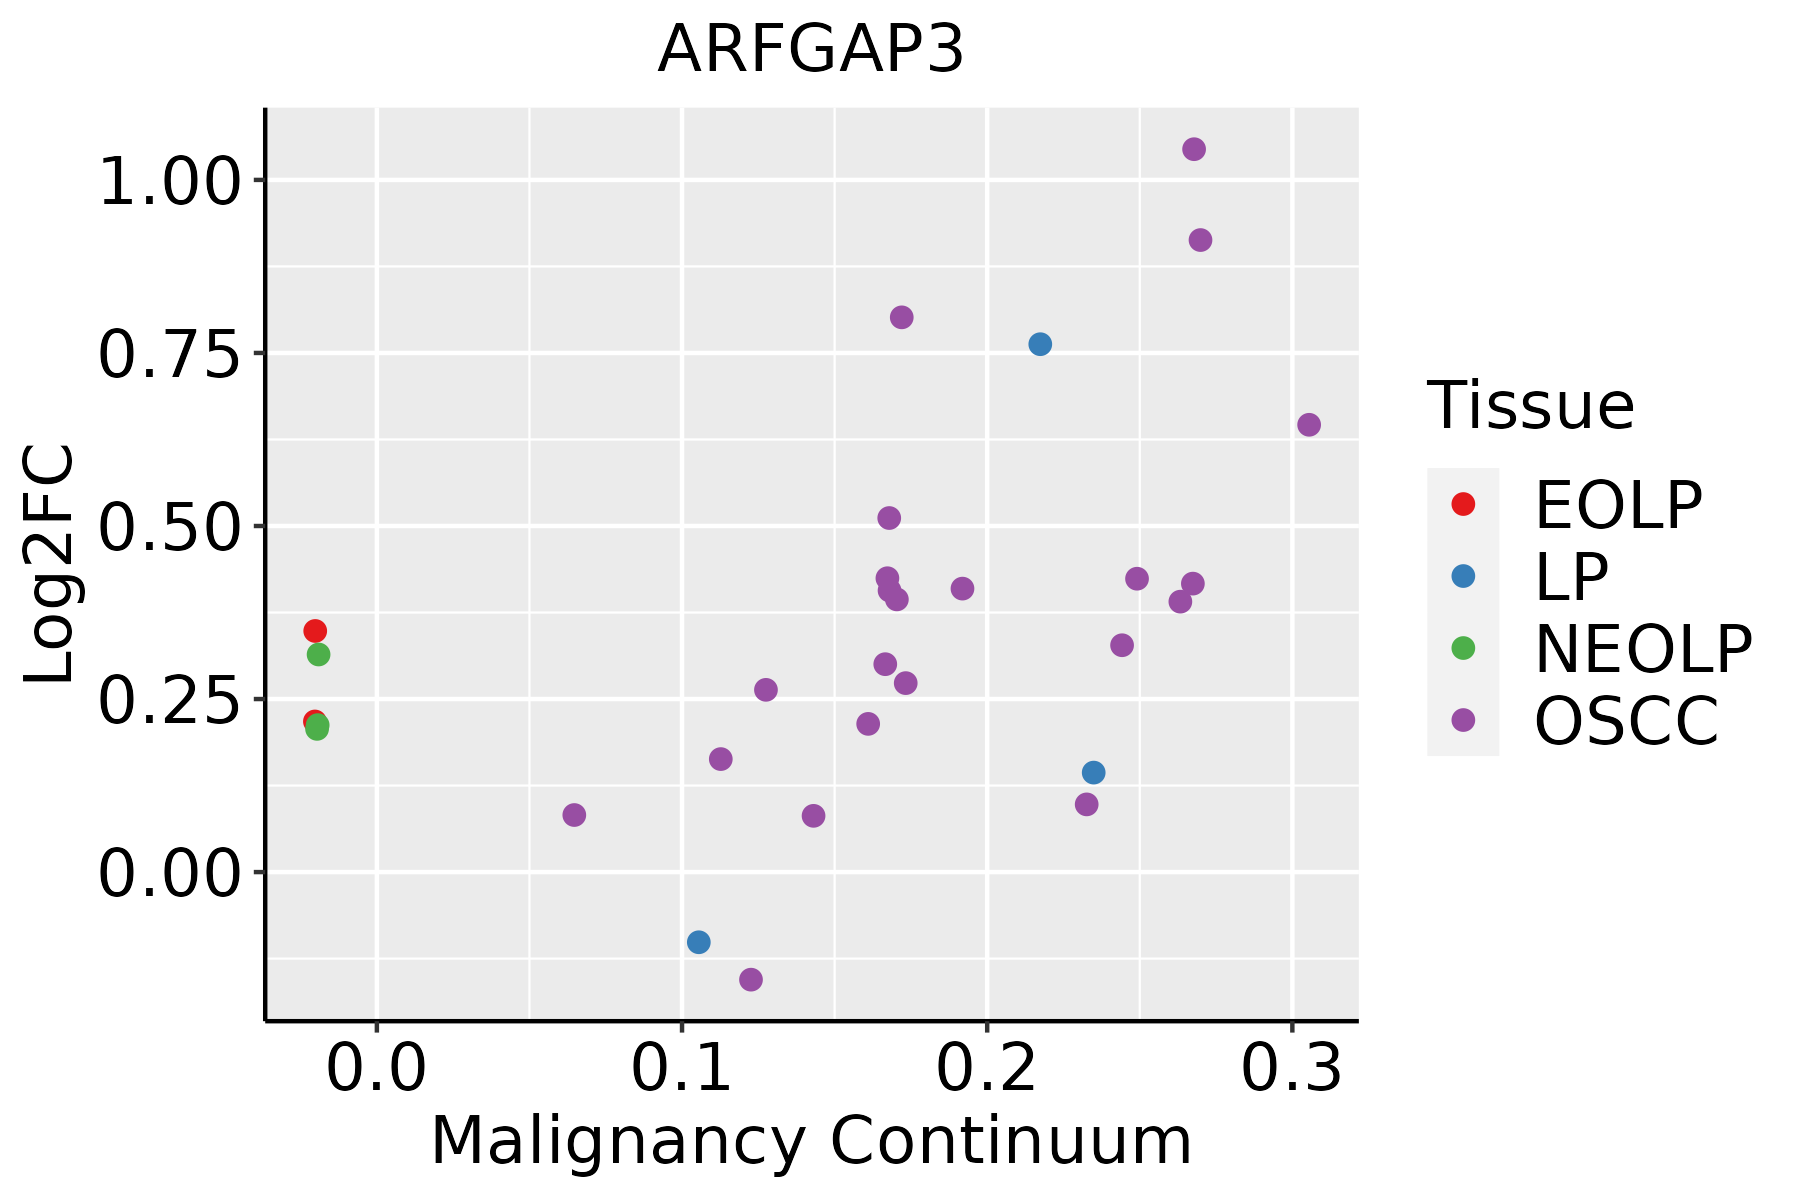 | EOLP: Erosive Oral lichen planus |
| LP: leukoplakia | ||
| NEOLP: Non-erosive oral lichen planus | ||
| OSCC: Oral squamous cell carcinoma | ||
| Prostate | 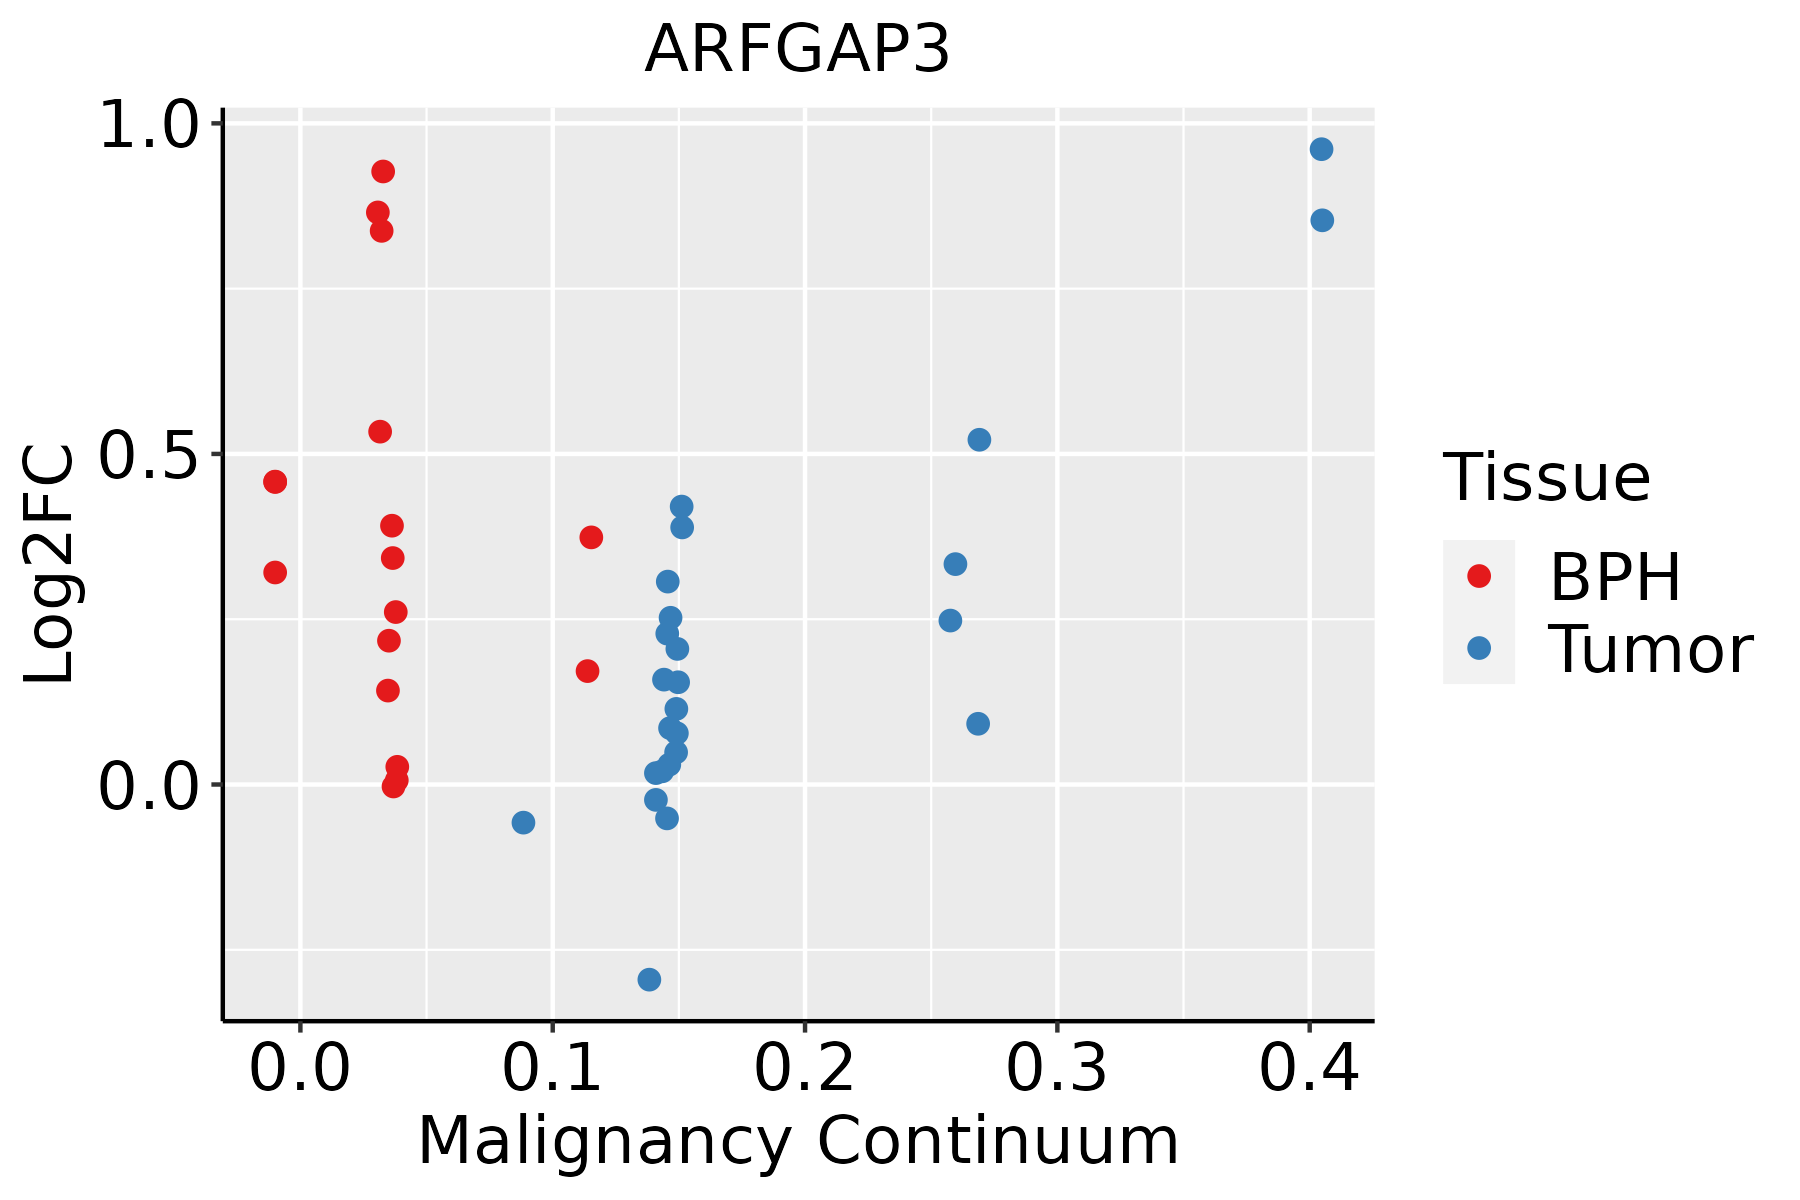 | BPH: Benign Prostatic Hyperplasia |
| Thyroid | 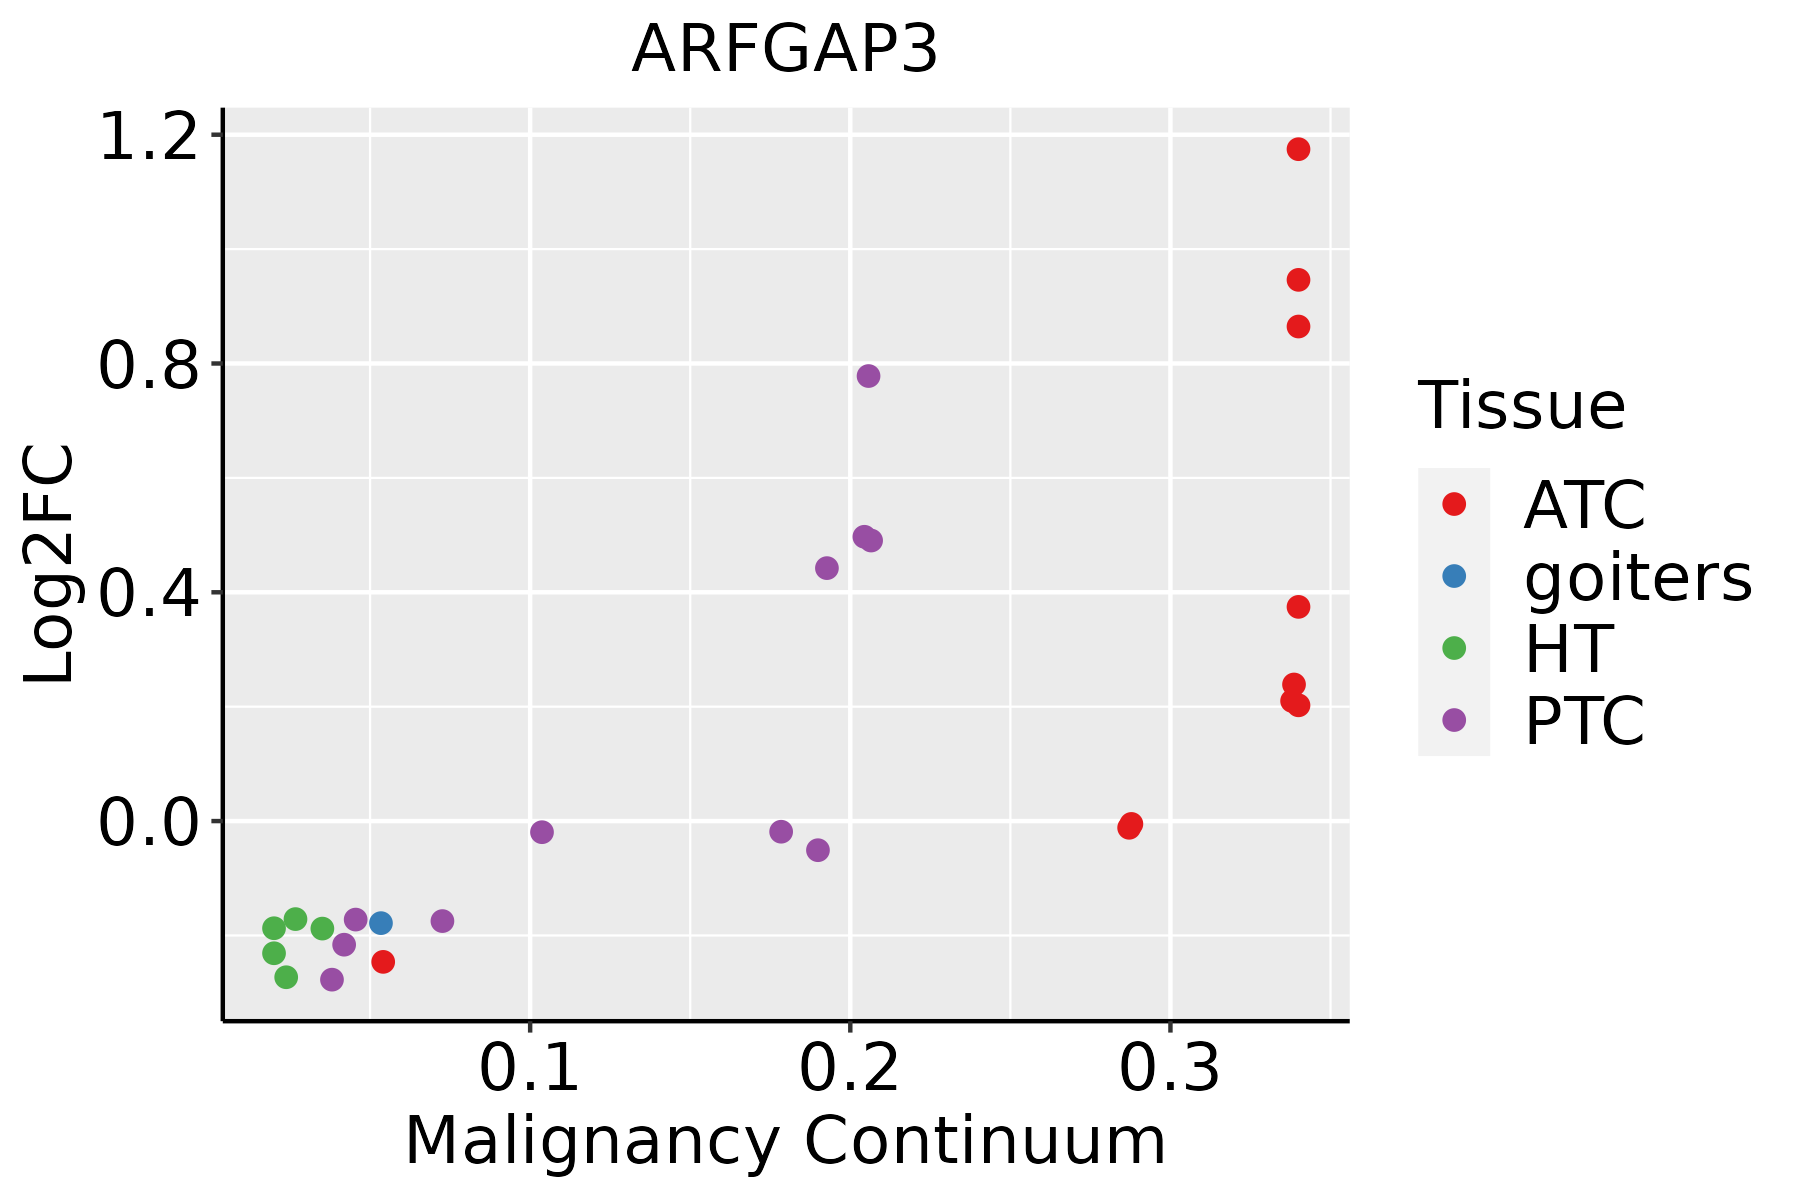 | ATC: Anaplastic thyroid cancer |
| HT: Hashimoto's thyroiditis | ||
| PTC: Papillary thyroid cancer |
| ∗log2FC in expression of this searched gene in stem-like cells from each diseased tissue sample relative to stem-like cells in normal samples in each tissue plotted against the malignancy continuum. Samples are colored based on if they are from different disease stage. |
Top |
Malignant transformation related pathway analysis |
| Find out the enriched GO biological processes and KEGG pathways involved in transition from healthy to precancer to cancer |
| Tissue | Disease Stage | Enriched GO biological Processes |
| Colorectum | AD |  |
| Colorectum | SER |  |
| Colorectum | MSS |  |
| Colorectum | MSI-H |  |
| Colorectum | FAP |  |
| ∗Top 15 enriched GO BP terms are showed in the bar plot of each disease state in each tissue. Each row represents a significant GO biological process which is colored according to the -log10(p.adjust). |
| Page: 1 2 3 4 5 6 7 8 9 |
| GO ID | Tissue | Disease Stage | Description | Gene Ratio | Bg Ratio | pvalue | p.adjust | Count |
| GO:0048193 | Colorectum | AD | Golgi vesicle transport | 109/3918 | 296/18723 | 1.80e-10 | 1.68e-08 | 109 |
| GO:0051656 | Colorectum | AD | establishment of organelle localization | 131/3918 | 390/18723 | 3.00e-09 | 2.06e-07 | 131 |
| GO:0006900 | Colorectum | AD | vesicle budding from membrane | 32/3918 | 61/18723 | 5.38e-08 | 2.81e-06 | 32 |
| GO:0016050 | Colorectum | AD | vesicle organization | 101/3918 | 300/18723 | 1.65e-07 | 7.17e-06 | 101 |
| GO:0051650 | Colorectum | AD | establishment of vesicle localization | 57/3918 | 161/18723 | 1.47e-05 | 3.15e-04 | 57 |
| GO:0051648 | Colorectum | AD | vesicle localization | 59/3918 | 177/18723 | 7.83e-05 | 1.25e-03 | 59 |
| GO:0009306 | Colorectum | AD | protein secretion | 105/3918 | 359/18723 | 1.05e-04 | 1.57e-03 | 105 |
| GO:0035592 | Colorectum | AD | establishment of protein localization to extracellular region | 105/3918 | 360/18723 | 1.18e-04 | 1.73e-03 | 105 |
| GO:0071692 | Colorectum | AD | protein localization to extracellular region | 106/3918 | 368/18723 | 1.86e-04 | 2.49e-03 | 106 |
| GO:0006903 | Colorectum | AD | vesicle targeting | 19/3918 | 45/18723 | 9.94e-04 | 9.28e-03 | 19 |
| GO:0048194 | Colorectum | AD | Golgi vesicle budding | 7/3918 | 10/18723 | 1.15e-03 | 1.04e-02 | 7 |
| GO:0006901 | Colorectum | AD | vesicle coating | 9/3918 | 17/18723 | 3.57e-03 | 2.57e-02 | 9 |
| GO:00516561 | Colorectum | SER | establishment of organelle localization | 100/2897 | 390/18723 | 1.11e-07 | 6.79e-06 | 100 |
| GO:00481931 | Colorectum | SER | Golgi vesicle transport | 79/2897 | 296/18723 | 4.20e-07 | 2.15e-05 | 79 |
| GO:00069001 | Colorectum | SER | vesicle budding from membrane | 23/2897 | 61/18723 | 1.95e-05 | 5.66e-04 | 23 |
| GO:00516501 | Colorectum | SER | establishment of vesicle localization | 42/2897 | 161/18723 | 3.38e-04 | 5.35e-03 | 42 |
| GO:00160501 | Colorectum | SER | vesicle organization | 69/2897 | 300/18723 | 3.59e-04 | 5.61e-03 | 69 |
| GO:00093061 | Colorectum | SER | protein secretion | 79/2897 | 359/18723 | 5.99e-04 | 8.19e-03 | 79 |
| GO:00355921 | Colorectum | SER | establishment of protein localization to extracellular region | 79/2897 | 360/18723 | 6.54e-04 | 8.77e-03 | 79 |
| GO:00716921 | Colorectum | SER | protein localization to extracellular region | 80/2897 | 368/18723 | 8.13e-04 | 1.01e-02 | 80 |
| Page: 1 2 3 4 5 6 7 8 9 |
| Pathway ID | Tissue | Disease Stage | Description | Gene Ratio | Bg Ratio | pvalue | p.adjust | qvalue | Count |
| hsa04144 | Colorectum | AD | Endocytosis | 111/2092 | 251/8465 | 5.95e-12 | 1.42e-10 | 9.08e-11 | 111 |
| hsa041441 | Colorectum | AD | Endocytosis | 111/2092 | 251/8465 | 5.95e-12 | 1.42e-10 | 9.08e-11 | 111 |
| hsa041442 | Colorectum | SER | Endocytosis | 81/1580 | 251/8465 | 1.14e-07 | 2.36e-06 | 1.71e-06 | 81 |
| hsa041443 | Colorectum | SER | Endocytosis | 81/1580 | 251/8465 | 1.14e-07 | 2.36e-06 | 1.71e-06 | 81 |
| hsa041444 | Colorectum | MSS | Endocytosis | 102/1875 | 251/8465 | 1.85e-11 | 4.43e-10 | 2.71e-10 | 102 |
| hsa041445 | Colorectum | MSS | Endocytosis | 102/1875 | 251/8465 | 1.85e-11 | 4.43e-10 | 2.71e-10 | 102 |
| hsa041446 | Colorectum | FAP | Endocytosis | 78/1404 | 251/8465 | 6.20e-09 | 2.96e-07 | 1.80e-07 | 78 |
| hsa041447 | Colorectum | FAP | Endocytosis | 78/1404 | 251/8465 | 6.20e-09 | 2.96e-07 | 1.80e-07 | 78 |
| hsa04144210 | Esophagus | ESCC | Endocytosis | 186/4205 | 251/8465 | 9.74e-16 | 4.66e-14 | 2.39e-14 | 186 |
| hsa0414437 | Esophagus | ESCC | Endocytosis | 186/4205 | 251/8465 | 9.74e-16 | 4.66e-14 | 2.39e-14 | 186 |
| hsa0414412 | Liver | Cirrhotic | Endocytosis | 119/2530 | 251/8465 | 2.33e-09 | 4.56e-08 | 2.81e-08 | 119 |
| hsa0414413 | Liver | Cirrhotic | Endocytosis | 119/2530 | 251/8465 | 2.33e-09 | 4.56e-08 | 2.81e-08 | 119 |
| hsa0414422 | Liver | HCC | Endocytosis | 178/4020 | 251/8465 | 2.03e-14 | 5.22e-13 | 2.91e-13 | 178 |
| hsa0414432 | Liver | HCC | Endocytosis | 178/4020 | 251/8465 | 2.03e-14 | 5.22e-13 | 2.91e-13 | 178 |
| hsa0414427 | Oral cavity | OSCC | Endocytosis | 174/3704 | 251/8465 | 9.42e-17 | 4.51e-15 | 2.29e-15 | 174 |
| hsa04144112 | Oral cavity | OSCC | Endocytosis | 174/3704 | 251/8465 | 9.42e-17 | 4.51e-15 | 2.29e-15 | 174 |
| hsa0414442 | Oral cavity | EOLP | Endocytosis | 71/1218 | 251/8465 | 5.28e-09 | 8.97e-08 | 5.29e-08 | 71 |
| hsa0414452 | Oral cavity | EOLP | Endocytosis | 71/1218 | 251/8465 | 5.28e-09 | 8.97e-08 | 5.29e-08 | 71 |
| hsa0414461 | Oral cavity | NEOLP | Endocytosis | 62/1112 | 251/8465 | 3.56e-07 | 4.92e-06 | 3.09e-06 | 62 |
| hsa0414471 | Oral cavity | NEOLP | Endocytosis | 62/1112 | 251/8465 | 3.56e-07 | 4.92e-06 | 3.09e-06 | 62 |
| Page: 1 2 |
Top |
Cell-cell communication analysis |
| Identification of potential cell-cell interactions between two cell types and their ligand-receptor pairs for different disease states |
| Ligand | Receptor | LRpair | Pathway | Tissue | Disease Stage |
| Page: 1 |
Top |
Single-cell gene regulatory network inference analysis |
| Find out the significant the regulons (TFs) and the target genes of each regulon across cell types for different disease states |
| TF | Cell Type | Tissue | Disease Stage | Target Gene | RSS | Regulon Activity |
| ∗The dot plots of a searched regulon are shown for all cell subpopulations in each disease state of each tissue based on the regulon specific score inferred using pySCENIC and by calculating the average expression. |
| Page: 1 |
Top |
Somatic mutation of malignant transformation related genes |
| Annotation of somatic variants for genes involved in malignant transformation |
| Hugo Symbol | Variant Class | Variant Classification | dbSNP RS | HGVSc | HGVSp | HGVSp Short | SWISSPROT | BIOTYPE | SIFT | PolyPhen | Tumor Sample Barcode | Tissue | Histology | Sex | Age | Stage | Therapy Types | Drugs | Outcome |
| ARFGAP3 | SNV | Missense_Mutation | c.981A>G | p.Ile327Met | p.I327M | Q9NP61 | protein_coding | deleterious(0) | possibly_damaging(0.877) | TCGA-D8-A1Y1-01 | Breast | breast invasive carcinoma | Female | >=65 | III/IV | Hormone Therapy | tamoxiphen | PD | |
| ARFGAP3 | insertion | Nonsense_Mutation | novel | c.1451_1452insGGCGGGGTGTCCCGGTTGAAAATGGGGATGTTGGGCCAGGTGAGG | p.Asp484delinsGluAlaGlyCysProGlyTerLysTrpGlyCysTrpAlaArgTerGly | p.D484delinsEAGCPG*KWGCWAR*G | Q9NP61 | protein_coding | TCGA-A8-A091-01 | Breast | breast invasive carcinoma | Female | <65 | I/II | Chemotherapy | 5-fluorouracil | PD | ||
| ARFGAP3 | insertion | Frame_Shift_Ins | novel | c.896_897insA | p.Asn299LysfsTer3 | p.N299Kfs*3 | Q9NP61 | protein_coding | TCGA-EA-A3HU-01 | Cervix | cervical & endocervical cancer | Female | <65 | I/II | Unknown | Unknown | SD | ||
| ARFGAP3 | SNV | Missense_Mutation | c.1267N>G | p.Asn423Asp | p.N423D | Q9NP61 | protein_coding | tolerated(0.27) | probably_damaging(0.993) | TCGA-AA-3811-01 | Colorectum | colon adenocarcinoma | Female | >=65 | III/IV | Unknown | Unknown | PD | |
| ARFGAP3 | SNV | Missense_Mutation | c.1100N>A | p.Ser367Tyr | p.S367Y | Q9NP61 | protein_coding | tolerated(0.62) | benign(0.413) | TCGA-AA-A00N-01 | Colorectum | colon adenocarcinoma | Male | >=65 | I/II | Unknown | Unknown | PD | |
| ARFGAP3 | SNV | Missense_Mutation | c.1481N>T | p.Ser494Leu | p.S494L | Q9NP61 | protein_coding | deleterious(0.01) | probably_damaging(0.996) | TCGA-AA-A010-01 | Colorectum | colon adenocarcinoma | Female | <65 | I/II | Chemotherapy | folinic | CR | |
| ARFGAP3 | SNV | Missense_Mutation | rs756482945 | c.356N>T | p.Ser119Leu | p.S119L | Q9NP61 | protein_coding | deleterious(0.03) | benign(0.371) | TCGA-AZ-4315-01 | Colorectum | colon adenocarcinoma | Male | <65 | I/II | Unknown | Unknown | SD |
| ARFGAP3 | SNV | Missense_Mutation | c.180N>G | p.Ser60Arg | p.S60R | Q9NP61 | protein_coding | deleterious(0) | probably_damaging(0.968) | TCGA-CM-4743-01 | Colorectum | colon adenocarcinoma | Male | >=65 | I/II | Chemotherapy | capecitabine | SD | |
| ARFGAP3 | SNV | Missense_Mutation | novel | c.791N>C | p.Val264Ala | p.V264A | Q9NP61 | protein_coding | tolerated(0.67) | benign(0) | TCGA-DM-A1HB-01 | Colorectum | colon adenocarcinoma | Male | >=65 | III/IV | Unknown | Unknown | SD |
| ARFGAP3 | insertion | Nonsense_Mutation | novel | c.725_726insGTATTAATA | p.Phe242delinsLeuTyrTerTyr | p.F242delinsLY*Y | Q9NP61 | protein_coding | TCGA-AM-5820-01 | Colorectum | colon adenocarcinoma | Female | <65 | I/II | Unknown | Unknown | SD |
| Page: 1 2 3 4 5 6 |
Top |
Related drugs of malignant transformation related genes |
| Identification of chemicals and drugs interact with genes involved in malignant transfromation |
| (DGIdb 4.0) |
| Entrez ID | Symbol | Category | Interaction Types | Drug Claim Name | Drug Name | PMIDs |
| Page: 1 |

Copyright 2023-Present -The University of Texas Health Science Center at Houston |