
|
|||||
|
 | |
| |
| |
| |
| |
| |
|
Gene: ARFGAP1 |
Gene summary for ARFGAP1 |
| Gene information | Species | Human | Gene symbol | ARFGAP1 | Gene ID | 55738 |
| Gene name | ADP ribosylation factor GTPase activating protein 1 | |
| Gene Alias | ARF1GAP | |
| Cytomap | 20q13.33 | |
| Gene Type | protein-coding | GO ID | GO:0006810 | UniProtAcc | Q8N6T3 |
Top |
Malignant transformation analysis |
| Identification of the aberrant gene expression in precancerous and cancerous lesions by comparing the gene expression of stem-like cells in diseased tissues with normal stem cells |
| Entrez ID | Symbol | Replicates | Species | Organ | Tissue | Adj P-value | Log2FC | Malignancy |
| 55738 | ARFGAP1 | LZE7T | Human | Esophagus | ESCC | 3.79e-12 | 3.74e-01 | 0.0667 |
| 55738 | ARFGAP1 | LZE8T | Human | Esophagus | ESCC | 1.42e-03 | 1.15e-01 | 0.067 |
| 55738 | ARFGAP1 | LZE22T | Human | Esophagus | ESCC | 6.91e-04 | 2.39e-01 | 0.068 |
| 55738 | ARFGAP1 | LZE24T | Human | Esophagus | ESCC | 2.44e-09 | 1.71e-01 | 0.0596 |
| 55738 | ARFGAP1 | P1T-E | Human | Esophagus | ESCC | 4.42e-06 | 2.18e-01 | 0.0875 |
| 55738 | ARFGAP1 | P2T-E | Human | Esophagus | ESCC | 6.17e-08 | 1.67e-01 | 0.1177 |
| 55738 | ARFGAP1 | P4T-E | Human | Esophagus | ESCC | 3.01e-04 | 1.15e-01 | 0.1323 |
| 55738 | ARFGAP1 | P5T-E | Human | Esophagus | ESCC | 1.38e-10 | 1.15e-01 | 0.1327 |
| 55738 | ARFGAP1 | P8T-E | Human | Esophagus | ESCC | 2.76e-08 | 1.57e-01 | 0.0889 |
| 55738 | ARFGAP1 | P9T-E | Human | Esophagus | ESCC | 1.18e-06 | 1.35e-01 | 0.1131 |
| 55738 | ARFGAP1 | P10T-E | Human | Esophagus | ESCC | 6.06e-13 | 2.99e-01 | 0.116 |
| 55738 | ARFGAP1 | P11T-E | Human | Esophagus | ESCC | 1.82e-08 | 4.00e-01 | 0.1426 |
| 55738 | ARFGAP1 | P12T-E | Human | Esophagus | ESCC | 4.31e-20 | 2.79e-01 | 0.1122 |
| 55738 | ARFGAP1 | P15T-E | Human | Esophagus | ESCC | 1.89e-09 | 1.34e-01 | 0.1149 |
| 55738 | ARFGAP1 | P16T-E | Human | Esophagus | ESCC | 1.92e-20 | 3.40e-01 | 0.1153 |
| 55738 | ARFGAP1 | P17T-E | Human | Esophagus | ESCC | 4.04e-09 | 4.42e-01 | 0.1278 |
| 55738 | ARFGAP1 | P19T-E | Human | Esophagus | ESCC | 5.83e-04 | 3.04e-01 | 0.1662 |
| 55738 | ARFGAP1 | P20T-E | Human | Esophagus | ESCC | 2.51e-15 | 2.44e-01 | 0.1124 |
| 55738 | ARFGAP1 | P21T-E | Human | Esophagus | ESCC | 1.43e-08 | 1.44e-01 | 0.1617 |
| 55738 | ARFGAP1 | P22T-E | Human | Esophagus | ESCC | 3.75e-19 | 1.57e-01 | 0.1236 |
| Page: 1 2 3 4 5 |
| Tissue | Expression Dynamics | Abbreviation |
| Esophagus |  | ESCC: Esophageal squamous cell carcinoma |
| HGIN: High-grade intraepithelial neoplasias | ||
| LGIN: Low-grade intraepithelial neoplasias | ||
| Liver | 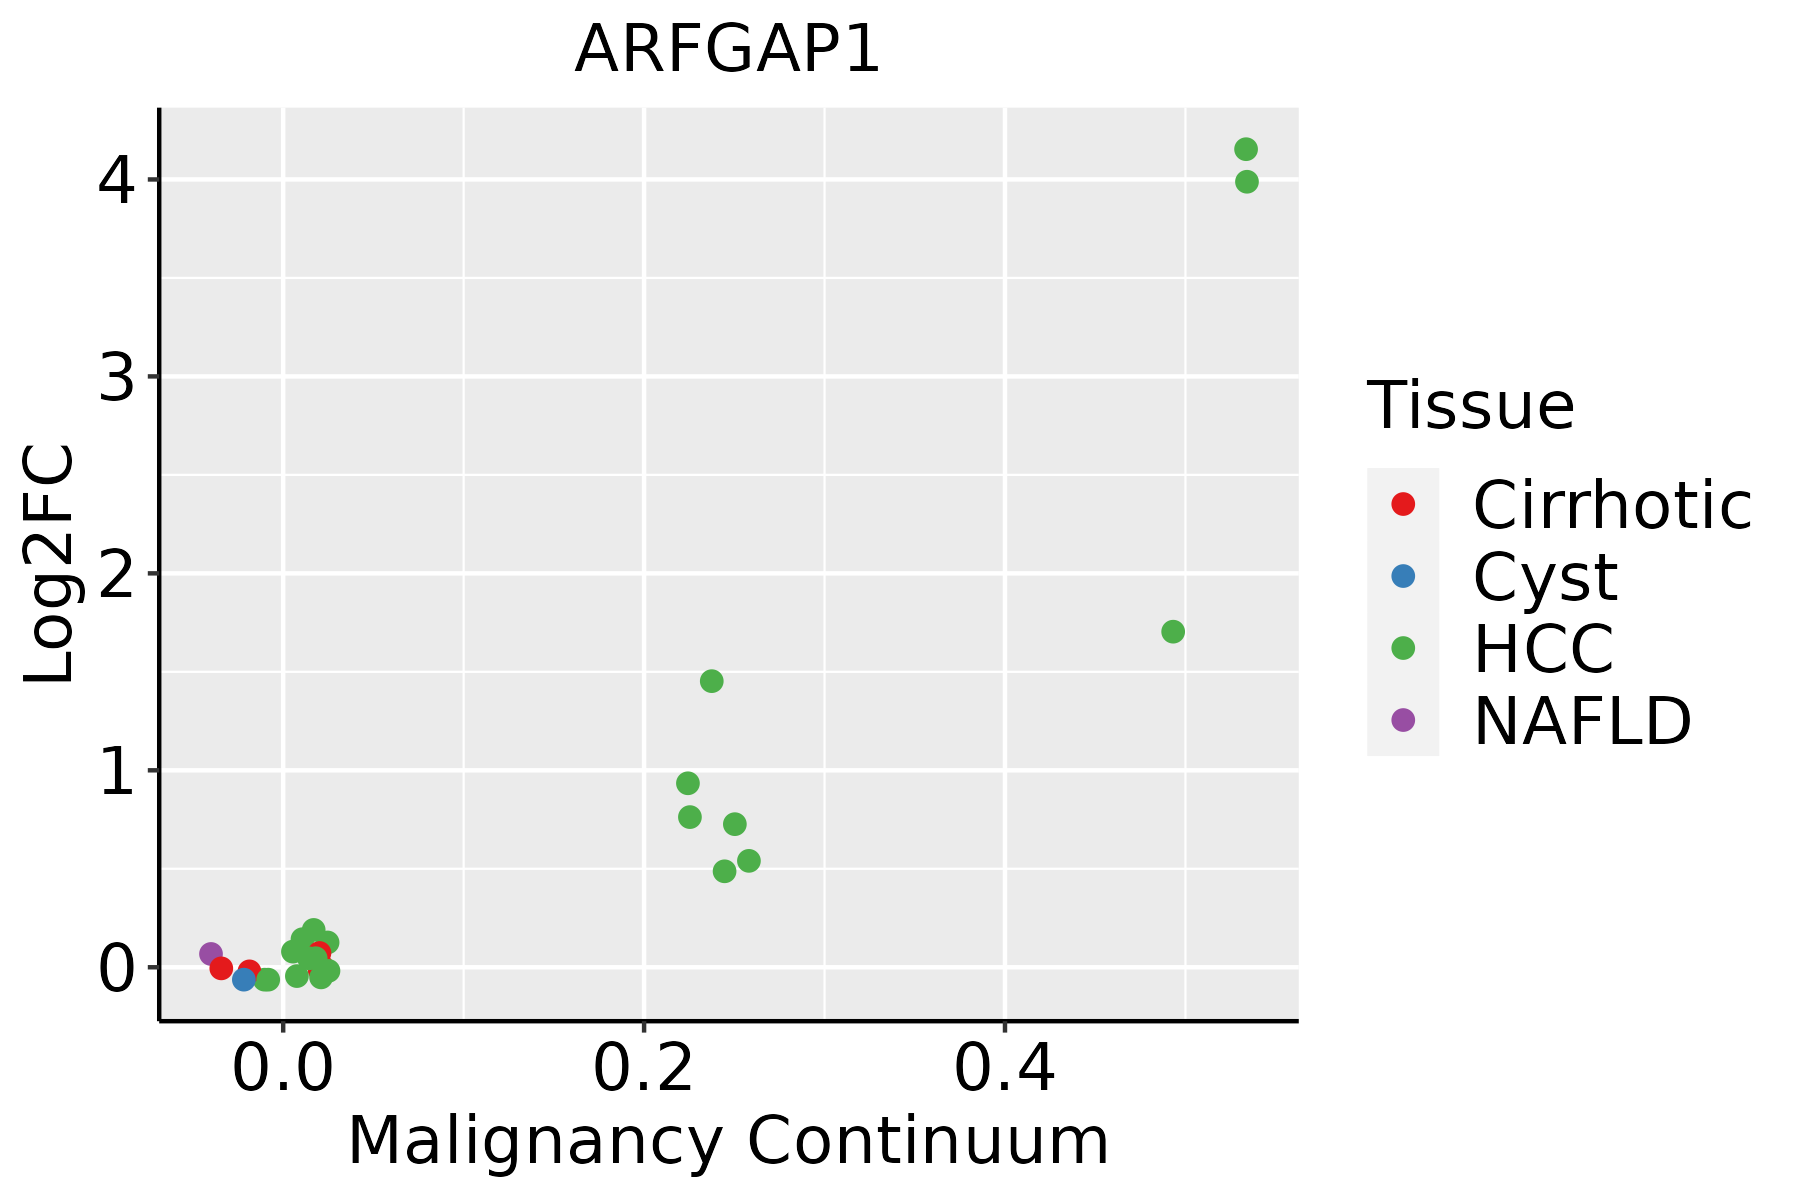 | HCC: Hepatocellular carcinoma |
| NAFLD: Non-alcoholic fatty liver disease | ||
| Oral Cavity | 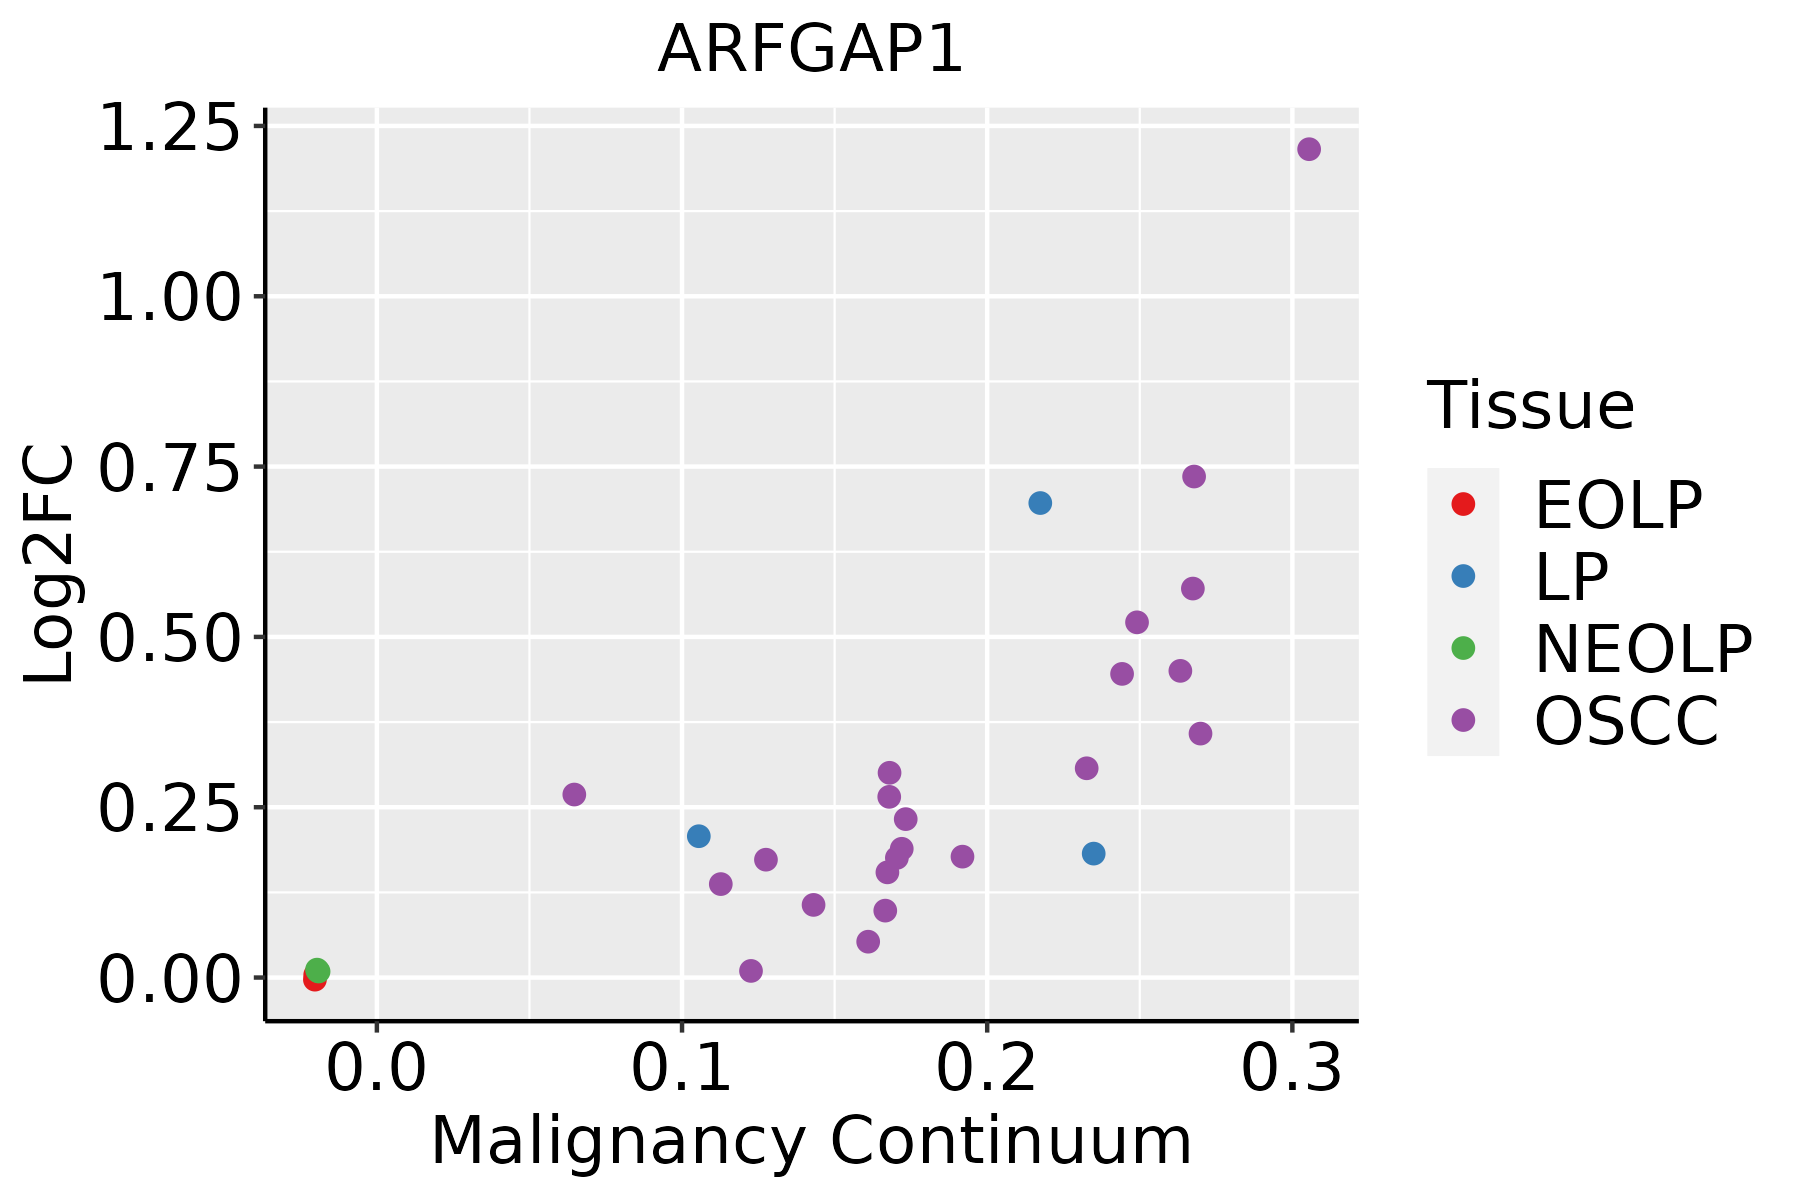 | EOLP: Erosive Oral lichen planus |
| LP: leukoplakia | ||
| NEOLP: Non-erosive oral lichen planus | ||
| OSCC: Oral squamous cell carcinoma | ||
| Thyroid | 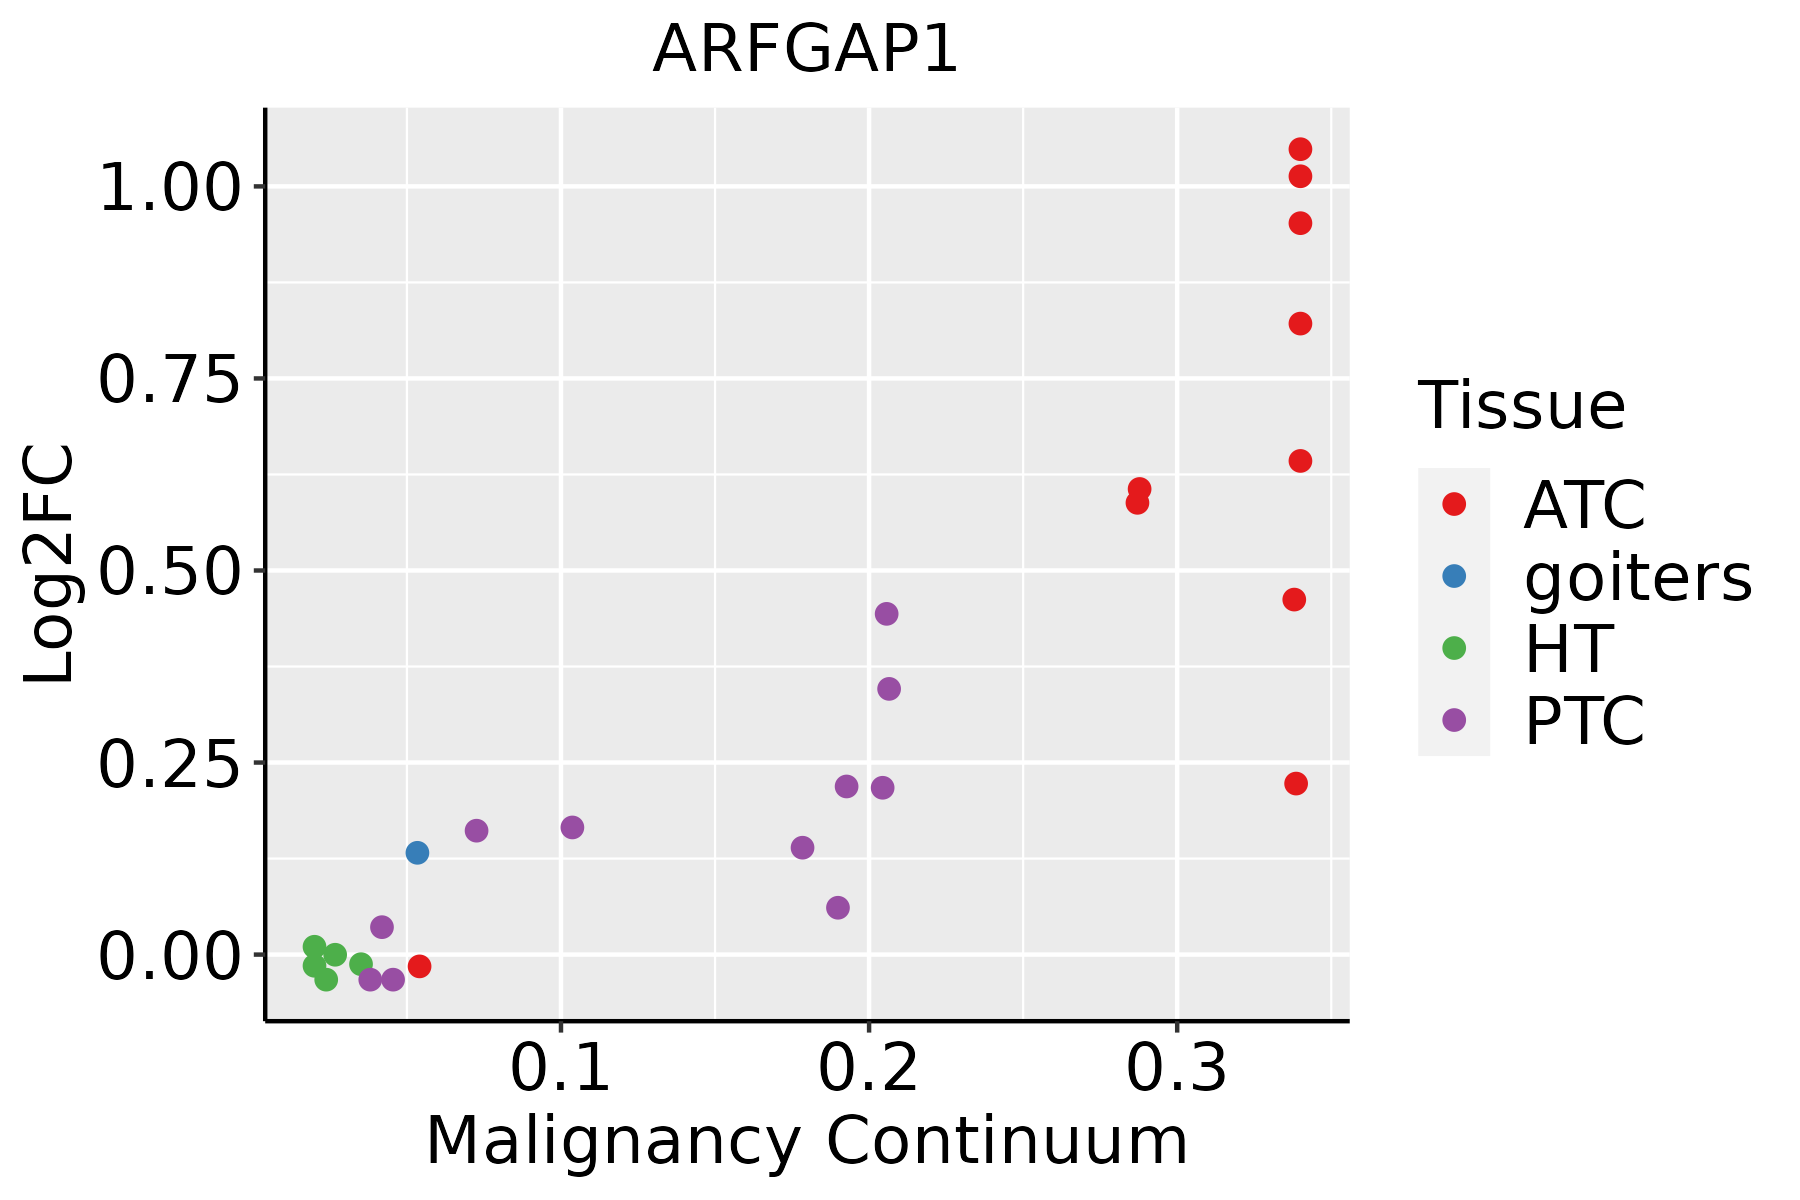 | ATC: Anaplastic thyroid cancer |
| HT: Hashimoto's thyroiditis | ||
| PTC: Papillary thyroid cancer |
| ∗log2FC in expression of this searched gene in stem-like cells from each diseased tissue sample relative to stem-like cells in normal samples in each tissue plotted against the malignancy continuum. Samples are colored based on if they are from different disease stage. |
Top |
Malignant transformation related pathway analysis |
| Find out the enriched GO biological processes and KEGG pathways involved in transition from healthy to precancer to cancer |
| Tissue | Disease Stage | Enriched GO biological Processes |
| Colorectum | AD |  |
| Colorectum | SER |  |
| Colorectum | MSS |  |
| Colorectum | MSI-H |  |
| Colorectum | FAP |  |
| ∗Top 15 enriched GO BP terms are showed in the bar plot of each disease state in each tissue. Each row represents a significant GO biological process which is colored according to the -log10(p.adjust). |
| Page: 1 2 3 4 5 6 7 8 9 |
| GO ID | Tissue | Disease Stage | Description | Gene Ratio | Bg Ratio | pvalue | p.adjust | Count |
| GO:003010018 | Esophagus | ESCC | regulation of endocytosis | 135/8552 | 211/18723 | 5.75e-08 | 1.02e-06 | 135 |
| GO:000726510 | Esophagus | ESCC | Ras protein signal transduction | 201/8552 | 337/18723 | 1.44e-07 | 2.30e-06 | 201 |
| GO:00465789 | Esophagus | ESCC | regulation of Ras protein signal transduction | 106/8552 | 189/18723 | 2.49e-03 | 1.08e-02 | 106 |
| GO:005105610 | Esophagus | ESCC | regulation of small GTPase mediated signal transduction | 157/8552 | 302/18723 | 1.55e-02 | 4.98e-02 | 157 |
| GO:000726521 | Liver | HCC | Ras protein signal transduction | 187/7958 | 337/18723 | 8.89e-07 | 1.35e-05 | 187 |
| GO:003010021 | Liver | HCC | regulation of endocytosis | 117/7958 | 211/18723 | 9.56e-05 | 8.32e-04 | 117 |
| GO:004657811 | Liver | HCC | regulation of Ras protein signal transduction | 100/7958 | 189/18723 | 2.42e-03 | 1.18e-02 | 100 |
| GO:00072659 | Oral cavity | OSCC | Ras protein signal transduction | 185/7305 | 337/18723 | 1.95e-09 | 4.60e-08 | 185 |
| GO:003010016 | Oral cavity | OSCC | regulation of endocytosis | 121/7305 | 211/18723 | 4.74e-08 | 8.80e-07 | 121 |
| GO:00465788 | Oral cavity | OSCC | regulation of Ras protein signal transduction | 90/7305 | 189/18723 | 9.58e-03 | 3.40e-02 | 90 |
| GO:003010017 | Oral cavity | LP | regulation of endocytosis | 81/4623 | 211/18723 | 6.57e-06 | 1.29e-04 | 81 |
| GO:000726515 | Oral cavity | LP | Ras protein signal transduction | 109/4623 | 337/18723 | 8.44e-04 | 7.36e-03 | 109 |
| GO:000726519 | Thyroid | PTC | Ras protein signal transduction | 162/5968 | 337/18723 | 3.16e-10 | 1.02e-08 | 162 |
| GO:003010020 | Thyroid | PTC | regulation of endocytosis | 108/5968 | 211/18723 | 3.92e-09 | 1.04e-07 | 108 |
| GO:005105617 | Thyroid | PTC | regulation of small GTPase mediated signal transduction | 132/5968 | 302/18723 | 9.26e-06 | 1.04e-04 | 132 |
| GO:004657817 | Thyroid | PTC | regulation of Ras protein signal transduction | 88/5968 | 189/18723 | 1.62e-05 | 1.70e-04 | 88 |
| GO:000726524 | Thyroid | ATC | Ras protein signal transduction | 172/6293 | 337/18723 | 2.25e-11 | 7.96e-10 | 172 |
| GO:0030100111 | Thyroid | ATC | regulation of endocytosis | 113/6293 | 211/18723 | 1.71e-09 | 4.22e-08 | 113 |
| GO:005105618 | Thyroid | ATC | regulation of small GTPase mediated signal transduction | 141/6293 | 302/18723 | 1.43e-06 | 1.77e-05 | 141 |
| GO:004657818 | Thyroid | ATC | regulation of Ras protein signal transduction | 94/6293 | 189/18723 | 3.12e-06 | 3.55e-05 | 94 |
| Page: 1 |
| Pathway ID | Tissue | Disease Stage | Description | Gene Ratio | Bg Ratio | pvalue | p.adjust | qvalue | Count |
| hsa04144210 | Esophagus | ESCC | Endocytosis | 186/4205 | 251/8465 | 9.74e-16 | 4.66e-14 | 2.39e-14 | 186 |
| hsa0414437 | Esophagus | ESCC | Endocytosis | 186/4205 | 251/8465 | 9.74e-16 | 4.66e-14 | 2.39e-14 | 186 |
| hsa0414422 | Liver | HCC | Endocytosis | 178/4020 | 251/8465 | 2.03e-14 | 5.22e-13 | 2.91e-13 | 178 |
| hsa0414432 | Liver | HCC | Endocytosis | 178/4020 | 251/8465 | 2.03e-14 | 5.22e-13 | 2.91e-13 | 178 |
| hsa0414427 | Oral cavity | OSCC | Endocytosis | 174/3704 | 251/8465 | 9.42e-17 | 4.51e-15 | 2.29e-15 | 174 |
| hsa04144112 | Oral cavity | OSCC | Endocytosis | 174/3704 | 251/8465 | 9.42e-17 | 4.51e-15 | 2.29e-15 | 174 |
| hsa0414428 | Oral cavity | LP | Endocytosis | 121/2418 | 251/8465 | 1.89e-11 | 3.70e-10 | 2.38e-10 | 121 |
| hsa0414436 | Oral cavity | LP | Endocytosis | 121/2418 | 251/8465 | 1.89e-11 | 3.70e-10 | 2.38e-10 | 121 |
| Page: 1 |
Top |
Cell-cell communication analysis |
| Identification of potential cell-cell interactions between two cell types and their ligand-receptor pairs for different disease states |
| Ligand | Receptor | LRpair | Pathway | Tissue | Disease Stage |
| Page: 1 |
Top |
Single-cell gene regulatory network inference analysis |
| Find out the significant the regulons (TFs) and the target genes of each regulon across cell types for different disease states |
| TF | Cell Type | Tissue | Disease Stage | Target Gene | RSS | Regulon Activity |
| ∗The dot plots of a searched regulon are shown for all cell subpopulations in each disease state of each tissue based on the regulon specific score inferred using pySCENIC and by calculating the average expression. |
| Page: 1 |
Top |
Somatic mutation of malignant transformation related genes |
| Annotation of somatic variants for genes involved in malignant transformation |
| Hugo Symbol | Variant Class | Variant Classification | dbSNP RS | HGVSc | HGVSp | HGVSp Short | SWISSPROT | BIOTYPE | SIFT | PolyPhen | Tumor Sample Barcode | Tissue | Histology | Sex | Age | Stage | Therapy Types | Drugs | Outcome |
| ARFGAP1 | SNV | Missense_Mutation | c.326N>A | p.Ala109Asp | p.A109D | Q8N6T3 | protein_coding | deleterious(0) | possibly_damaging(0.685) | TCGA-A7-A13D-01 | Breast | breast invasive carcinoma | Female | <65 | I/II | Chemotherapy | cytoxan | SD | |
| ARFGAP1 | SNV | Missense_Mutation | novel | c.421N>G | p.Thr141Ala | p.T141A | Q8N6T3 | protein_coding | tolerated(0.15) | benign(0.009) | TCGA-2W-A8YY-01 | Cervix | cervical & endocervical cancer | Female | <65 | I/II | Chemotherapy | cisplatin | CR |
| ARFGAP1 | SNV | Missense_Mutation | c.1012G>A | p.Glu338Lys | p.E338K | Q8N6T3 | protein_coding | deleterious(0.01) | probably_damaging(0.991) | TCGA-C5-A1MK-01 | Cervix | cervical & endocervical cancer | Female | >=65 | III/IV | Chemotherapy | carboplatin | PD | |
| ARFGAP1 | SNV | Missense_Mutation | rs753214798 | c.358G>A | p.Glu120Lys | p.E120K | Q8N6T3 | protein_coding | deleterious(0.03) | benign(0.218) | TCGA-MA-AA3Z-01 | Cervix | cervical & endocervical cancer | Female | <65 | I/II | Unknown | Unknown | SD |
| ARFGAP1 | SNV | Missense_Mutation | novel | c.217G>C | p.Glu73Gln | p.E73Q | Q8N6T3 | protein_coding | deleterious(0) | possibly_damaging(0.521) | TCGA-VS-AA62-01 | Cervix | cervical & endocervical cancer | Female | <65 | I/II | Chemotherapy | cisplatin | PD |
| ARFGAP1 | SNV | Missense_Mutation | c.75N>G | p.Cys25Trp | p.C25W | Q8N6T3 | protein_coding | deleterious(0) | probably_damaging(1) | TCGA-A6-6141-01 | Colorectum | colon adenocarcinoma | Male | <65 | I/II | Chemotherapy | 5-fu | SD | |
| ARFGAP1 | SNV | Missense_Mutation | c.76N>T | p.Gly26Cys | p.G26C | Q8N6T3 | protein_coding | deleterious(0) | probably_damaging(0.996) | TCGA-AA-3975-01 | Colorectum | colon adenocarcinoma | Male | >=65 | I/II | Unknown | Unknown | SD | |
| ARFGAP1 | SNV | Missense_Mutation | rs147317838 | c.781G>A | p.Val261Ile | p.V261I | Q8N6T3 | protein_coding | tolerated(0.06) | benign(0.033) | TCGA-AA-A00N-01 | Colorectum | colon adenocarcinoma | Male | >=65 | I/II | Unknown | Unknown | PD |
| ARFGAP1 | SNV | Missense_Mutation | rs763879486 | c.544N>T | p.Arg182Cys | p.R182C | Q8N6T3 | protein_coding | deleterious(0) | probably_damaging(0.996) | TCGA-CK-4951-01 | Colorectum | colon adenocarcinoma | Female | >=65 | I/II | Unknown | Unknown | PD |
| ARFGAP1 | SNV | Missense_Mutation | novel | c.1034N>T | p.Pro345Leu | p.P345L | Q8N6T3 | protein_coding | deleterious(0.02) | benign(0.001) | TCGA-DC-6683-01 | Colorectum | rectum adenocarcinoma | Male | <65 | III/IV | Chemotherapy | 5-fluorouracil | SD |
| Page: 1 2 3 4 5 |
Top |
Related drugs of malignant transformation related genes |
| Identification of chemicals and drugs interact with genes involved in malignant transfromation |
| (DGIdb 4.0) |
| Entrez ID | Symbol | Category | Interaction Types | Drug Claim Name | Drug Name | PMIDs |
| Page: 1 |

Copyright 2023-Present -The University of Texas Health Science Center at Houston |