
|
|||||
|
 | |
| |
| |
| |
| |
| |
|
Gene: ARF5 |
Gene summary for ARF5 |
| Gene information | Species | Human | Gene symbol | ARF5 | Gene ID | 381 |
| Gene name | ADP ribosylation factor 5 | |
| Gene Alias | ARF5 | |
| Cytomap | 7q32.1 | |
| Gene Type | protein-coding | GO ID | GO:0006810 | UniProtAcc | A4D0Z3 |
Top |
Malignant transformation analysis |
| Identification of the aberrant gene expression in precancerous and cancerous lesions by comparing the gene expression of stem-like cells in diseased tissues with normal stem cells |
| Entrez ID | Symbol | Replicates | Species | Organ | Tissue | Adj P-value | Log2FC | Malignancy |
| 381 | ARF5 | AEH-subject1 | Human | Endometrium | AEH | 4.25e-10 | -3.10e-01 | -0.3059 |
| 381 | ARF5 | AEH-subject2 | Human | Endometrium | AEH | 8.22e-09 | -2.20e-01 | -0.2525 |
| 381 | ARF5 | AEH-subject3 | Human | Endometrium | AEH | 6.76e-11 | -2.53e-01 | -0.2576 |
| 381 | ARF5 | AEH-subject4 | Human | Endometrium | AEH | 5.12e-12 | -3.61e-01 | -0.2657 |
| 381 | ARF5 | AEH-subject5 | Human | Endometrium | AEH | 6.28e-15 | -3.77e-01 | -0.2953 |
| 381 | ARF5 | EEC-subject1 | Human | Endometrium | EEC | 4.06e-10 | -3.00e-01 | -0.2682 |
| 381 | ARF5 | EEC-subject2 | Human | Endometrium | EEC | 1.91e-13 | -3.75e-01 | -0.2607 |
| 381 | ARF5 | EEC-subject3 | Human | Endometrium | EEC | 1.07e-31 | -4.24e-01 | -0.2525 |
| 381 | ARF5 | EEC-subject4 | Human | Endometrium | EEC | 4.72e-10 | -2.70e-01 | -0.2571 |
| 381 | ARF5 | EEC-subject5 | Human | Endometrium | EEC | 6.56e-04 | -2.15e-01 | -0.249 |
| 381 | ARF5 | GSM5276934 | Human | Endometrium | EEC | 4.03e-05 | -2.85e-01 | -0.0913 |
| 381 | ARF5 | GSM5276937 | Human | Endometrium | EEC | 2.16e-05 | -3.09e-01 | -0.0897 |
| 381 | ARF5 | GSM6177620_NYU_UCEC1_lib1_lib1 | Human | Endometrium | EEC | 1.17e-23 | -4.87e-01 | -0.1869 |
| 381 | ARF5 | GSM6177620_NYU_UCEC1_lib2_lib2 | Human | Endometrium | EEC | 4.58e-28 | -4.85e-01 | -0.1875 |
| 381 | ARF5 | GSM6177620_NYU_UCEC1_lib3_lib3 | Human | Endometrium | EEC | 3.79e-30 | -5.13e-01 | -0.1883 |
| 381 | ARF5 | GSM6177621_NYU_UCEC2_lib1_lib1 | Human | Endometrium | EEC | 7.92e-46 | -5.29e-01 | -0.1934 |
| 381 | ARF5 | GSM6177622_NYU_UCEC3_lib1_lib1 | Human | Endometrium | EEC | 3.42e-41 | -4.95e-01 | -0.1917 |
| 381 | ARF5 | GSM6177622_NYU_UCEC3_lib2_lib2 | Human | Endometrium | EEC | 4.76e-41 | -4.84e-01 | -0.1916 |
| 381 | ARF5 | GSM6177623_NYU_UCEC3_Vis | Human | Endometrium | EEC | 4.24e-04 | -2.15e-02 | -0.1269 |
| 381 | ARF5 | LZE2D | Human | Esophagus | HGIN | 7.64e-03 | 6.80e-01 | 0.0642 |
| Page: 1 2 3 4 5 6 7 8 9 |
| Tissue | Expression Dynamics | Abbreviation |
| Endometrium | 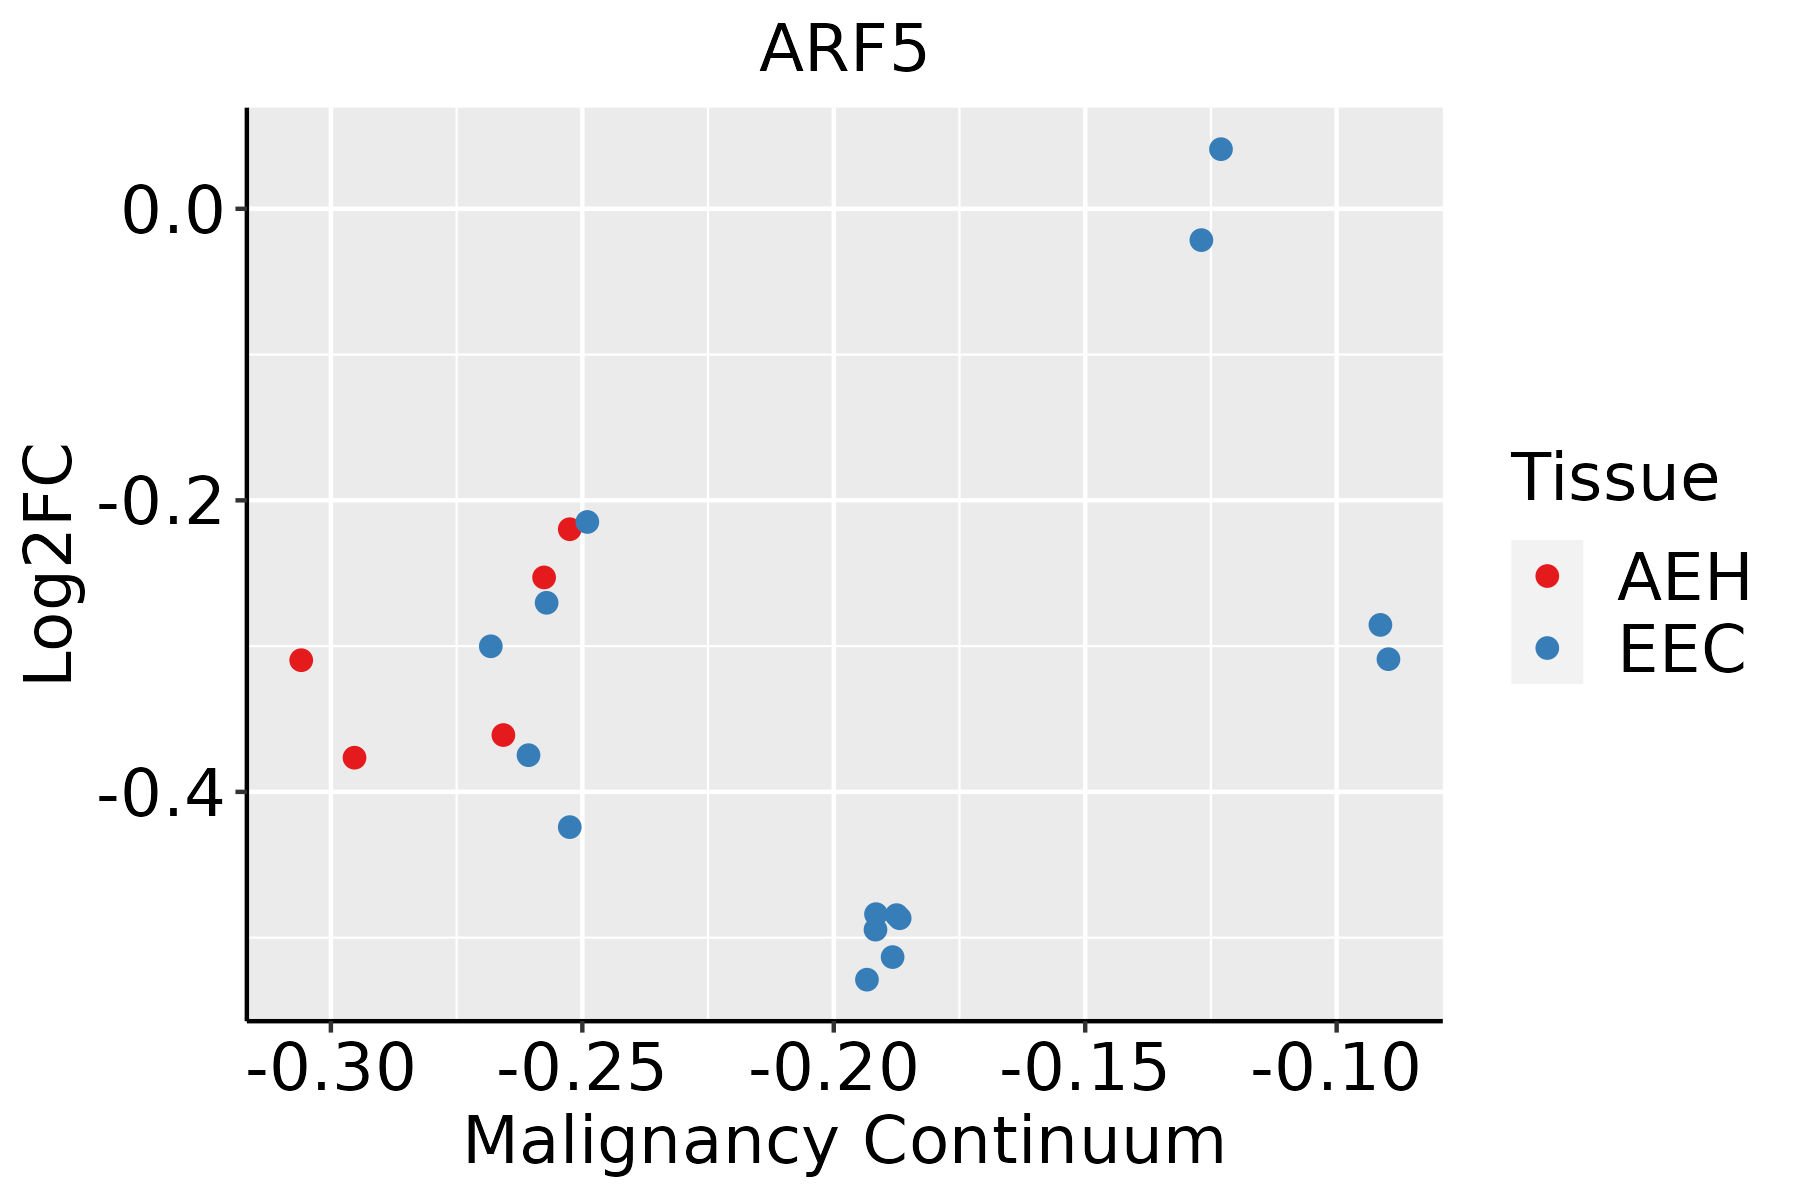 | AEH: Atypical endometrial hyperplasia |
| EEC: Endometrioid Cancer | ||
| Esophagus | 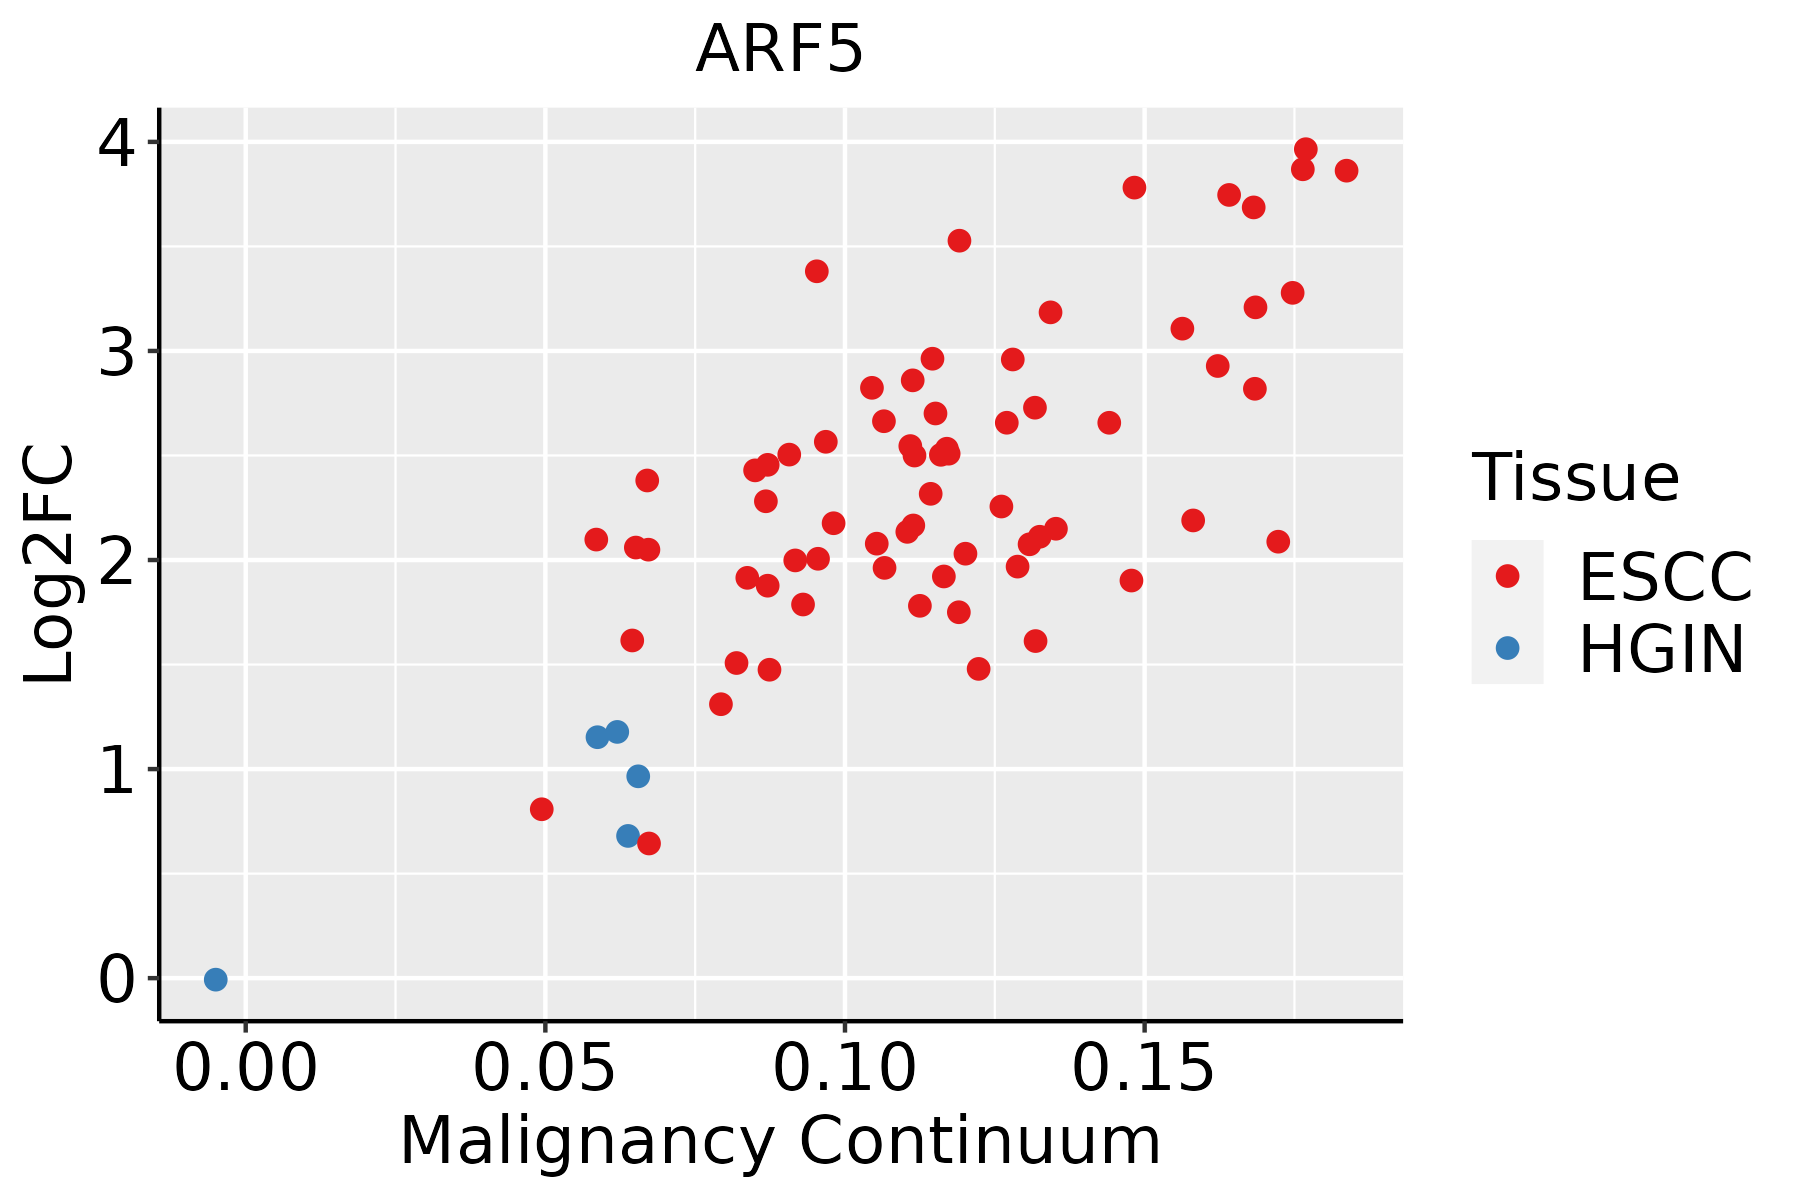 | ESCC: Esophageal squamous cell carcinoma |
| HGIN: High-grade intraepithelial neoplasias | ||
| LGIN: Low-grade intraepithelial neoplasias | ||
| Liver |  | HCC: Hepatocellular carcinoma |
| NAFLD: Non-alcoholic fatty liver disease | ||
| Oral Cavity | 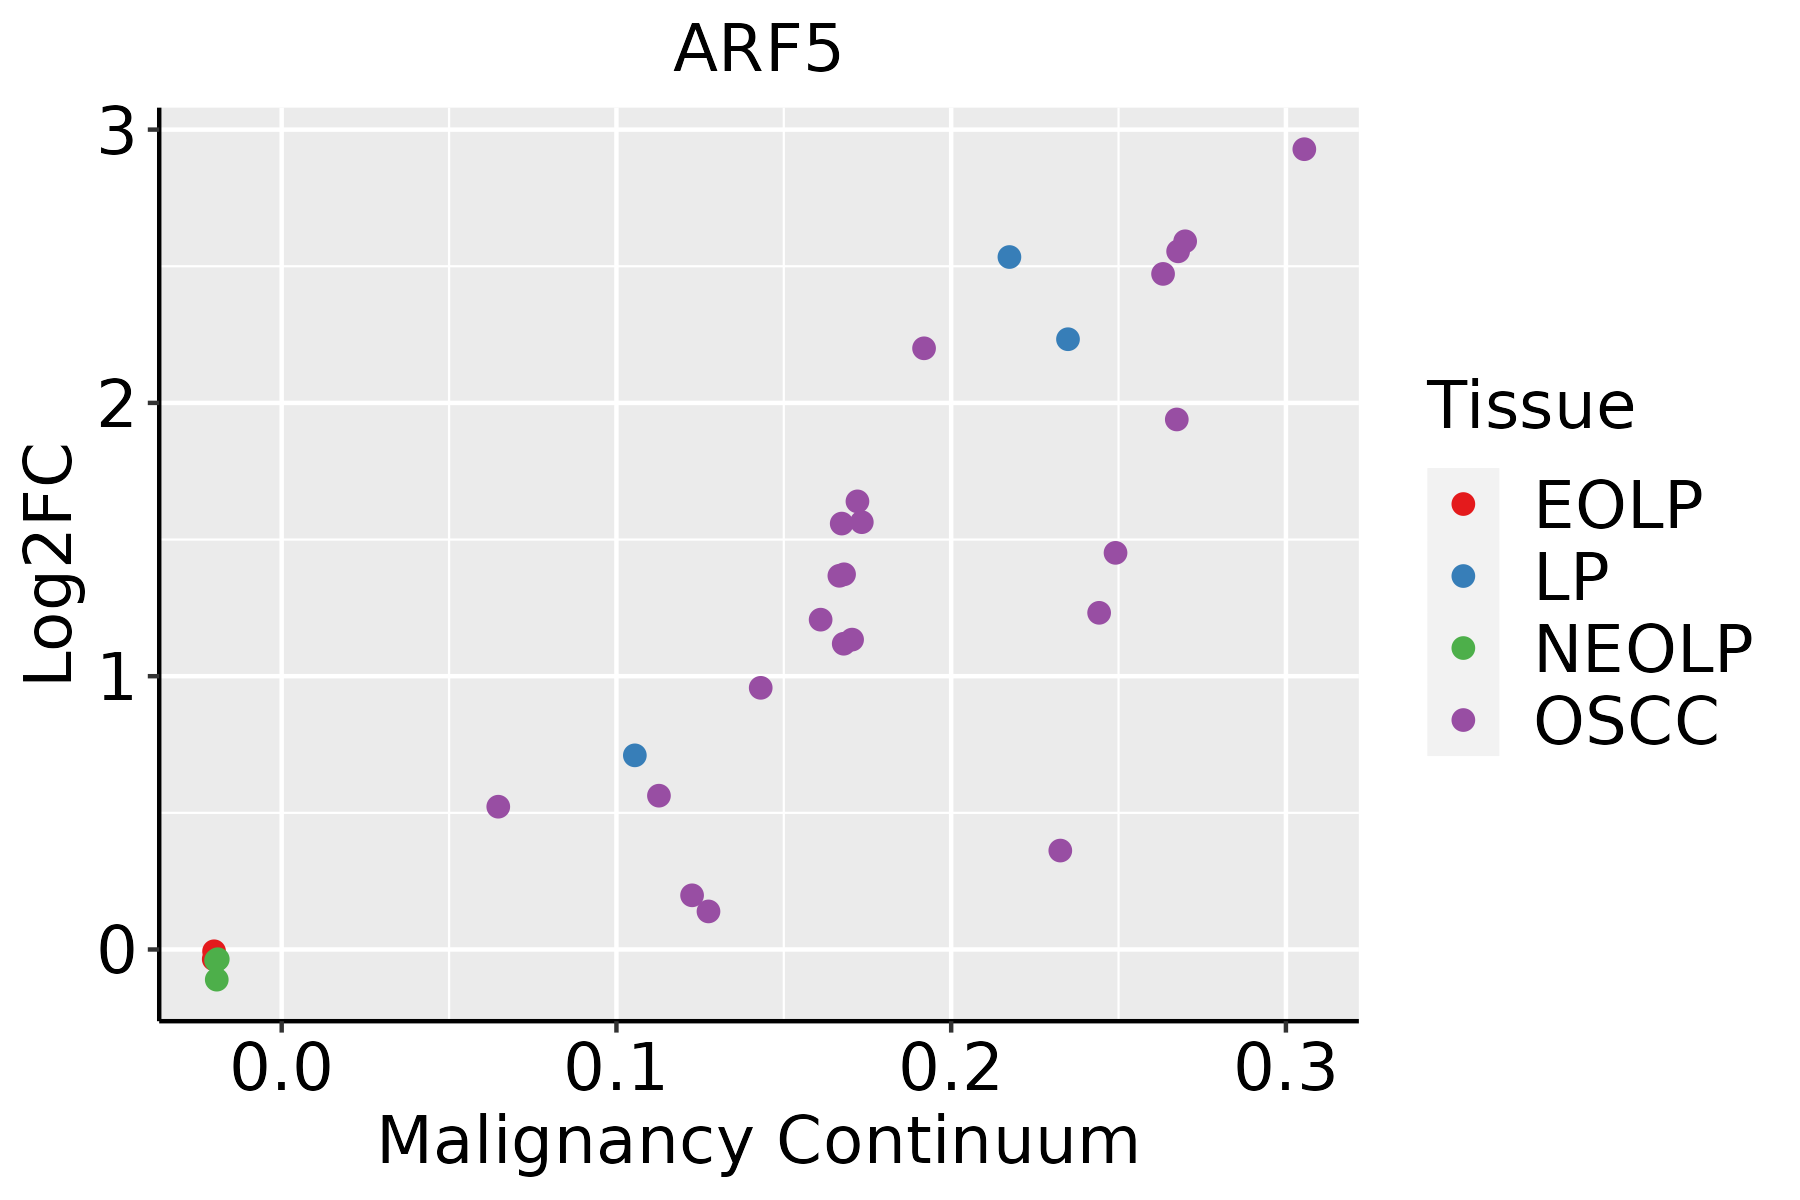 | EOLP: Erosive Oral lichen planus |
| LP: leukoplakia | ||
| NEOLP: Non-erosive oral lichen planus | ||
| OSCC: Oral squamous cell carcinoma | ||
| Prostate |  | BPH: Benign Prostatic Hyperplasia |
| Skin |  | AK: Actinic keratosis |
| cSCC: Cutaneous squamous cell carcinoma | ||
| SCCIS:squamous cell carcinoma in situ | ||
| Thyroid |  | ATC: Anaplastic thyroid cancer |
| HT: Hashimoto's thyroiditis | ||
| PTC: Papillary thyroid cancer |
| ∗log2FC in expression of this searched gene in stem-like cells from each diseased tissue sample relative to stem-like cells in normal samples in each tissue plotted against the malignancy continuum. Samples are colored based on if they are from different disease stage. |
Top |
Malignant transformation related pathway analysis |
| Find out the enriched GO biological processes and KEGG pathways involved in transition from healthy to precancer to cancer |
| Tissue | Disease Stage | Enriched GO biological Processes |
| Colorectum | AD |  |
| Colorectum | SER |  |
| Colorectum | MSS |  |
| Colorectum | MSI-H |  |
| Colorectum | FAP |  |
| ∗Top 15 enriched GO BP terms are showed in the bar plot of each disease state in each tissue. Each row represents a significant GO biological process which is colored according to the -log10(p.adjust). |
| Page: 1 2 3 4 5 6 7 8 9 |
| GO ID | Tissue | Disease Stage | Description | Gene Ratio | Bg Ratio | pvalue | p.adjust | Count |
| GO:00481939 | Endometrium | AEH | Golgi vesicle transport | 60/2100 | 296/18723 | 3.65e-06 | 9.79e-05 | 60 |
| GO:00068908 | Endometrium | AEH | retrograde vesicle-mediated transport, Golgi to endoplasmic reticulum | 15/2100 | 52/18723 | 4.20e-04 | 4.46e-03 | 15 |
| GO:004819313 | Endometrium | EEC | Golgi vesicle transport | 60/2168 | 296/18723 | 9.91e-06 | 2.17e-04 | 60 |
| GO:000689013 | Endometrium | EEC | retrograde vesicle-mediated transport, Golgi to endoplasmic reticulum | 15/2168 | 52/18723 | 5.90e-04 | 5.87e-03 | 15 |
| GO:004819317 | Esophagus | HGIN | Golgi vesicle transport | 83/2587 | 296/18723 | 8.59e-11 | 8.89e-09 | 83 |
| GO:000689016 | Esophagus | HGIN | retrograde vesicle-mediated transport, Golgi to endoplasmic reticulum | 19/2587 | 52/18723 | 3.44e-05 | 8.67e-04 | 19 |
| GO:004819318 | Esophagus | ESCC | Golgi vesicle transport | 231/8552 | 296/18723 | 1.82e-30 | 9.63e-28 | 231 |
| GO:000689017 | Esophagus | ESCC | retrograde vesicle-mediated transport, Golgi to endoplasmic reticulum | 46/8552 | 52/18723 | 1.23e-10 | 3.66e-09 | 46 |
| GO:004819311 | Liver | Cirrhotic | Golgi vesicle transport | 153/4634 | 296/18723 | 1.02e-23 | 6.43e-21 | 153 |
| GO:00068905 | Liver | Cirrhotic | retrograde vesicle-mediated transport, Golgi to endoplasmic reticulum | 29/4634 | 52/18723 | 1.69e-06 | 3.22e-05 | 29 |
| GO:004819321 | Liver | HCC | Golgi vesicle transport | 217/7958 | 296/18723 | 2.58e-27 | 1.02e-24 | 217 |
| GO:000689011 | Liver | HCC | retrograde vesicle-mediated transport, Golgi to endoplasmic reticulum | 36/7958 | 52/18723 | 8.79e-05 | 7.66e-04 | 36 |
| GO:004819315 | Oral cavity | OSCC | Golgi vesicle transport | 209/7305 | 296/18723 | 1.39e-28 | 6.30e-26 | 209 |
| GO:000689010 | Oral cavity | OSCC | retrograde vesicle-mediated transport, Golgi to endoplasmic reticulum | 40/7305 | 52/18723 | 2.86e-08 | 5.50e-07 | 40 |
| GO:004819316 | Oral cavity | LP | Golgi vesicle transport | 141/4623 | 296/18723 | 6.11e-18 | 1.06e-15 | 141 |
| GO:000689015 | Oral cavity | LP | retrograde vesicle-mediated transport, Golgi to endoplasmic reticulum | 29/4623 | 52/18723 | 1.60e-06 | 3.79e-05 | 29 |
| GO:004819310 | Prostate | BPH | Golgi vesicle transport | 102/3107 | 296/18723 | 3.90e-14 | 4.56e-12 | 102 |
| GO:00068909 | Prostate | BPH | retrograde vesicle-mediated transport, Golgi to endoplasmic reticulum | 21/3107 | 52/18723 | 3.85e-05 | 4.18e-04 | 21 |
| GO:004819314 | Prostate | Tumor | Golgi vesicle transport | 105/3246 | 296/18723 | 3.55e-14 | 4.33e-12 | 105 |
| GO:000689014 | Prostate | Tumor | retrograde vesicle-mediated transport, Golgi to endoplasmic reticulum | 21/3246 | 52/18723 | 7.49e-05 | 7.85e-04 | 21 |
| Page: 1 2 |
| Pathway ID | Tissue | Disease Stage | Description | Gene Ratio | Bg Ratio | pvalue | p.adjust | qvalue | Count |
| hsa0414420 | Endometrium | AEH | Endocytosis | 56/1197 | 251/8465 | 2.58e-04 | 2.15e-03 | 1.57e-03 | 56 |
| hsa04144110 | Endometrium | AEH | Endocytosis | 56/1197 | 251/8465 | 2.58e-04 | 2.15e-03 | 1.57e-03 | 56 |
| hsa0414424 | Endometrium | EEC | Endocytosis | 57/1237 | 251/8465 | 3.34e-04 | 2.82e-03 | 2.10e-03 | 57 |
| hsa0414434 | Endometrium | EEC | Endocytosis | 57/1237 | 251/8465 | 3.34e-04 | 2.82e-03 | 2.10e-03 | 57 |
| hsa0414429 | Esophagus | HGIN | Endocytosis | 76/1383 | 251/8465 | 1.74e-08 | 3.34e-07 | 2.65e-07 | 76 |
| hsa04144113 | Esophagus | HGIN | Endocytosis | 76/1383 | 251/8465 | 1.74e-08 | 3.34e-07 | 2.65e-07 | 76 |
| hsa04144210 | Esophagus | ESCC | Endocytosis | 186/4205 | 251/8465 | 9.74e-16 | 4.66e-14 | 2.39e-14 | 186 |
| hsa0414437 | Esophagus | ESCC | Endocytosis | 186/4205 | 251/8465 | 9.74e-16 | 4.66e-14 | 2.39e-14 | 186 |
| hsa0414412 | Liver | Cirrhotic | Endocytosis | 119/2530 | 251/8465 | 2.33e-09 | 4.56e-08 | 2.81e-08 | 119 |
| hsa0414413 | Liver | Cirrhotic | Endocytosis | 119/2530 | 251/8465 | 2.33e-09 | 4.56e-08 | 2.81e-08 | 119 |
| hsa0414422 | Liver | HCC | Endocytosis | 178/4020 | 251/8465 | 2.03e-14 | 5.22e-13 | 2.91e-13 | 178 |
| hsa0414432 | Liver | HCC | Endocytosis | 178/4020 | 251/8465 | 2.03e-14 | 5.22e-13 | 2.91e-13 | 178 |
| hsa0414427 | Oral cavity | OSCC | Endocytosis | 174/3704 | 251/8465 | 9.42e-17 | 4.51e-15 | 2.29e-15 | 174 |
| hsa04144112 | Oral cavity | OSCC | Endocytosis | 174/3704 | 251/8465 | 9.42e-17 | 4.51e-15 | 2.29e-15 | 174 |
| hsa0414428 | Oral cavity | LP | Endocytosis | 121/2418 | 251/8465 | 1.89e-11 | 3.70e-10 | 2.38e-10 | 121 |
| hsa0414436 | Oral cavity | LP | Endocytosis | 121/2418 | 251/8465 | 1.89e-11 | 3.70e-10 | 2.38e-10 | 121 |
| hsa0414425 | Prostate | BPH | Endocytosis | 89/1718 | 251/8465 | 1.06e-08 | 1.29e-07 | 7.99e-08 | 89 |
| hsa04144111 | Prostate | BPH | Endocytosis | 89/1718 | 251/8465 | 1.06e-08 | 1.29e-07 | 7.99e-08 | 89 |
| hsa0414426 | Prostate | Tumor | Endocytosis | 92/1791 | 251/8465 | 7.83e-09 | 1.04e-07 | 6.43e-08 | 92 |
| hsa0414435 | Prostate | Tumor | Endocytosis | 92/1791 | 251/8465 | 7.83e-09 | 1.04e-07 | 6.43e-08 | 92 |
| Page: 1 |
Top |
Cell-cell communication analysis |
| Identification of potential cell-cell interactions between two cell types and their ligand-receptor pairs for different disease states |
| Ligand | Receptor | LRpair | Pathway | Tissue | Disease Stage |
| Page: 1 |
Top |
Single-cell gene regulatory network inference analysis |
| Find out the significant the regulons (TFs) and the target genes of each regulon across cell types for different disease states |
| TF | Cell Type | Tissue | Disease Stage | Target Gene | RSS | Regulon Activity |
| ∗The dot plots of a searched regulon are shown for all cell subpopulations in each disease state of each tissue based on the regulon specific score inferred using pySCENIC and by calculating the average expression. |
| Page: 1 |
Top |
Somatic mutation of malignant transformation related genes |
| Annotation of somatic variants for genes involved in malignant transformation |
| Hugo Symbol | Variant Class | Variant Classification | dbSNP RS | HGVSc | HGVSp | HGVSp Short | SWISSPROT | BIOTYPE | SIFT | PolyPhen | Tumor Sample Barcode | Tissue | Histology | Sex | Age | Stage | Therapy Types | Drugs | Outcome |
| ARF5 | SNV | Missense_Mutation | c.502N>A | p.Asp168Asn | p.D168N | P84085 | protein_coding | deleterious_low_confidence(0) | benign(0.081) | TCGA-E9-A1R4-01 | Breast | breast invasive carcinoma | Female | >=65 | I/II | Chemotherapy | 5-fluorouracil | SD | |
| ARF5 | SNV | Missense_Mutation | c.295C>T | p.Arg99Trp | p.R99W | P84085 | protein_coding | deleterious_low_confidence(0.01) | probably_damaging(0.999) | TCGA-G4-6309-01 | Colorectum | colon adenocarcinoma | Female | <65 | III/IV | Chemotherapy | xeloda | PD | |
| ARF5 | SNV | Missense_Mutation | rs760826467 | c.539N>A | p.Arg180His | p.R180H | P84085 | protein_coding | deleterious_low_confidence(0.04) | benign(0.189) | TCGA-G4-6626-01 | Colorectum | colon adenocarcinoma | Male | >=65 | I/II | Unknown | Unknown | SD |
| ARF5 | SNV | Missense_Mutation | rs749643254 | c.455C>T | p.Thr152Met | p.T152M | P84085 | protein_coding | tolerated_low_confidence(0.05) | benign(0.436) | TCGA-A5-A0G1-01 | Endometrium | uterine corpus endometrioid carcinoma | Female | >=65 | I/II | Unknown | Unknown | SD |
| ARF5 | SNV | Missense_Mutation | rs774035808 | c.526N>A | p.Glu176Lys | p.E176K | P84085 | protein_coding | tolerated_low_confidence(0.2) | benign(0.399) | TCGA-AJ-A8CT-01 | Endometrium | uterine corpus endometrioid carcinoma | Female | <65 | I/II | Unknown | Unknown | SD |
| ARF5 | SNV | Missense_Mutation | c.349N>T | p.Arg117Trp | p.R117W | P84085 | protein_coding | deleterious_low_confidence(0.01) | probably_damaging(0.944) | TCGA-AP-A059-01 | Endometrium | uterine corpus endometrioid carcinoma | Female | >=65 | I/II | Unknown | Unknown | SD | |
| ARF5 | SNV | Missense_Mutation | c.463G>A | p.Val155Ile | p.V155I | P84085 | protein_coding | tolerated_low_confidence(1) | benign(0.006) | TCGA-B5-A11E-01 | Endometrium | uterine corpus endometrioid carcinoma | Female | <65 | I/II | Unknown | Unknown | SD | |
| ARF5 | SNV | Missense_Mutation | c.295N>T | p.Arg99Trp | p.R99W | P84085 | protein_coding | deleterious_low_confidence(0.01) | probably_damaging(0.999) | TCGA-B5-A1MR-01 | Endometrium | uterine corpus endometrioid carcinoma | Female | >=65 | III/IV | Unknown | Unknown | SD | |
| ARF5 | SNV | Missense_Mutation | rs773554378 | c.538N>T | p.Arg180Cys | p.R180C | P84085 | protein_coding | deleterious_low_confidence(0) | possibly_damaging(0.589) | TCGA-BS-A0UV-01 | Endometrium | uterine corpus endometrioid carcinoma | Female | <65 | III/IV | Unknown | Unknown | SD |
| ARF5 | SNV | Missense_Mutation | novel | c.308N>T | p.Ser103Phe | p.S103F | P84085 | protein_coding | deleterious_low_confidence(0) | probably_damaging(0.935) | TCGA-EO-A22U-01 | Endometrium | uterine corpus endometrioid carcinoma | Female | >=65 | I/II | Unknown | Unknown | SD |
| Page: 1 2 |
Top |
Related drugs of malignant transformation related genes |
| Identification of chemicals and drugs interact with genes involved in malignant transfromation |
| (DGIdb 4.0) |
| Entrez ID | Symbol | Category | Interaction Types | Drug Claim Name | Drug Name | PMIDs |
| Page: 1 |

Copyright 2023-Present -The University of Texas Health Science Center at Houston |