
|
|||||
|
 | |
| |
| |
| |
| |
| |
|
Gene: ARF4 |
Gene summary for ARF4 |
| Gene information | Species | Human | Gene symbol | ARF4 | Gene ID | 378 |
| Gene name | ADP ribosylation factor 4 | |
| Gene Alias | ARF2 | |
| Cytomap | 3p14.3 | |
| Gene Type | protein-coding | GO ID | GO:0003008 | UniProtAcc | P18085 |
Top |
Malignant transformation analysis |
| Identification of the aberrant gene expression in precancerous and cancerous lesions by comparing the gene expression of stem-like cells in diseased tissues with normal stem cells |
| Entrez ID | Symbol | Replicates | Species | Organ | Tissue | Adj P-value | Log2FC | Malignancy |
| 378 | ARF4 | GSM4909277 | Human | Breast | Precancer | 1.34e-03 | 3.66e-01 | 0.0177 |
| 378 | ARF4 | GSM4909281 | Human | Breast | IDC | 2.76e-12 | 4.51e-01 | 0.21 |
| 378 | ARF4 | GSM4909286 | Human | Breast | IDC | 6.24e-16 | -5.13e-01 | 0.1081 |
| 378 | ARF4 | GSM4909288 | Human | Breast | IDC | 4.24e-02 | -2.54e-01 | 0.0988 |
| 378 | ARF4 | GSM4909290 | Human | Breast | IDC | 8.74e-13 | 4.49e-01 | 0.2096 |
| 378 | ARF4 | GSM4909293 | Human | Breast | IDC | 2.95e-08 | -2.23e-01 | 0.1581 |
| 378 | ARF4 | GSM4909294 | Human | Breast | IDC | 1.47e-06 | -3.72e-01 | 0.2022 |
| 378 | ARF4 | GSM4909296 | Human | Breast | IDC | 2.46e-15 | -4.47e-01 | 0.1524 |
| 378 | ARF4 | GSM4909297 | Human | Breast | IDC | 4.27e-15 | -2.24e-01 | 0.1517 |
| 378 | ARF4 | GSM4909301 | Human | Breast | IDC | 6.85e-03 | -3.38e-01 | 0.1577 |
| 378 | ARF4 | GSM4909302 | Human | Breast | IDC | 1.92e-04 | -3.53e-01 | 0.1545 |
| 378 | ARF4 | GSM4909309 | Human | Breast | IDC | 1.61e-04 | -2.22e-01 | 0.0483 |
| 378 | ARF4 | GSM4909311 | Human | Breast | IDC | 4.59e-34 | -5.41e-01 | 0.1534 |
| 378 | ARF4 | GSM4909312 | Human | Breast | IDC | 5.48e-05 | -6.22e-02 | 0.1552 |
| 378 | ARF4 | GSM4909313 | Human | Breast | IDC | 1.06e-02 | -1.82e-01 | 0.0391 |
| 378 | ARF4 | GSM4909316 | Human | Breast | IDC | 6.05e-03 | -3.79e-01 | 0.21 |
| 378 | ARF4 | GSM4909317 | Human | Breast | IDC | 7.71e-05 | -3.93e-01 | 0.1355 |
| 378 | ARF4 | GSM4909318 | Human | Breast | IDC | 3.33e-05 | -6.87e-01 | 0.2031 |
| 378 | ARF4 | GSM4909319 | Human | Breast | IDC | 4.56e-44 | -5.57e-01 | 0.1563 |
| 378 | ARF4 | GSM4909320 | Human | Breast | IDC | 3.95e-11 | -5.00e-01 | 0.1575 |
| Page: 1 2 3 4 5 6 7 8 9 10 11 12 |
| Tissue | Expression Dynamics | Abbreviation |
| Breast |  | IDC: Invasive ductal carcinoma |
| DCIS: Ductal carcinoma in situ | ||
| Precancer(BRCA1-mut): Precancerous lesion from BRCA1 mutation carriers | ||
| Colorectum (GSE201348) |  | FAP: Familial adenomatous polyposis |
| CRC: Colorectal cancer | ||
| Colorectum (HTA11) | 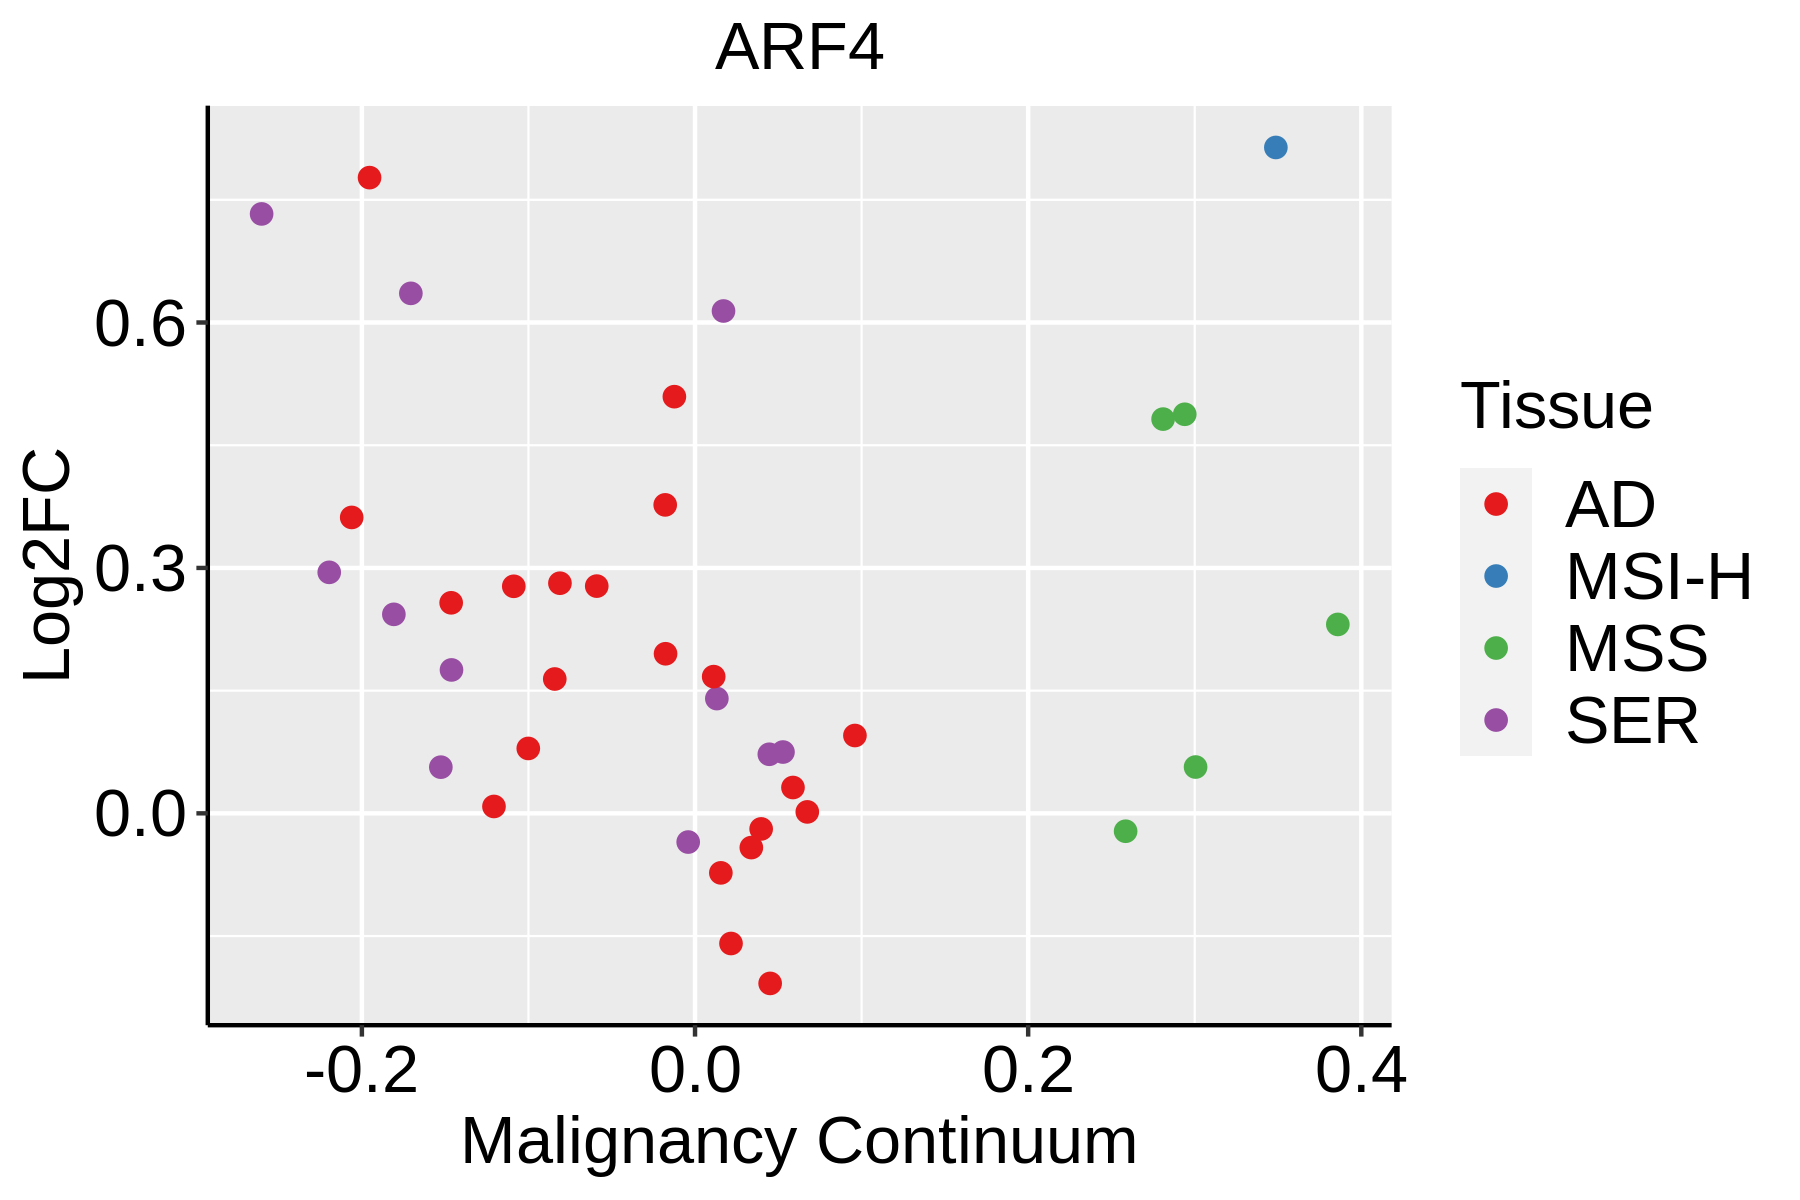 | AD: Adenomas |
| SER: Sessile serrated lesions | ||
| MSI-H: Microsatellite-high colorectal cancer | ||
| MSS: Microsatellite stable colorectal cancer | ||
| Endometrium |  | AEH: Atypical endometrial hyperplasia |
| EEC: Endometrioid Cancer | ||
| Esophagus |  | ESCC: Esophageal squamous cell carcinoma |
| HGIN: High-grade intraepithelial neoplasias | ||
| LGIN: Low-grade intraepithelial neoplasias | ||
| Liver | 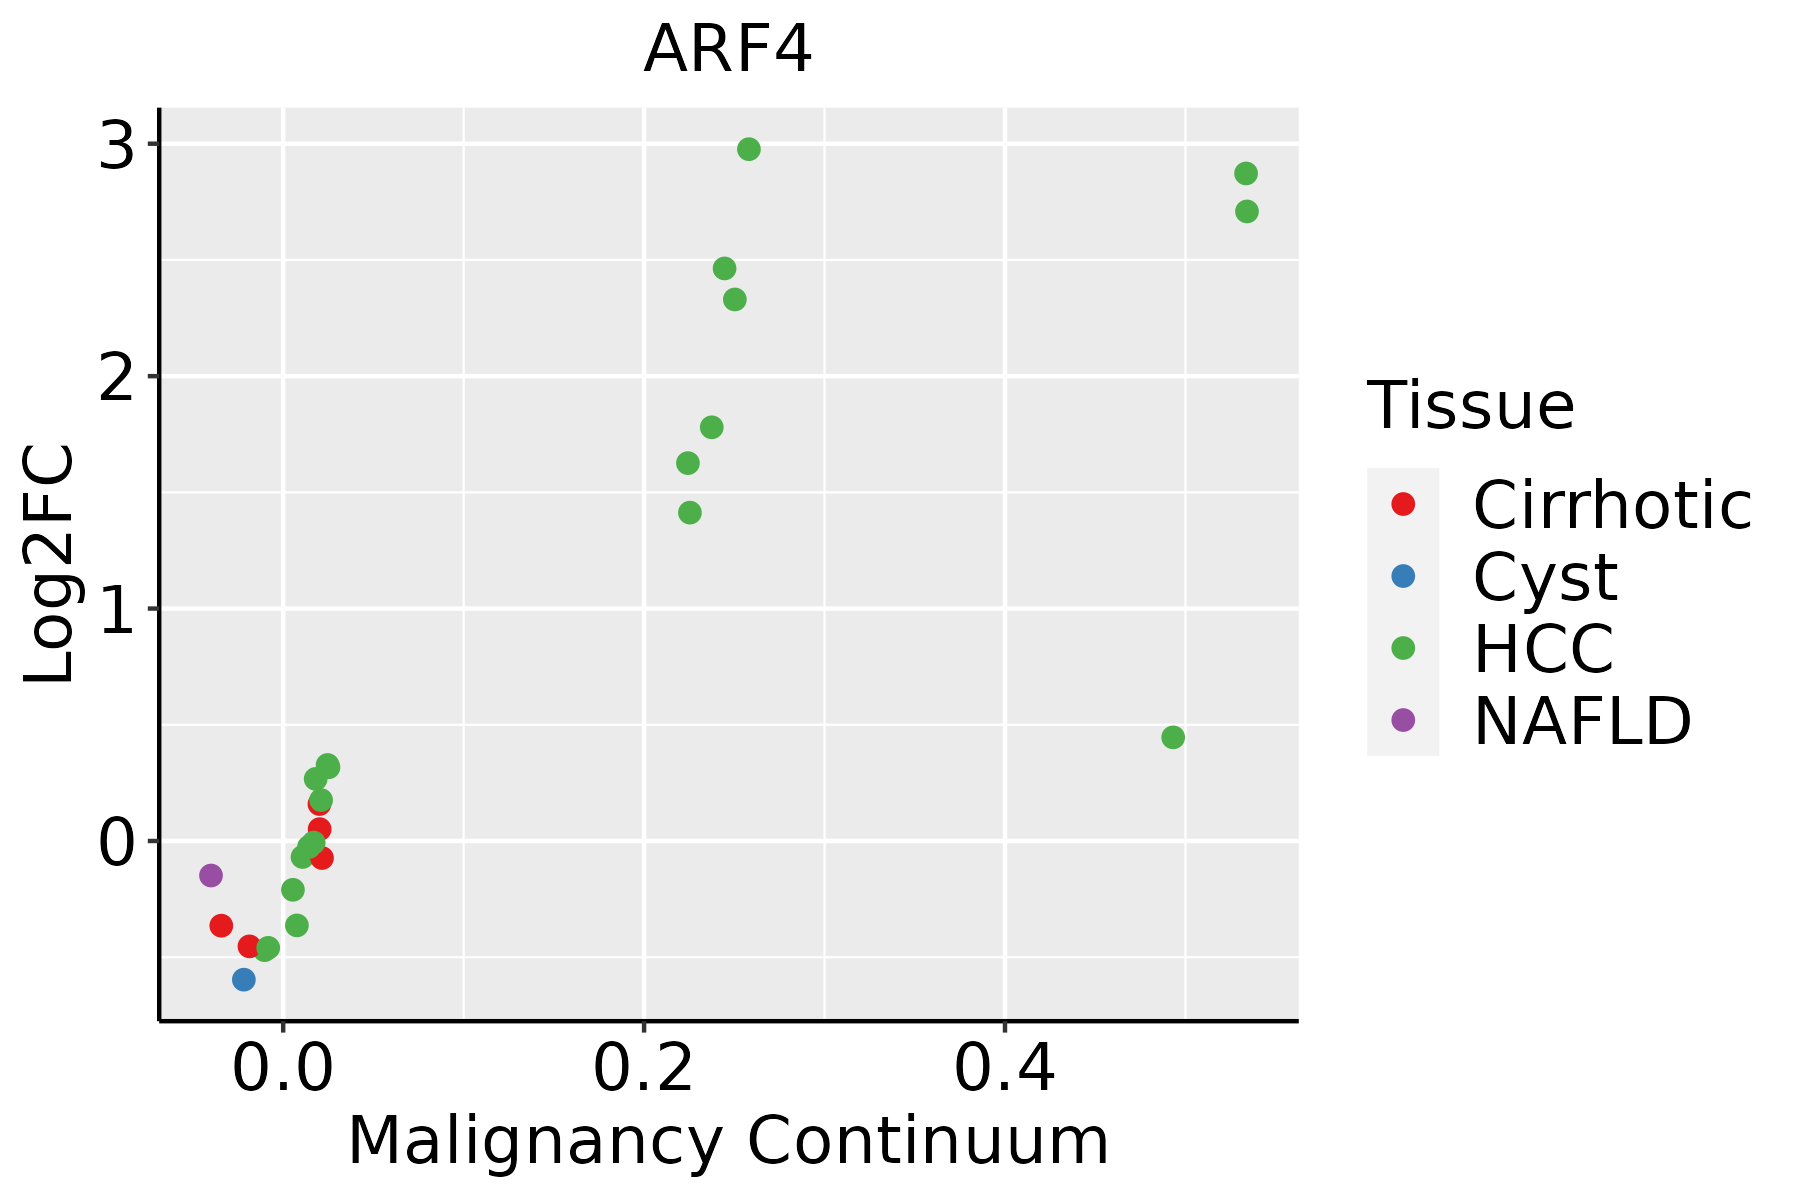 | HCC: Hepatocellular carcinoma |
| NAFLD: Non-alcoholic fatty liver disease | ||
| Oral Cavity | 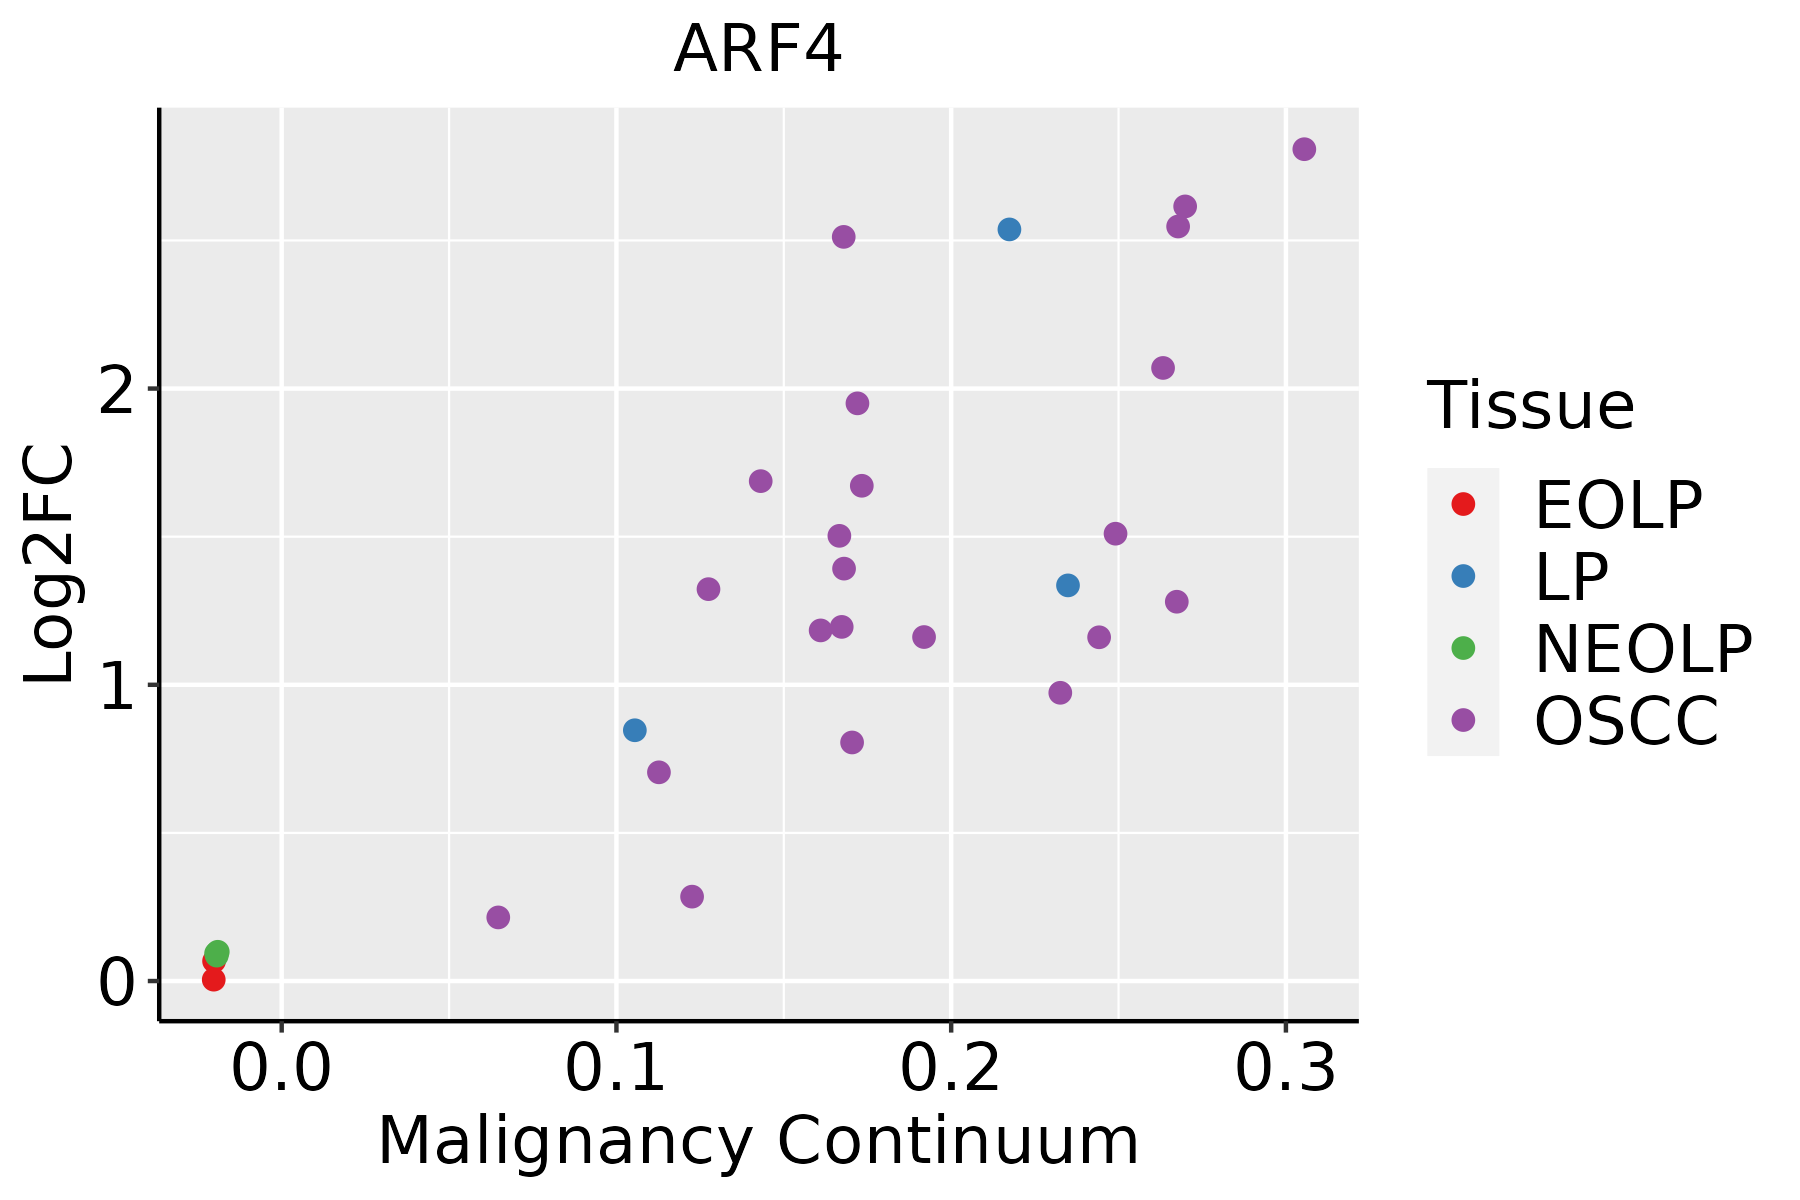 | EOLP: Erosive Oral lichen planus |
| LP: leukoplakia | ||
| NEOLP: Non-erosive oral lichen planus | ||
| OSCC: Oral squamous cell carcinoma | ||
| Prostate | 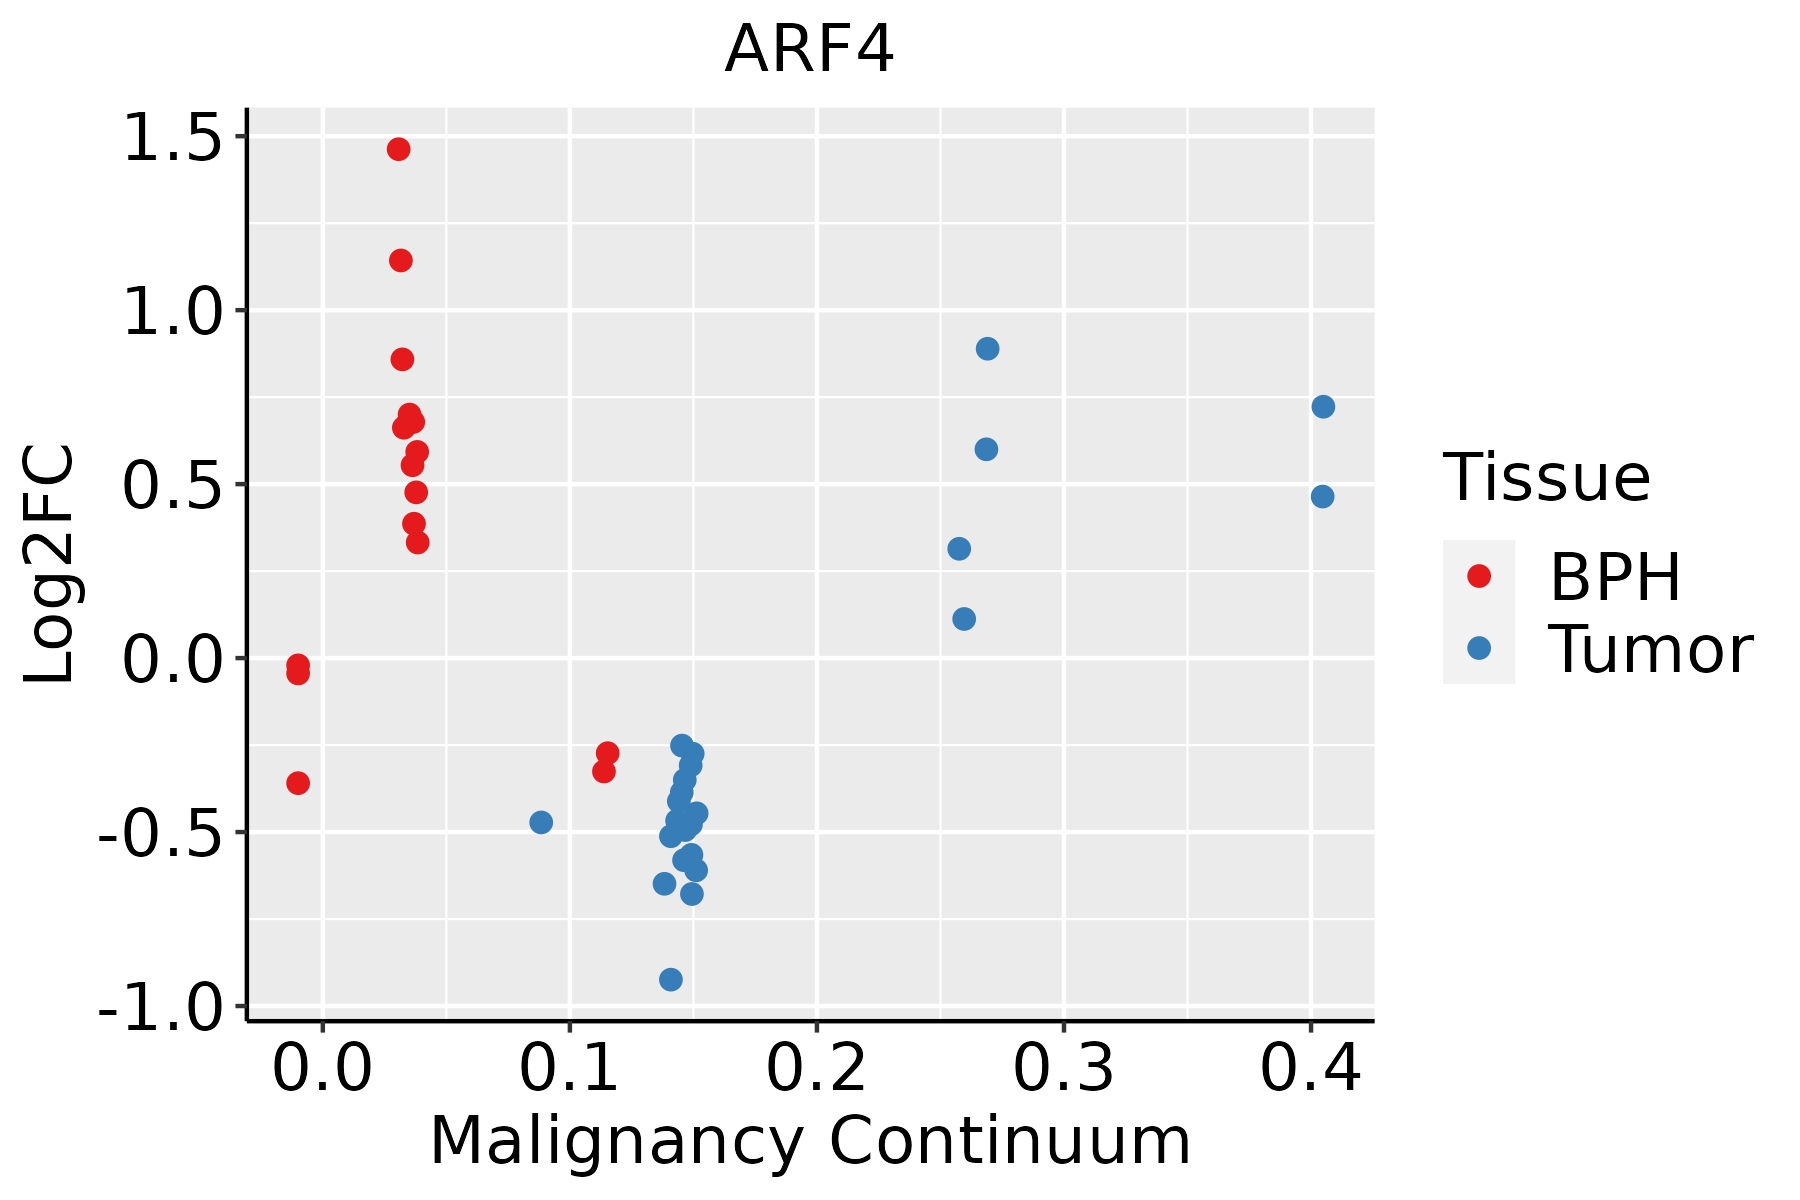 | BPH: Benign Prostatic Hyperplasia |
| Skin | 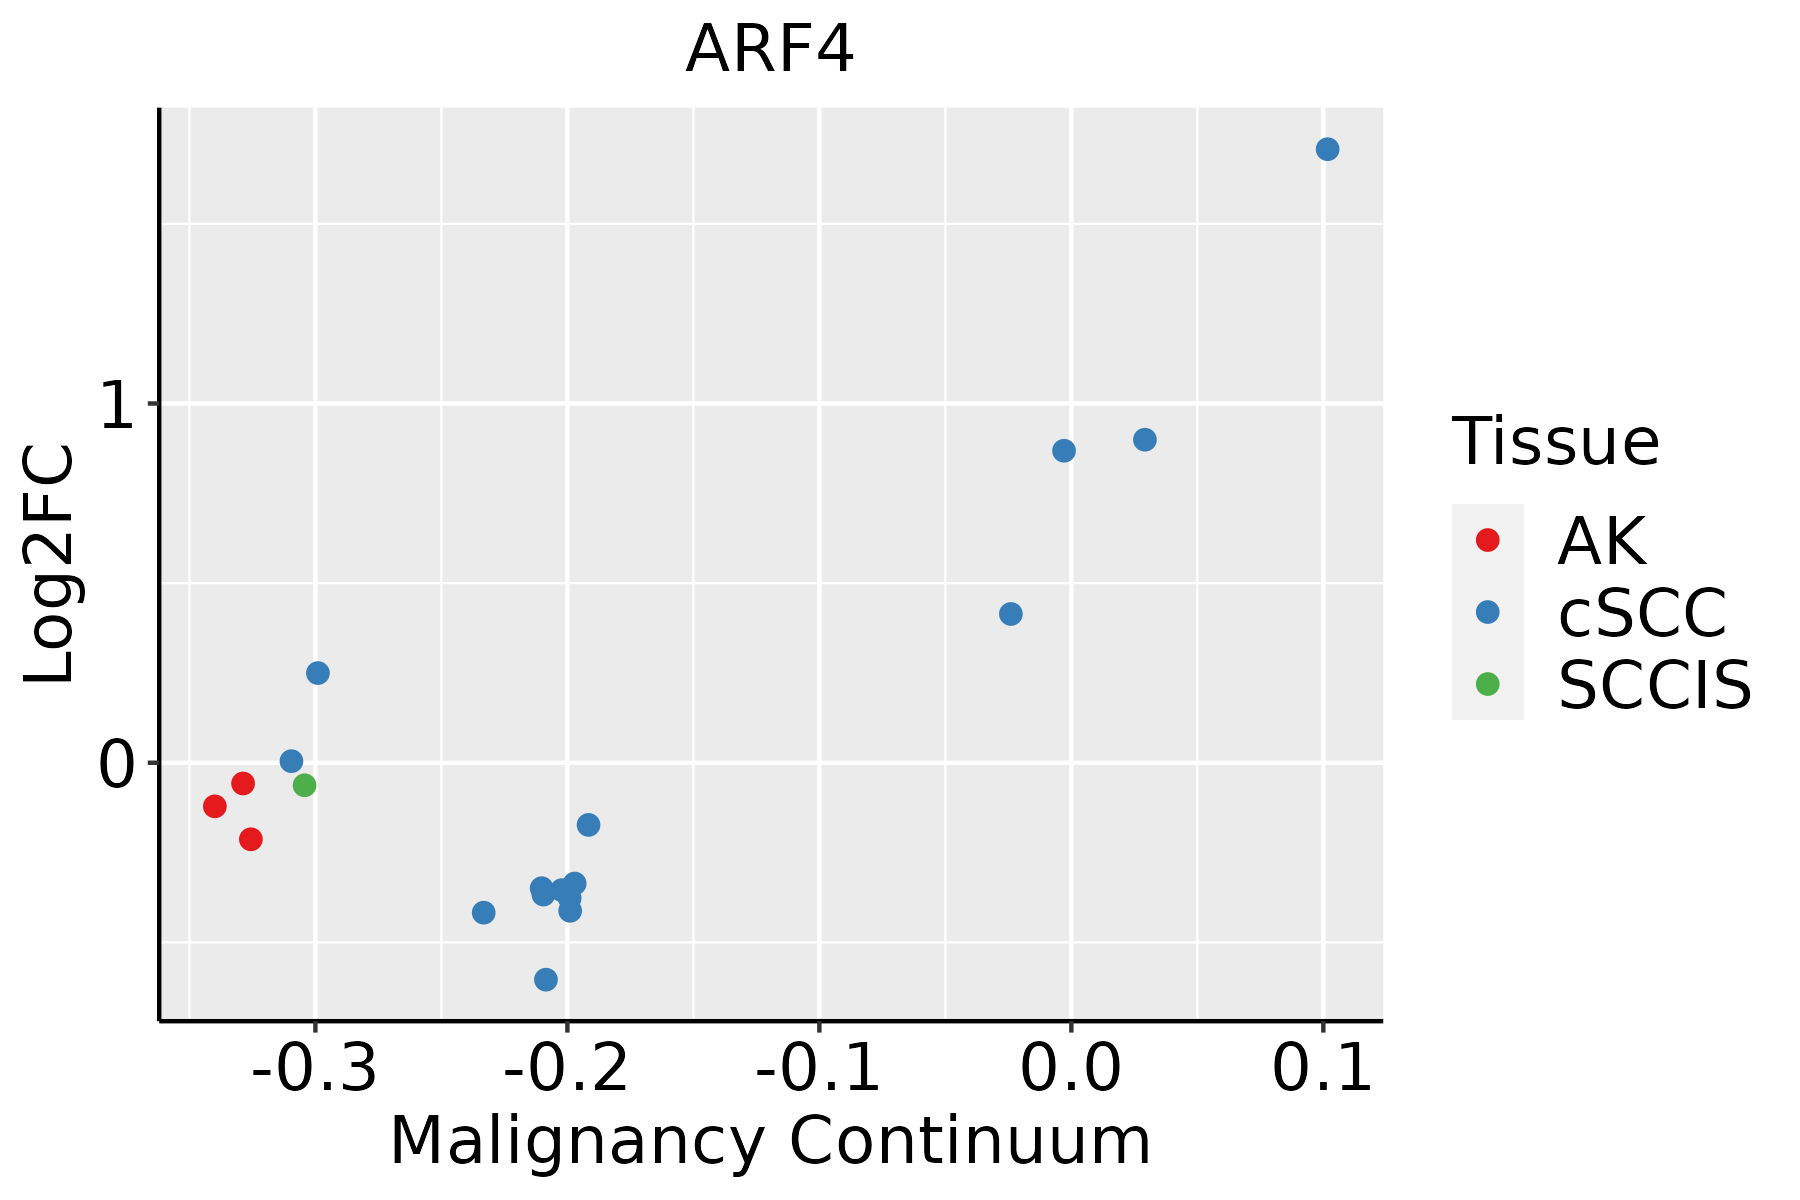 | AK: Actinic keratosis |
| cSCC: Cutaneous squamous cell carcinoma | ||
| SCCIS:squamous cell carcinoma in situ | ||
| Thyroid | 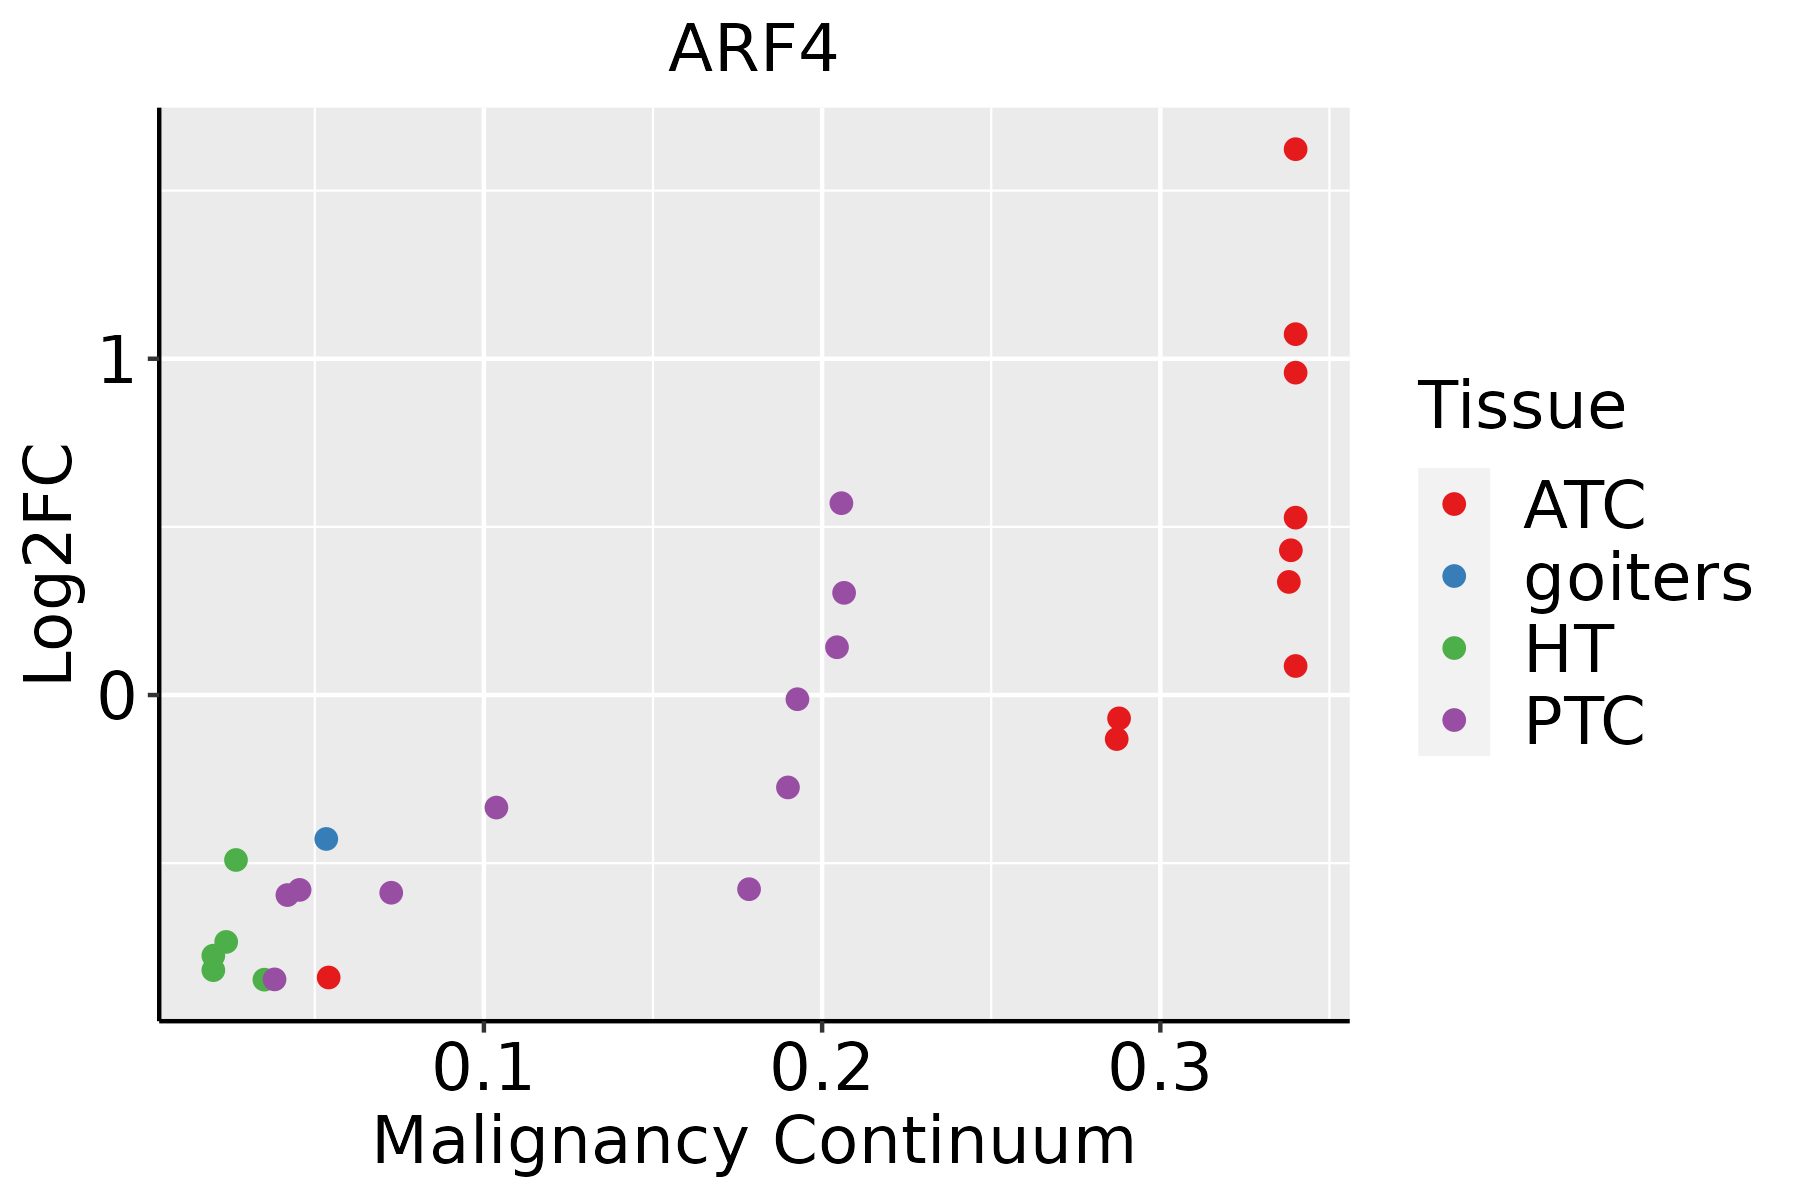 | ATC: Anaplastic thyroid cancer |
| HT: Hashimoto's thyroiditis | ||
| PTC: Papillary thyroid cancer |
| ∗log2FC in expression of this searched gene in stem-like cells from each diseased tissue sample relative to stem-like cells in normal samples in each tissue plotted against the malignancy continuum. Samples are colored based on if they are from different disease stage. |
Top |
Malignant transformation related pathway analysis |
| Find out the enriched GO biological processes and KEGG pathways involved in transition from healthy to precancer to cancer |
| Tissue | Disease Stage | Enriched GO biological Processes |
| Colorectum | AD |  |
| Colorectum | SER |  |
| Colorectum | MSS |  |
| Colorectum | MSI-H |  |
| Colorectum | FAP |  |
| ∗Top 15 enriched GO BP terms are showed in the bar plot of each disease state in each tissue. Each row represents a significant GO biological process which is colored according to the -log10(p.adjust). |
| Page: 1 2 3 4 5 6 7 8 9 |
| GO ID | Tissue | Disease Stage | Description | Gene Ratio | Bg Ratio | pvalue | p.adjust | Count |
| GO:00725938 | Breast | Precancer | reactive oxygen species metabolic process | 30/1080 | 239/18723 | 5.13e-05 | 1.07e-03 | 30 |
| GO:20003778 | Breast | Precancer | regulation of reactive oxygen species metabolic process | 20/1080 | 157/18723 | 7.19e-04 | 8.65e-03 | 20 |
| GO:00071638 | Breast | Precancer | establishment or maintenance of cell polarity | 23/1080 | 218/18723 | 3.82e-03 | 3.06e-02 | 23 |
| GO:007259313 | Breast | IDC | reactive oxygen species metabolic process | 36/1434 | 239/18723 | 7.16e-05 | 1.43e-03 | 36 |
| GO:000716314 | Breast | IDC | establishment or maintenance of cell polarity | 32/1434 | 218/18723 | 2.84e-04 | 4.33e-03 | 32 |
| GO:200037713 | Breast | IDC | regulation of reactive oxygen species metabolic process | 22/1434 | 157/18723 | 4.24e-03 | 3.31e-02 | 22 |
| GO:00068906 | Breast | IDC | retrograde vesicle-mediated transport, Golgi to endoplasmic reticulum | 10/1434 | 52/18723 | 5.49e-03 | 4.03e-02 | 10 |
| GO:007259322 | Breast | DCIS | reactive oxygen species metabolic process | 37/1390 | 239/18723 | 1.60e-05 | 3.88e-04 | 37 |
| GO:000716324 | Breast | DCIS | establishment or maintenance of cell polarity | 32/1390 | 218/18723 | 1.62e-04 | 2.71e-03 | 32 |
| GO:0048678 | Breast | DCIS | response to axon injury | 15/1390 | 83/18723 | 1.07e-03 | 1.16e-02 | 15 |
| GO:200037723 | Breast | DCIS | regulation of reactive oxygen species metabolic process | 23/1390 | 157/18723 | 1.31e-03 | 1.37e-02 | 23 |
| GO:000689012 | Breast | DCIS | retrograde vesicle-mediated transport, Golgi to endoplasmic reticulum | 10/1390 | 52/18723 | 4.41e-03 | 3.41e-02 | 10 |
| GO:0048193 | Colorectum | AD | Golgi vesicle transport | 109/3918 | 296/18723 | 1.80e-10 | 1.68e-08 | 109 |
| GO:0038127 | Colorectum | AD | ERBB signaling pathway | 55/3918 | 121/18723 | 1.19e-09 | 8.85e-08 | 55 |
| GO:0007173 | Colorectum | AD | epidermal growth factor receptor signaling pathway | 50/3918 | 108/18723 | 3.08e-09 | 2.07e-07 | 50 |
| GO:0007163 | Colorectum | AD | establishment or maintenance of cell polarity | 77/3918 | 218/18723 | 5.72e-07 | 2.08e-05 | 77 |
| GO:0006890 | Colorectum | AD | retrograde vesicle-mediated transport, Golgi to endoplasmic reticulum | 27/3918 | 52/18723 | 7.67e-07 | 2.70e-05 | 27 |
| GO:0045197 | Colorectum | AD | establishment or maintenance of epithelial cell apical/basal polarity | 20/3918 | 44/18723 | 2.26e-04 | 2.94e-03 | 20 |
| GO:0072593 | Colorectum | AD | reactive oxygen species metabolic process | 73/3918 | 239/18723 | 2.79e-04 | 3.42e-03 | 73 |
| GO:0006888 | Colorectum | AD | endoplasmic reticulum to Golgi vesicle-mediated transport | 44/3918 | 130/18723 | 4.13e-04 | 4.68e-03 | 44 |
| Page: 1 2 3 4 5 6 7 8 9 10 11 12 13 |
| Pathway ID | Tissue | Disease Stage | Description | Gene Ratio | Bg Ratio | pvalue | p.adjust | qvalue | Count |
| hsa0414416 | Breast | DCIS | Endocytosis | 37/846 | 251/8465 | 9.92e-03 | 4.40e-02 | 3.24e-02 | 37 |
| hsa0414417 | Breast | DCIS | Endocytosis | 37/846 | 251/8465 | 9.92e-03 | 4.40e-02 | 3.24e-02 | 37 |
| hsa04144 | Colorectum | AD | Endocytosis | 111/2092 | 251/8465 | 5.95e-12 | 1.42e-10 | 9.08e-11 | 111 |
| hsa041441 | Colorectum | AD | Endocytosis | 111/2092 | 251/8465 | 5.95e-12 | 1.42e-10 | 9.08e-11 | 111 |
| hsa041442 | Colorectum | SER | Endocytosis | 81/1580 | 251/8465 | 1.14e-07 | 2.36e-06 | 1.71e-06 | 81 |
| hsa041443 | Colorectum | SER | Endocytosis | 81/1580 | 251/8465 | 1.14e-07 | 2.36e-06 | 1.71e-06 | 81 |
| hsa041444 | Colorectum | MSS | Endocytosis | 102/1875 | 251/8465 | 1.85e-11 | 4.43e-10 | 2.71e-10 | 102 |
| hsa041445 | Colorectum | MSS | Endocytosis | 102/1875 | 251/8465 | 1.85e-11 | 4.43e-10 | 2.71e-10 | 102 |
| hsa041446 | Colorectum | FAP | Endocytosis | 78/1404 | 251/8465 | 6.20e-09 | 2.96e-07 | 1.80e-07 | 78 |
| hsa041447 | Colorectum | FAP | Endocytosis | 78/1404 | 251/8465 | 6.20e-09 | 2.96e-07 | 1.80e-07 | 78 |
| hsa041448 | Colorectum | CRC | Endocytosis | 65/1091 | 251/8465 | 1.27e-08 | 1.06e-06 | 7.19e-07 | 65 |
| hsa041449 | Colorectum | CRC | Endocytosis | 65/1091 | 251/8465 | 1.27e-08 | 1.06e-06 | 7.19e-07 | 65 |
| hsa0414420 | Endometrium | AEH | Endocytosis | 56/1197 | 251/8465 | 2.58e-04 | 2.15e-03 | 1.57e-03 | 56 |
| hsa04144110 | Endometrium | AEH | Endocytosis | 56/1197 | 251/8465 | 2.58e-04 | 2.15e-03 | 1.57e-03 | 56 |
| hsa0414424 | Endometrium | EEC | Endocytosis | 57/1237 | 251/8465 | 3.34e-04 | 2.82e-03 | 2.10e-03 | 57 |
| hsa0414434 | Endometrium | EEC | Endocytosis | 57/1237 | 251/8465 | 3.34e-04 | 2.82e-03 | 2.10e-03 | 57 |
| hsa04144210 | Esophagus | ESCC | Endocytosis | 186/4205 | 251/8465 | 9.74e-16 | 4.66e-14 | 2.39e-14 | 186 |
| hsa0414437 | Esophagus | ESCC | Endocytosis | 186/4205 | 251/8465 | 9.74e-16 | 4.66e-14 | 2.39e-14 | 186 |
| hsa0414412 | Liver | Cirrhotic | Endocytosis | 119/2530 | 251/8465 | 2.33e-09 | 4.56e-08 | 2.81e-08 | 119 |
| hsa0414413 | Liver | Cirrhotic | Endocytosis | 119/2530 | 251/8465 | 2.33e-09 | 4.56e-08 | 2.81e-08 | 119 |
| Page: 1 2 |
Top |
Cell-cell communication analysis |
| Identification of potential cell-cell interactions between two cell types and their ligand-receptor pairs for different disease states |
| Ligand | Receptor | LRpair | Pathway | Tissue | Disease Stage |
| Page: 1 |
Top |
Single-cell gene regulatory network inference analysis |
| Find out the significant the regulons (TFs) and the target genes of each regulon across cell types for different disease states |
| TF | Cell Type | Tissue | Disease Stage | Target Gene | RSS | Regulon Activity |
| ∗The dot plots of a searched regulon are shown for all cell subpopulations in each disease state of each tissue based on the regulon specific score inferred using pySCENIC and by calculating the average expression. |
| Page: 1 |
Top |
Somatic mutation of malignant transformation related genes |
| Annotation of somatic variants for genes involved in malignant transformation |
| Hugo Symbol | Variant Class | Variant Classification | dbSNP RS | HGVSc | HGVSp | HGVSp Short | SWISSPROT | BIOTYPE | SIFT | PolyPhen | Tumor Sample Barcode | Tissue | Histology | Sex | Age | Stage | Therapy Types | Drugs | Outcome |
| ARF4 | SNV | Missense_Mutation | novel | c.324N>T | p.Gln108His | p.Q108H | P18085 | protein_coding | tolerated_low_confidence(1) | benign(0) | TCGA-AN-A046-01 | Breast | breast invasive carcinoma | Female | >=65 | I/II | Unknown | Unknown | SD |
| ARF4 | SNV | Missense_Mutation | c.296N>A | p.Arg99Lys | p.R99K | P18085 | protein_coding | deleterious_low_confidence(0) | possibly_damaging(0.884) | TCGA-Q1-A5R1-01 | Cervix | cervical & endocervical cancer | Female | <65 | I/II | Unknown | Unknown | SD | |
| ARF4 | SNV | Missense_Mutation | rs777379437 | c.446N>A | p.Arg149His | p.R149H | P18085 | protein_coding | tolerated_low_confidence(0.11) | benign(0.052) | TCGA-AA-3864-01 | Colorectum | colon adenocarcinoma | Male | >=65 | I/II | Unknown | Unknown | SD |
| ARF4 | SNV | Missense_Mutation | novel | c.293N>C | p.Glu98Ala | p.E98A | P18085 | protein_coding | deleterious_low_confidence(0.02) | benign(0.156) | TCGA-AA-3984-01 | Colorectum | colon adenocarcinoma | Female | <65 | I/II | Unknown | Unknown | SD |
| ARF4 | SNV | Missense_Mutation | novel | c.283N>G | p.Asn95Asp | p.N95D | P18085 | protein_coding | deleterious_low_confidence(0.01) | possibly_damaging(0.604) | TCGA-AZ-4315-01 | Colorectum | colon adenocarcinoma | Male | <65 | I/II | Unknown | Unknown | SD |
| ARF4 | SNV | Missense_Mutation | rs747265204 | c.445N>T | p.Arg149Cys | p.R149C | P18085 | protein_coding | tolerated_low_confidence(0.05) | probably_damaging(0.95) | TCGA-AG-A002-01 | Colorectum | rectum adenocarcinoma | Male | <65 | I/II | Unknown | Unknown | SD |
| ARF4 | SNV | Missense_Mutation | c.296N>T | p.Arg99Ile | p.R99I | P18085 | protein_coding | deleterious_low_confidence(0) | probably_damaging(0.985) | TCGA-EI-6917-01 | Colorectum | rectum adenocarcinoma | Male | <65 | III/IV | Chemotherapy | 5fluorouracil+oxaciplatina+l-folinian | SD | |
| ARF4 | SNV | Missense_Mutation | rs747265204 | c.445C>T | p.Arg149Cys | p.R149C | P18085 | protein_coding | tolerated_low_confidence(0.05) | probably_damaging(0.95) | TCGA-B5-A0JY-01 | Endometrium | uterine corpus endometrioid carcinoma | Female | <65 | III/IV | Chemotherapy | doxorubicin | SD |
| ARF4 | SNV | Missense_Mutation | c.512A>G | p.Asp171Gly | p.D171G | P18085 | protein_coding | deleterious_low_confidence(0.01) | probably_damaging(0.977) | TCGA-B5-A11E-01 | Endometrium | uterine corpus endometrioid carcinoma | Female | <65 | I/II | Unknown | Unknown | SD | |
| ARF4 | SNV | Missense_Mutation | c.296N>T | p.Arg99Ile | p.R99I | P18085 | protein_coding | deleterious_low_confidence(0) | probably_damaging(0.985) | TCGA-B5-A1MR-01 | Endometrium | uterine corpus endometrioid carcinoma | Female | >=65 | III/IV | Unknown | Unknown | SD |
| Page: 1 2 |
Top |
Related drugs of malignant transformation related genes |
| Identification of chemicals and drugs interact with genes involved in malignant transfromation |
| (DGIdb 4.0) |
| Entrez ID | Symbol | Category | Interaction Types | Drug Claim Name | Drug Name | PMIDs |
| Page: 1 |

Copyright 2023-Present -The University of Texas Health Science Center at Houston |