
|
|||||
|
 | |
| |
| |
| |
| |
| |
|
Gene: ARF3 |
Gene summary for ARF3 |
| Gene information | Species | Human | Gene symbol | ARF3 | Gene ID | 377 |
| Gene name | ADP ribosylation factor 3 | |
| Gene Alias | ARF3 | |
| Cytomap | 12q13.12 | |
| Gene Type | protein-coding | GO ID | GO:0006810 | UniProtAcc | A0A024R0Y6 |
Top |
Malignant transformation analysis |
| Identification of the aberrant gene expression in precancerous and cancerous lesions by comparing the gene expression of stem-like cells in diseased tissues with normal stem cells |
| Entrez ID | Symbol | Replicates | Species | Organ | Tissue | Adj P-value | Log2FC | Malignancy |
| 377 | ARF3 | GSM4909296 | Human | Breast | IDC | 2.63e-03 | -5.85e-02 | 0.1524 |
| 377 | ARF3 | GSM4909297 | Human | Breast | IDC | 1.51e-04 | -1.58e-01 | 0.1517 |
| 377 | ARF3 | GSM4909311 | Human | Breast | IDC | 1.30e-15 | -1.27e-01 | 0.1534 |
| 377 | ARF3 | GSM4909319 | Human | Breast | IDC | 4.07e-21 | -1.28e-01 | 0.1563 |
| 377 | ARF3 | GSM4909321 | Human | Breast | IDC | 3.38e-06 | -2.69e-02 | 0.1559 |
| 377 | ARF3 | brca2 | Human | Breast | Precancer | 2.30e-03 | 2.55e-01 | -0.024 |
| 377 | ARF3 | NCCBC14 | Human | Breast | DCIS | 2.45e-05 | 5.47e-02 | 0.2021 |
| 377 | ARF3 | NCCBC2 | Human | Breast | DCIS | 4.53e-03 | 3.01e-02 | 0.1554 |
| 377 | ARF3 | NCCBC5 | Human | Breast | DCIS | 8.26e-05 | 2.94e-02 | 0.2046 |
| 377 | ARF3 | P1 | Human | Breast | IDC | 8.00e-07 | -1.30e-01 | 0.1527 |
| 377 | ARF3 | DCIS2 | Human | Breast | DCIS | 5.36e-47 | 8.54e-02 | 0.0085 |
| 377 | ARF3 | HTA11_3410_2000001011 | Human | Colorectum | AD | 5.63e-18 | 3.09e-01 | 0.0155 |
| 377 | ARF3 | HTA11_2487_2000001011 | Human | Colorectum | SER | 3.61e-42 | 1.08e+00 | -0.1808 |
| 377 | ARF3 | HTA11_2951_2000001011 | Human | Colorectum | AD | 3.03e-06 | 3.34e-01 | 0.0216 |
| 377 | ARF3 | HTA11_1938_2000001011 | Human | Colorectum | AD | 1.60e-37 | 1.07e+00 | -0.0811 |
| 377 | ARF3 | HTA11_78_2000001011 | Human | Colorectum | AD | 4.83e-28 | 7.44e-01 | -0.1088 |
| 377 | ARF3 | HTA11_347_2000001011 | Human | Colorectum | AD | 2.57e-61 | 1.18e+00 | -0.1954 |
| 377 | ARF3 | HTA11_411_2000001011 | Human | Colorectum | SER | 1.51e-16 | 1.15e+00 | -0.2602 |
| 377 | ARF3 | HTA11_2112_2000001011 | Human | Colorectum | SER | 2.67e-18 | 9.40e-01 | -0.2196 |
| 377 | ARF3 | HTA11_3361_2000001011 | Human | Colorectum | AD | 1.42e-20 | 6.38e-01 | -0.1207 |
| Page: 1 2 3 4 5 6 7 8 9 |
| Tissue | Expression Dynamics | Abbreviation |
| Breast |  | IDC: Invasive ductal carcinoma |
| DCIS: Ductal carcinoma in situ | ||
| Precancer(BRCA1-mut): Precancerous lesion from BRCA1 mutation carriers | ||
| Colorectum (GSE201348) |  | FAP: Familial adenomatous polyposis |
| CRC: Colorectal cancer | ||
| Colorectum (HTA11) |  | AD: Adenomas |
| SER: Sessile serrated lesions | ||
| MSI-H: Microsatellite-high colorectal cancer | ||
| MSS: Microsatellite stable colorectal cancer | ||
| Esophagus | 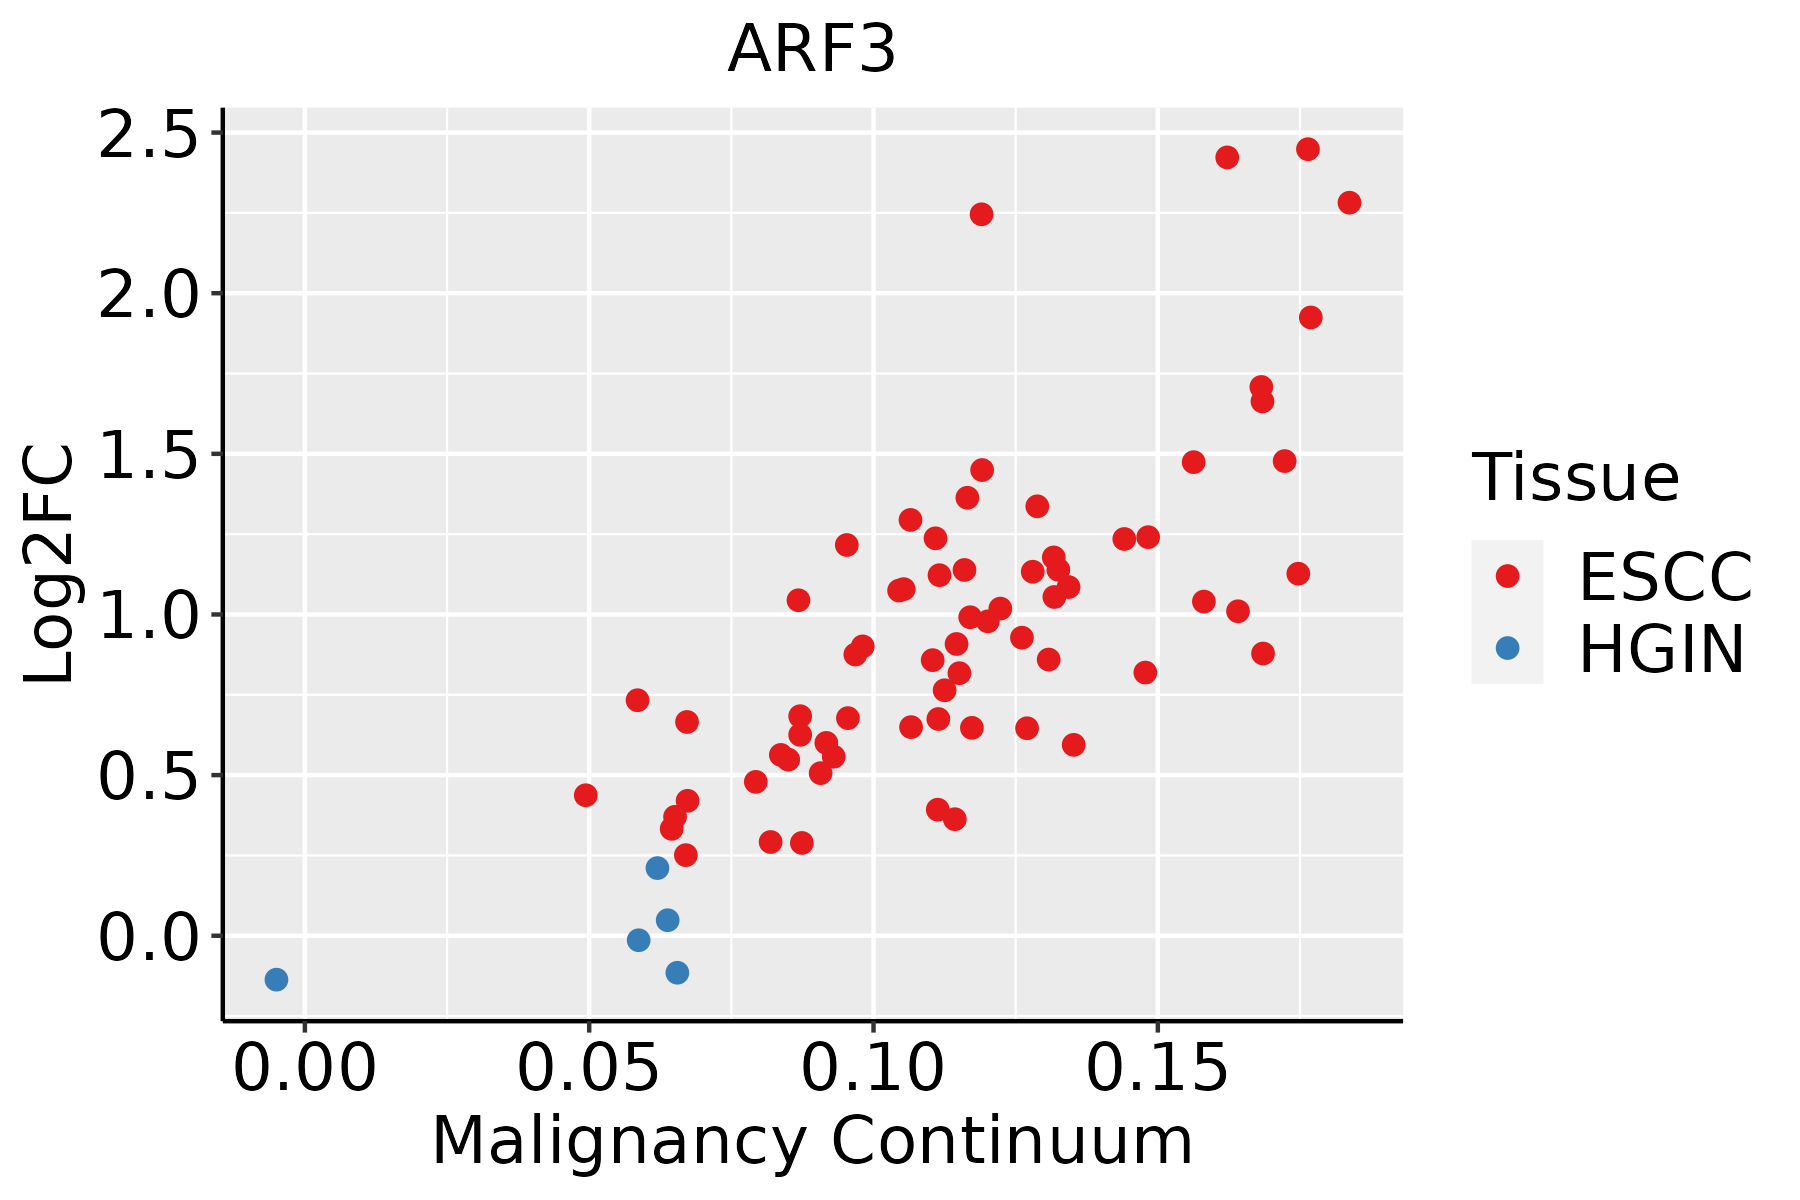 | ESCC: Esophageal squamous cell carcinoma |
| HGIN: High-grade intraepithelial neoplasias | ||
| LGIN: Low-grade intraepithelial neoplasias | ||
| Liver |  | HCC: Hepatocellular carcinoma |
| NAFLD: Non-alcoholic fatty liver disease | ||
| Oral Cavity | 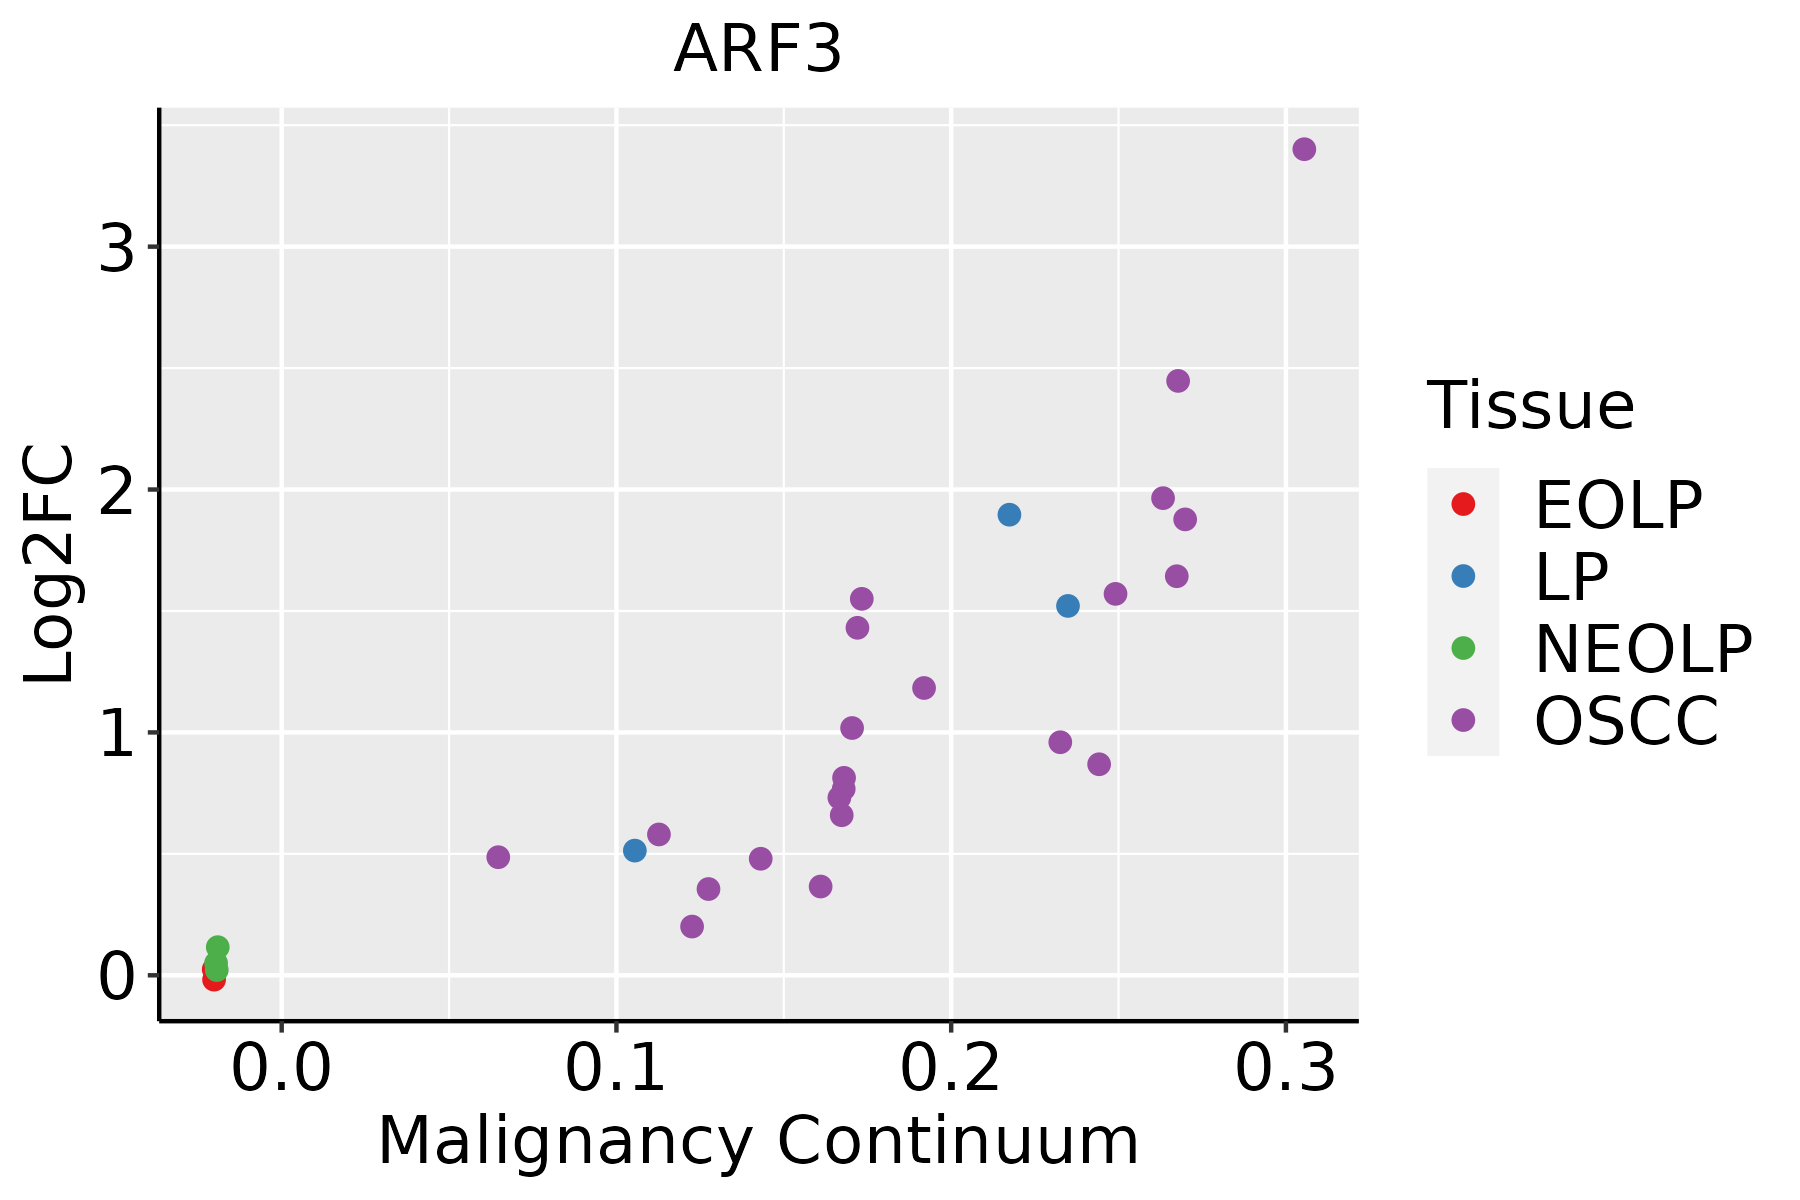 | EOLP: Erosive Oral lichen planus |
| LP: leukoplakia | ||
| NEOLP: Non-erosive oral lichen planus | ||
| OSCC: Oral squamous cell carcinoma | ||
| Prostate |  | BPH: Benign Prostatic Hyperplasia |
| Skin |  | AK: Actinic keratosis |
| cSCC: Cutaneous squamous cell carcinoma | ||
| SCCIS:squamous cell carcinoma in situ | ||
| Thyroid | 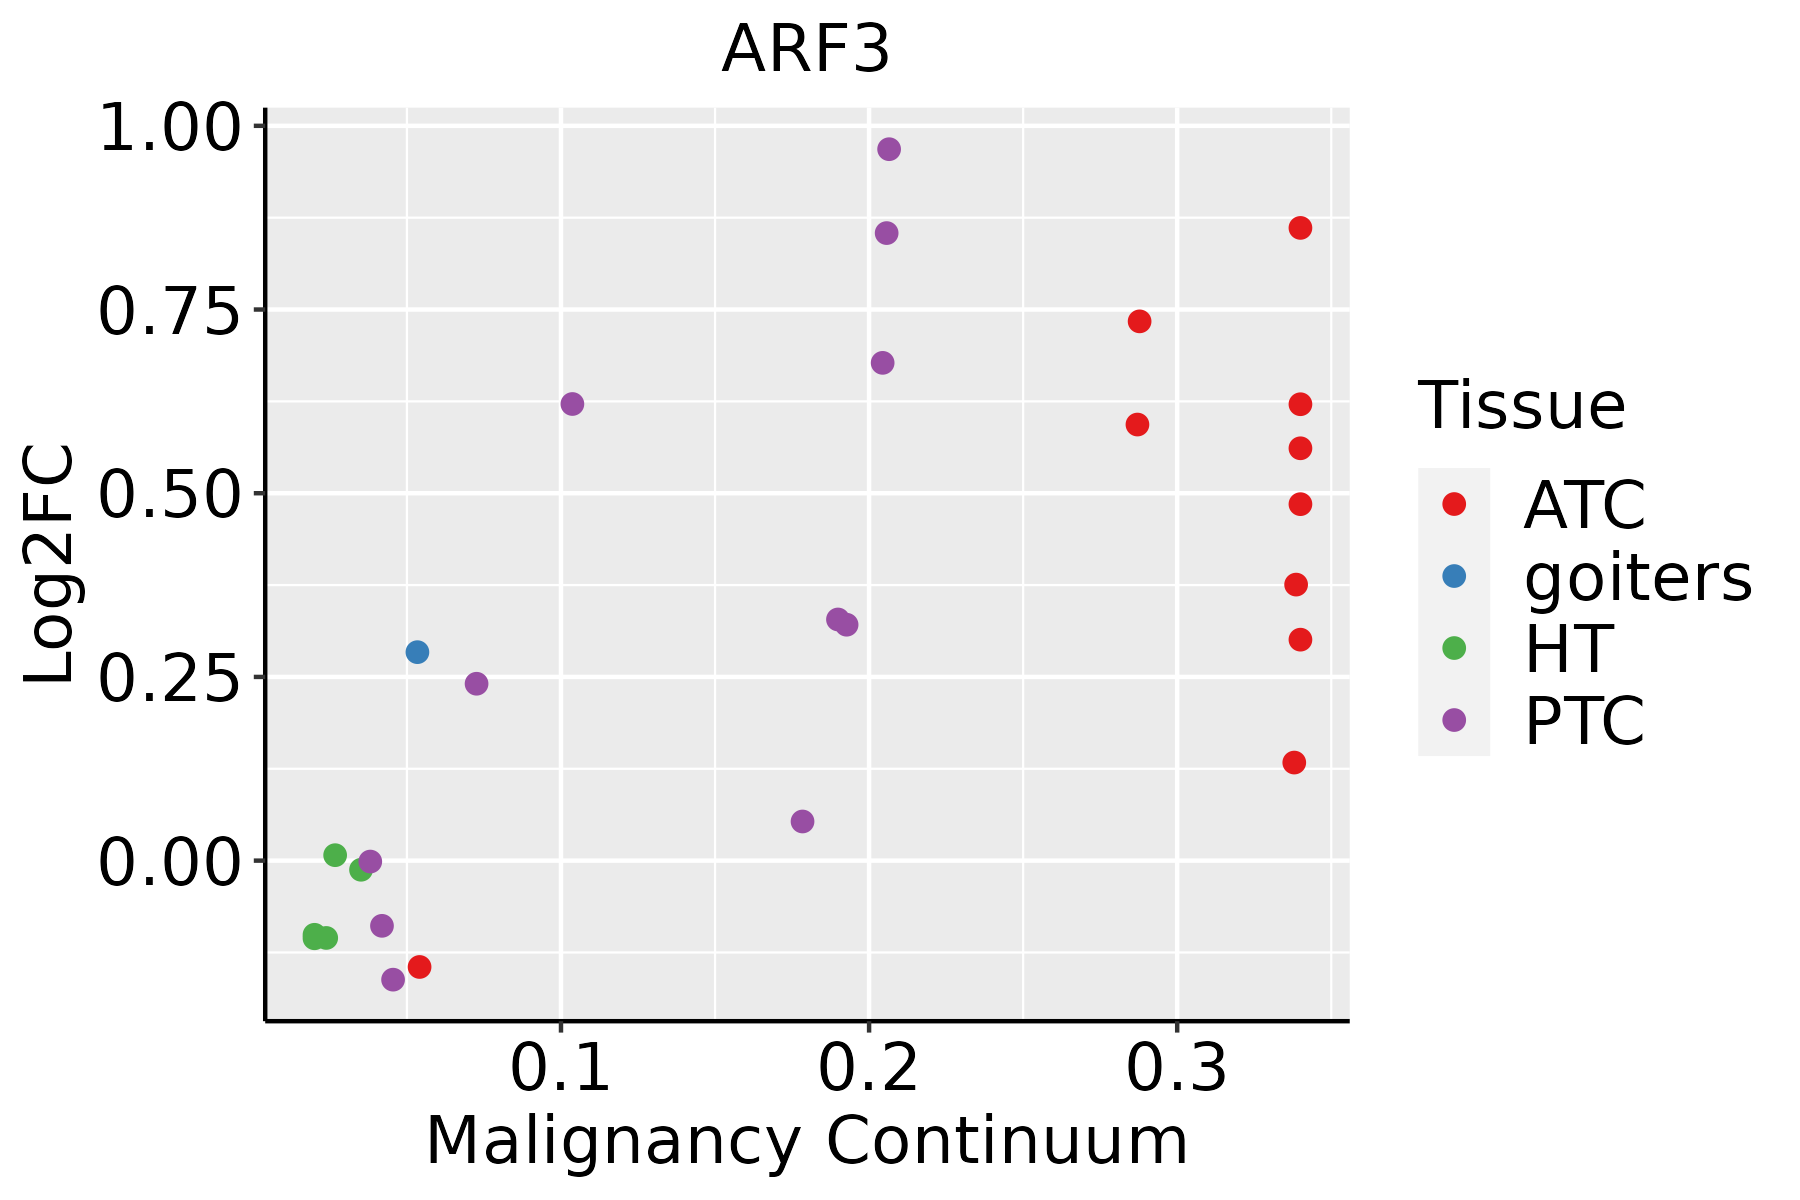 | ATC: Anaplastic thyroid cancer |
| HT: Hashimoto's thyroiditis | ||
| PTC: Papillary thyroid cancer |
| ∗log2FC in expression of this searched gene in stem-like cells from each diseased tissue sample relative to stem-like cells in normal samples in each tissue plotted against the malignancy continuum. Samples are colored based on if they are from different disease stage. |
Top |
Malignant transformation related pathway analysis |
| Find out the enriched GO biological processes and KEGG pathways involved in transition from healthy to precancer to cancer |
| Tissue | Disease Stage | Enriched GO biological Processes |
| Colorectum | AD |  |
| Colorectum | SER |  |
| Colorectum | MSS |  |
| Colorectum | MSI-H |  |
| Colorectum | FAP |  |
| ∗Top 15 enriched GO BP terms are showed in the bar plot of each disease state in each tissue. Each row represents a significant GO biological process which is colored according to the -log10(p.adjust). |
| Page: 1 2 3 4 5 6 7 8 9 |
| GO ID | Tissue | Disease Stage | Description | Gene Ratio | Bg Ratio | pvalue | p.adjust | Count |
| GO:00068906 | Breast | IDC | retrograde vesicle-mediated transport, Golgi to endoplasmic reticulum | 10/1434 | 52/18723 | 5.49e-03 | 4.03e-02 | 10 |
| GO:000689012 | Breast | DCIS | retrograde vesicle-mediated transport, Golgi to endoplasmic reticulum | 10/1390 | 52/18723 | 4.41e-03 | 3.41e-02 | 10 |
| GO:0048193 | Colorectum | AD | Golgi vesicle transport | 109/3918 | 296/18723 | 1.80e-10 | 1.68e-08 | 109 |
| GO:0006890 | Colorectum | AD | retrograde vesicle-mediated transport, Golgi to endoplasmic reticulum | 27/3918 | 52/18723 | 7.67e-07 | 2.70e-05 | 27 |
| GO:00481931 | Colorectum | SER | Golgi vesicle transport | 79/2897 | 296/18723 | 4.20e-07 | 2.15e-05 | 79 |
| GO:00068901 | Colorectum | SER | retrograde vesicle-mediated transport, Golgi to endoplasmic reticulum | 20/2897 | 52/18723 | 4.80e-05 | 1.18e-03 | 20 |
| GO:00481932 | Colorectum | MSS | Golgi vesicle transport | 101/3467 | 296/18723 | 9.09e-11 | 9.77e-09 | 101 |
| GO:00068902 | Colorectum | MSS | retrograde vesicle-mediated transport, Golgi to endoplasmic reticulum | 26/3467 | 52/18723 | 2.66e-07 | 1.10e-05 | 26 |
| GO:00068903 | Colorectum | MSI-H | retrograde vesicle-mediated transport, Golgi to endoplasmic reticulum | 13/1319 | 52/18723 | 4.72e-05 | 1.69e-03 | 13 |
| GO:00481933 | Colorectum | MSI-H | Golgi vesicle transport | 39/1319 | 296/18723 | 1.17e-04 | 3.51e-03 | 39 |
| GO:004819317 | Esophagus | HGIN | Golgi vesicle transport | 83/2587 | 296/18723 | 8.59e-11 | 8.89e-09 | 83 |
| GO:000689016 | Esophagus | HGIN | retrograde vesicle-mediated transport, Golgi to endoplasmic reticulum | 19/2587 | 52/18723 | 3.44e-05 | 8.67e-04 | 19 |
| GO:004819318 | Esophagus | ESCC | Golgi vesicle transport | 231/8552 | 296/18723 | 1.82e-30 | 9.63e-28 | 231 |
| GO:000689017 | Esophagus | ESCC | retrograde vesicle-mediated transport, Golgi to endoplasmic reticulum | 46/8552 | 52/18723 | 1.23e-10 | 3.66e-09 | 46 |
| GO:004819311 | Liver | Cirrhotic | Golgi vesicle transport | 153/4634 | 296/18723 | 1.02e-23 | 6.43e-21 | 153 |
| GO:00068905 | Liver | Cirrhotic | retrograde vesicle-mediated transport, Golgi to endoplasmic reticulum | 29/4634 | 52/18723 | 1.69e-06 | 3.22e-05 | 29 |
| GO:004819321 | Liver | HCC | Golgi vesicle transport | 217/7958 | 296/18723 | 2.58e-27 | 1.02e-24 | 217 |
| GO:000689011 | Liver | HCC | retrograde vesicle-mediated transport, Golgi to endoplasmic reticulum | 36/7958 | 52/18723 | 8.79e-05 | 7.66e-04 | 36 |
| GO:004819315 | Oral cavity | OSCC | Golgi vesicle transport | 209/7305 | 296/18723 | 1.39e-28 | 6.30e-26 | 209 |
| GO:000689010 | Oral cavity | OSCC | retrograde vesicle-mediated transport, Golgi to endoplasmic reticulum | 40/7305 | 52/18723 | 2.86e-08 | 5.50e-07 | 40 |
| Page: 1 2 |
| Pathway ID | Tissue | Disease Stage | Description | Gene Ratio | Bg Ratio | pvalue | p.adjust | qvalue | Count |
| hsa0414416 | Breast | DCIS | Endocytosis | 37/846 | 251/8465 | 9.92e-03 | 4.40e-02 | 3.24e-02 | 37 |
| hsa0414417 | Breast | DCIS | Endocytosis | 37/846 | 251/8465 | 9.92e-03 | 4.40e-02 | 3.24e-02 | 37 |
| hsa04144 | Colorectum | AD | Endocytosis | 111/2092 | 251/8465 | 5.95e-12 | 1.42e-10 | 9.08e-11 | 111 |
| hsa041441 | Colorectum | AD | Endocytosis | 111/2092 | 251/8465 | 5.95e-12 | 1.42e-10 | 9.08e-11 | 111 |
| hsa041442 | Colorectum | SER | Endocytosis | 81/1580 | 251/8465 | 1.14e-07 | 2.36e-06 | 1.71e-06 | 81 |
| hsa041443 | Colorectum | SER | Endocytosis | 81/1580 | 251/8465 | 1.14e-07 | 2.36e-06 | 1.71e-06 | 81 |
| hsa041444 | Colorectum | MSS | Endocytosis | 102/1875 | 251/8465 | 1.85e-11 | 4.43e-10 | 2.71e-10 | 102 |
| hsa041445 | Colorectum | MSS | Endocytosis | 102/1875 | 251/8465 | 1.85e-11 | 4.43e-10 | 2.71e-10 | 102 |
| hsa0414429 | Esophagus | HGIN | Endocytosis | 76/1383 | 251/8465 | 1.74e-08 | 3.34e-07 | 2.65e-07 | 76 |
| hsa04144113 | Esophagus | HGIN | Endocytosis | 76/1383 | 251/8465 | 1.74e-08 | 3.34e-07 | 2.65e-07 | 76 |
| hsa04144210 | Esophagus | ESCC | Endocytosis | 186/4205 | 251/8465 | 9.74e-16 | 4.66e-14 | 2.39e-14 | 186 |
| hsa0414437 | Esophagus | ESCC | Endocytosis | 186/4205 | 251/8465 | 9.74e-16 | 4.66e-14 | 2.39e-14 | 186 |
| hsa0414412 | Liver | Cirrhotic | Endocytosis | 119/2530 | 251/8465 | 2.33e-09 | 4.56e-08 | 2.81e-08 | 119 |
| hsa0414413 | Liver | Cirrhotic | Endocytosis | 119/2530 | 251/8465 | 2.33e-09 | 4.56e-08 | 2.81e-08 | 119 |
| hsa0414422 | Liver | HCC | Endocytosis | 178/4020 | 251/8465 | 2.03e-14 | 5.22e-13 | 2.91e-13 | 178 |
| hsa0414432 | Liver | HCC | Endocytosis | 178/4020 | 251/8465 | 2.03e-14 | 5.22e-13 | 2.91e-13 | 178 |
| hsa0414427 | Oral cavity | OSCC | Endocytosis | 174/3704 | 251/8465 | 9.42e-17 | 4.51e-15 | 2.29e-15 | 174 |
| hsa04144112 | Oral cavity | OSCC | Endocytosis | 174/3704 | 251/8465 | 9.42e-17 | 4.51e-15 | 2.29e-15 | 174 |
| hsa0414428 | Oral cavity | LP | Endocytosis | 121/2418 | 251/8465 | 1.89e-11 | 3.70e-10 | 2.38e-10 | 121 |
| hsa0414436 | Oral cavity | LP | Endocytosis | 121/2418 | 251/8465 | 1.89e-11 | 3.70e-10 | 2.38e-10 | 121 |
| Page: 1 2 |
Top |
Cell-cell communication analysis |
| Identification of potential cell-cell interactions between two cell types and their ligand-receptor pairs for different disease states |
| Ligand | Receptor | LRpair | Pathway | Tissue | Disease Stage |
| Page: 1 |
Top |
Single-cell gene regulatory network inference analysis |
| Find out the significant the regulons (TFs) and the target genes of each regulon across cell types for different disease states |
| TF | Cell Type | Tissue | Disease Stage | Target Gene | RSS | Regulon Activity |
| ∗The dot plots of a searched regulon are shown for all cell subpopulations in each disease state of each tissue based on the regulon specific score inferred using pySCENIC and by calculating the average expression. |
| Page: 1 |
Top |
Somatic mutation of malignant transformation related genes |
| Annotation of somatic variants for genes involved in malignant transformation |
| Hugo Symbol | Variant Class | Variant Classification | dbSNP RS | HGVSc | HGVSp | HGVSp Short | SWISSPROT | BIOTYPE | SIFT | PolyPhen | Tumor Sample Barcode | Tissue | Histology | Sex | Age | Stage | Therapy Types | Drugs | Outcome |
| ARF3 | SNV | Missense_Mutation | c.12N>G | p.Ile4Met | p.I4M | P61204 | protein_coding | tolerated_low_confidence(0.18) | benign(0.001) | TCGA-A1-A0SN-01 | Breast | breast invasive carcinoma | Female | <65 | I/II | Chemotherapy | ac | SD | |
| ARF3 | SNV | Missense_Mutation | c.224N>A | p.Arg75Gln | p.R75Q | P61204 | protein_coding | deleterious_low_confidence(0.04) | possibly_damaging(0.648) | TCGA-F5-6814-01 | Colorectum | rectum adenocarcinoma | Male | <65 | I/II | Unknown | Unknown | SD | |
| ARF3 | SNV | Missense_Mutation | novel | c.452G>A | p.Arg151His | p.R151H | P61204 | protein_coding | deleterious_low_confidence(0) | benign(0.326) | TCGA-A5-A0VP-01 | Endometrium | uterine corpus endometrioid carcinoma | Female | >=65 | I/II | Unknown | Unknown | SD |
| ARF3 | SNV | Missense_Mutation | novel | c.446N>A | p.Arg149His | p.R149H | P61204 | protein_coding | tolerated_low_confidence(0.16) | benign(0.042) | TCGA-AJ-A3BH-01 | Endometrium | uterine corpus endometrioid carcinoma | Female | Unknown | I/II | Unknown | Unknown | SD |
| ARF3 | SNV | Missense_Mutation | rs753931886 | c.311N>A | p.Arg104Gln | p.R104Q | P61204 | protein_coding | tolerated_low_confidence(0.05) | benign(0.029) | TCGA-AP-A059-01 | Endometrium | uterine corpus endometrioid carcinoma | Female | >=65 | I/II | Unknown | Unknown | SD |
| ARF3 | SNV | Missense_Mutation | c.235N>G | p.Arg79Gly | p.R79G | P61204 | protein_coding | deleterious_low_confidence(0) | probably_damaging(0.912) | TCGA-AP-A059-01 | Endometrium | uterine corpus endometrioid carcinoma | Female | >=65 | I/II | Unknown | Unknown | SD | |
| ARF3 | SNV | Missense_Mutation | novel | c.71N>A | p.Gly24Asp | p.G24D | P61204 | protein_coding | deleterious_low_confidence(0) | probably_damaging(0.994) | TCGA-AP-A0LM-01 | Endometrium | uterine corpus endometrioid carcinoma | Female | <65 | III/IV | Chemotherapy | cisplatin | SD |
| ARF3 | SNV | Missense_Mutation | c.224G>A | p.Arg75Gln | p.R75Q | P61204 | protein_coding | deleterious_low_confidence(0.04) | possibly_damaging(0.648) | TCGA-AX-A2HC-01 | Endometrium | uterine corpus endometrioid carcinoma | Female | <65 | III/IV | Chemotherapy | paclitaxel | PD | |
| ARF3 | SNV | Missense_Mutation | c.44N>T | p.Lys15Met | p.K15M | P61204 | protein_coding | deleterious_low_confidence(0.01) | possibly_damaging(0.77) | TCGA-BS-A0UF-01 | Endometrium | uterine corpus endometrioid carcinoma | Female | >=65 | I/II | Unknown | Unknown | SD | |
| ARF3 | SNV | Missense_Mutation | c.482N>T | p.Thr161Ile | p.T161I | P61204 | protein_coding | tolerated_low_confidence(0.08) | benign(0.145) | TCGA-D1-A103-01 | Endometrium | uterine corpus endometrioid carcinoma | Female | >=65 | I/II | Unknown | Unknown | SD |
| Page: 1 2 |
Top |
Related drugs of malignant transformation related genes |
| Identification of chemicals and drugs interact with genes involved in malignant transfromation |
| (DGIdb 4.0) |
| Entrez ID | Symbol | Category | Interaction Types | Drug Claim Name | Drug Name | PMIDs |
| Page: 1 |

Copyright 2023-Present -The University of Texas Health Science Center at Houston |