
|
|||||
|
 | |
| |
| |
| |
| |
| |
|
Gene: ARF1 |
Gene summary for ARF1 |
| Gene information | Species | Human | Gene symbol | ARF1 | Gene ID | 375 |
| Gene name | ADP ribosylation factor 1 | |
| Gene Alias | PVNH8 | |
| Cytomap | 1q42.13 | |
| Gene Type | protein-coding | GO ID | GO:0000278 | UniProtAcc | A0A024R3Q3 |
Top |
Malignant transformation analysis |
| Identification of the aberrant gene expression in precancerous and cancerous lesions by comparing the gene expression of stem-like cells in diseased tissues with normal stem cells |
| Entrez ID | Symbol | Replicates | Species | Organ | Tissue | Adj P-value | Log2FC | Malignancy |
| 375 | ARF1 | GSM4909282 | Human | Breast | IDC | 3.97e-11 | 3.07e-01 | -0.0288 |
| 375 | ARF1 | GSM4909285 | Human | Breast | IDC | 8.30e-15 | 4.00e-01 | 0.21 |
| 375 | ARF1 | GSM4909287 | Human | Breast | IDC | 2.25e-06 | 1.16e-01 | 0.2057 |
| 375 | ARF1 | GSM4909288 | Human | Breast | IDC | 1.61e-04 | -2.06e-01 | 0.0988 |
| 375 | ARF1 | GSM4909293 | Human | Breast | IDC | 3.39e-06 | 2.58e-01 | 0.1581 |
| 375 | ARF1 | GSM4909294 | Human | Breast | IDC | 8.58e-10 | -4.07e-01 | 0.2022 |
| 375 | ARF1 | GSM4909296 | Human | Breast | IDC | 6.94e-17 | -3.74e-01 | 0.1524 |
| 375 | ARF1 | GSM4909297 | Human | Breast | IDC | 8.11e-26 | -4.32e-01 | 0.1517 |
| 375 | ARF1 | GSM4909301 | Human | Breast | IDC | 8.68e-05 | -3.73e-01 | 0.1577 |
| 375 | ARF1 | GSM4909309 | Human | Breast | IDC | 1.52e-04 | -3.01e-01 | 0.0483 |
| 375 | ARF1 | GSM4909311 | Human | Breast | IDC | 2.52e-49 | -5.24e-01 | 0.1534 |
| 375 | ARF1 | GSM4909312 | Human | Breast | IDC | 1.93e-15 | -3.10e-02 | 0.1552 |
| 375 | ARF1 | GSM4909313 | Human | Breast | IDC | 4.17e-05 | -1.61e-01 | 0.0391 |
| 375 | ARF1 | GSM4909316 | Human | Breast | IDC | 4.16e-10 | 1.73e-01 | 0.21 |
| 375 | ARF1 | GSM4909319 | Human | Breast | IDC | 1.82e-62 | -3.20e-01 | 0.1563 |
| 375 | ARF1 | GSM4909320 | Human | Breast | IDC | 8.78e-16 | -6.45e-01 | 0.1575 |
| 375 | ARF1 | GSM4909321 | Human | Breast | IDC | 1.22e-18 | -1.46e-01 | 0.1559 |
| 375 | ARF1 | brca1 | Human | Breast | Precancer | 1.09e-07 | 3.39e-01 | -0.0338 |
| 375 | ARF1 | brca3 | Human | Breast | Precancer | 1.05e-03 | 2.54e-01 | -0.0263 |
| 375 | ARF1 | M2 | Human | Breast | IDC | 5.82e-07 | -2.70e-01 | 0.21 |
| Page: 1 2 3 4 5 6 7 8 9 10 11 12 13 |
| Tissue | Expression Dynamics | Abbreviation |
| Breast | 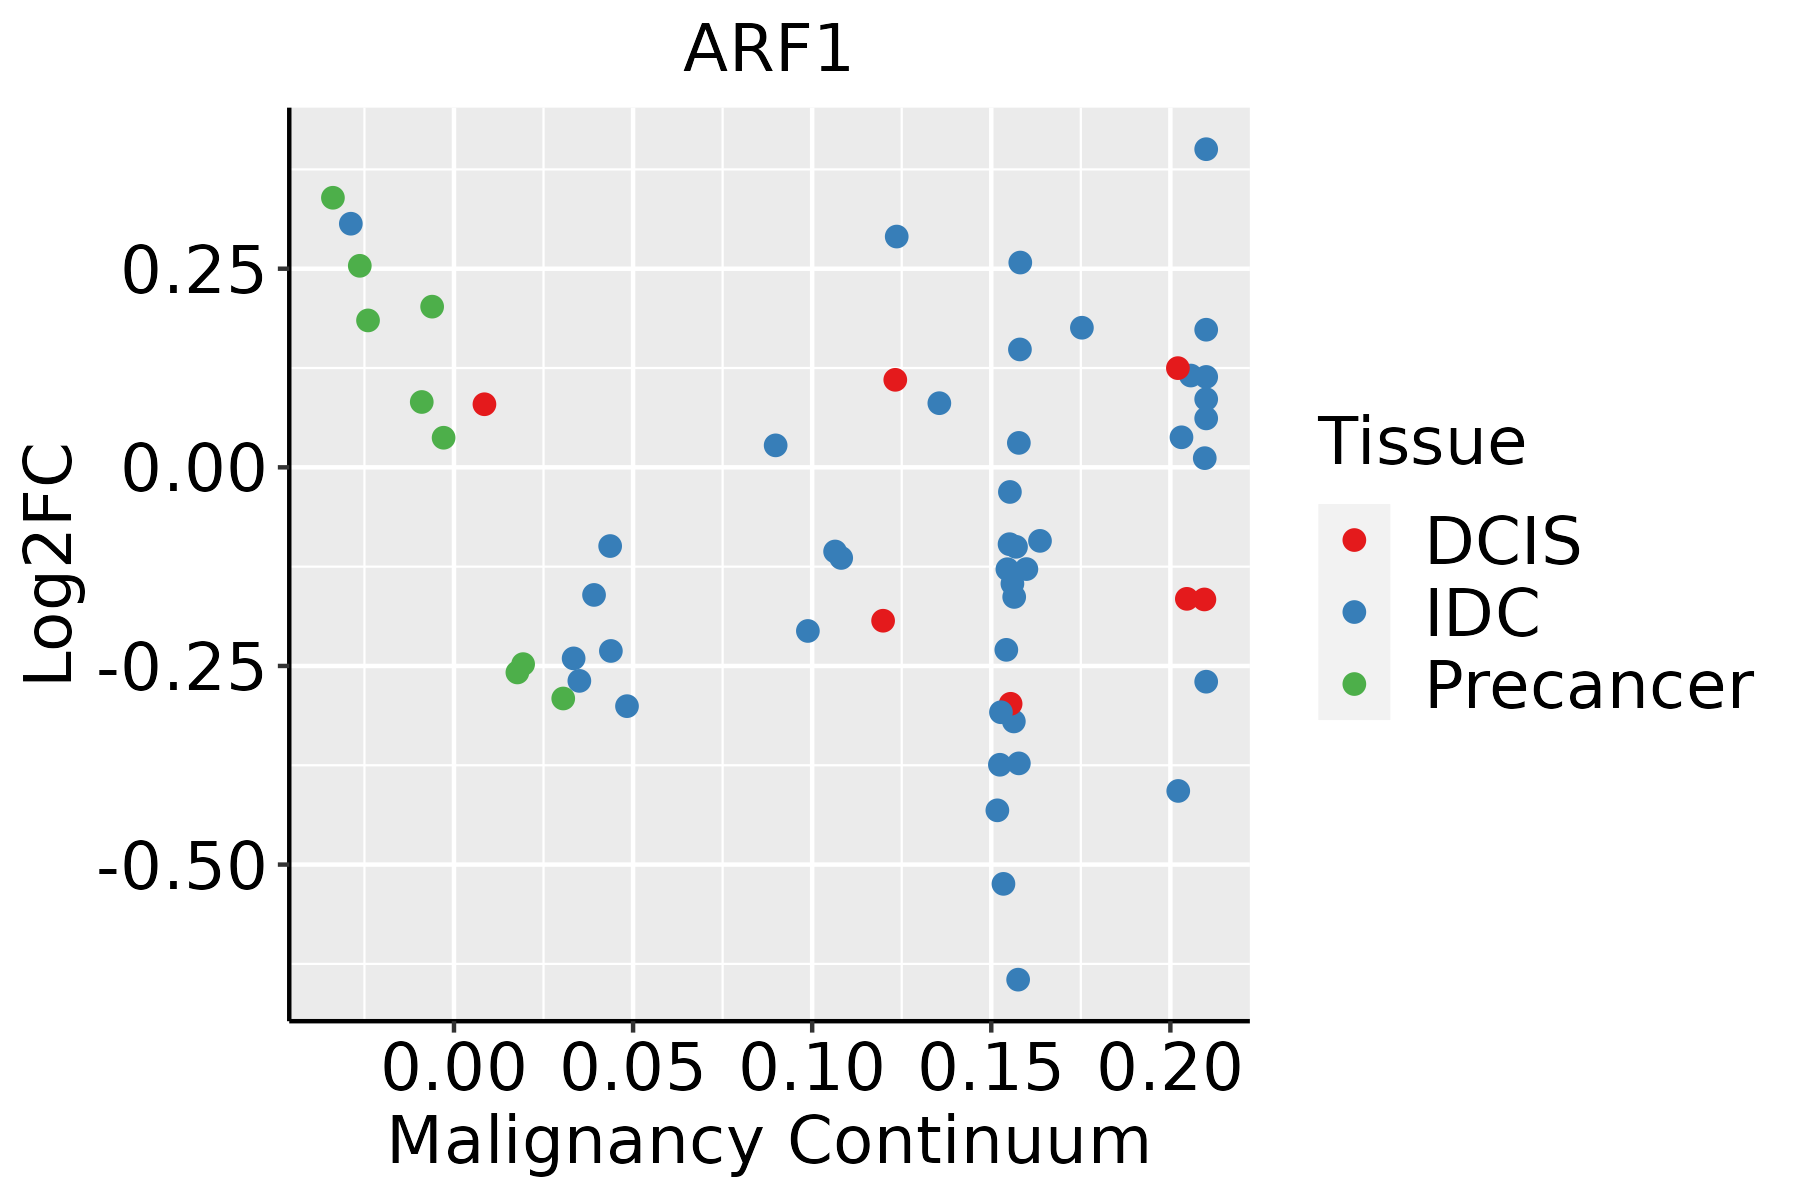 | IDC: Invasive ductal carcinoma |
| DCIS: Ductal carcinoma in situ | ||
| Precancer(BRCA1-mut): Precancerous lesion from BRCA1 mutation carriers | ||
| Cervix | 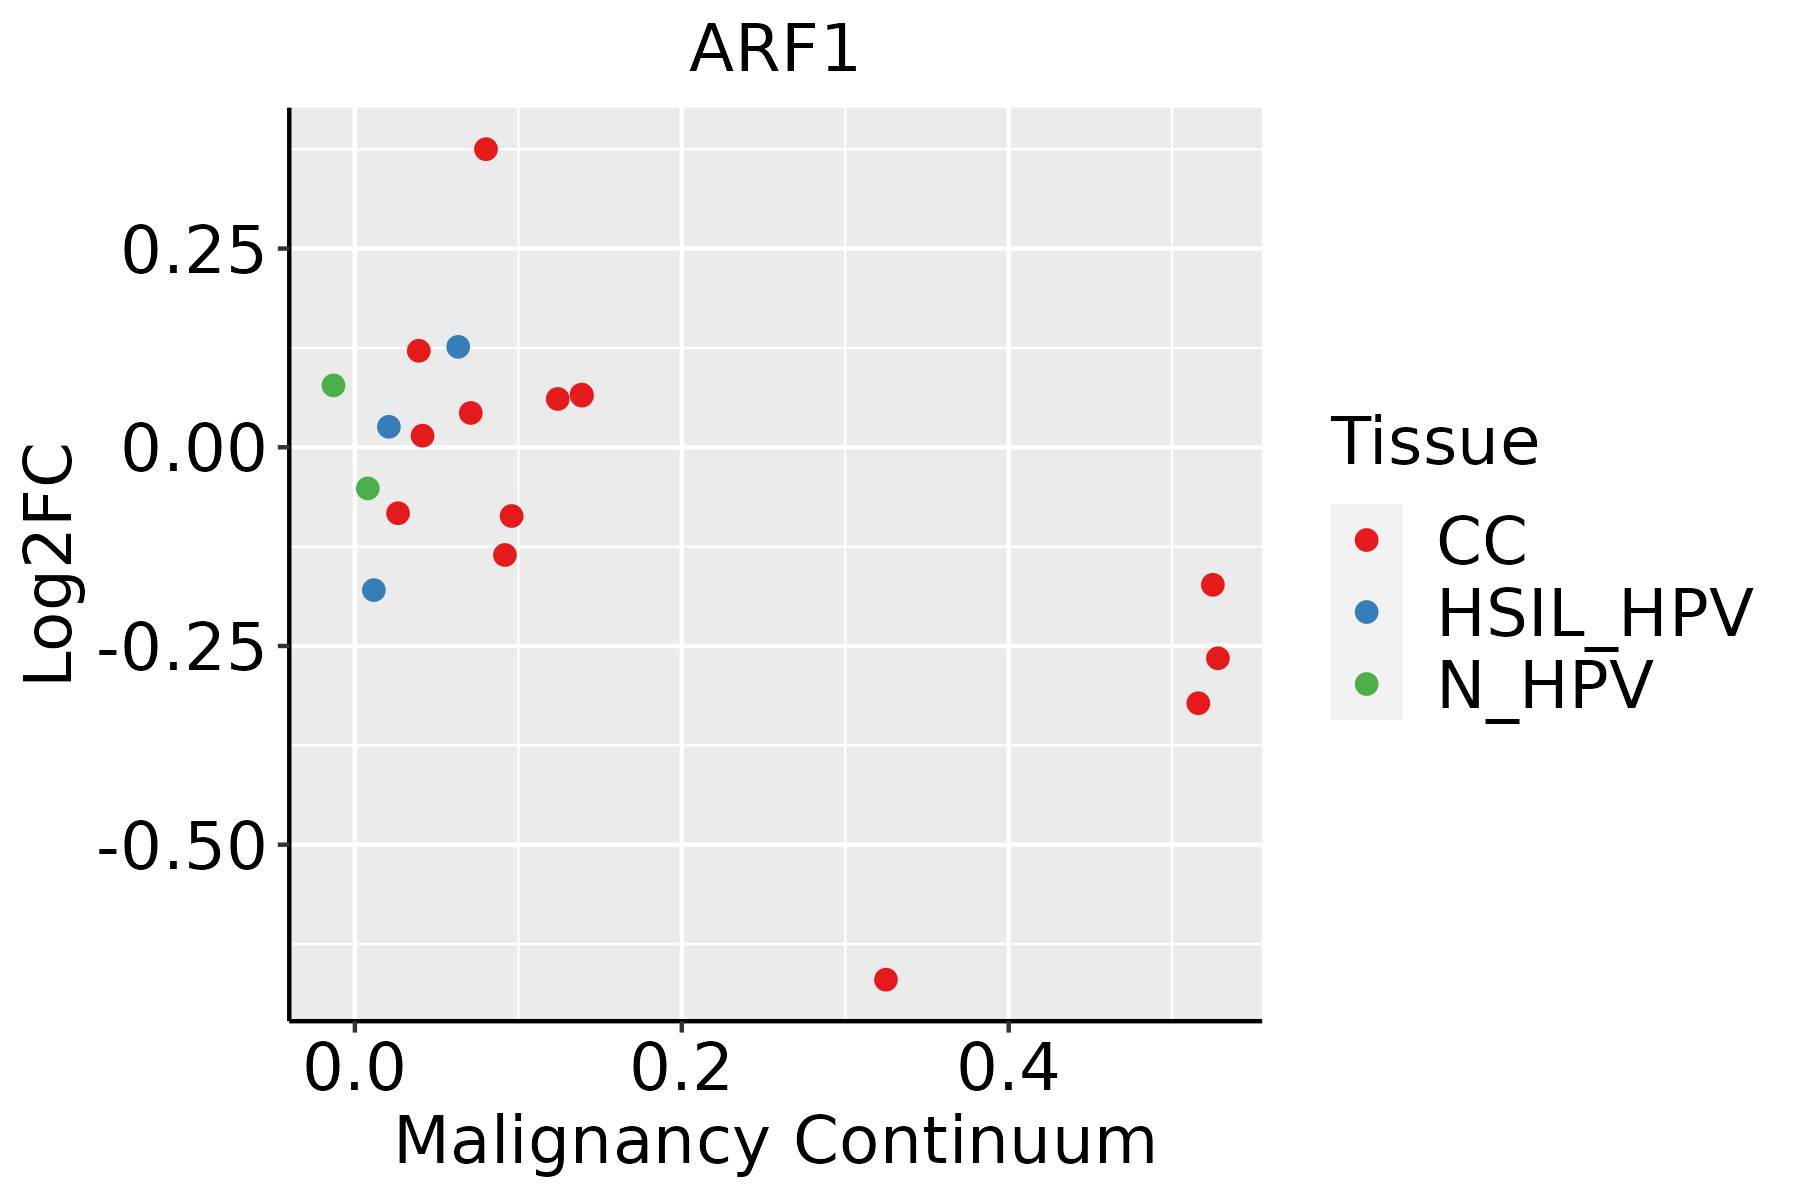 | CC: Cervix cancer |
| HSIL_HPV: HPV-infected high-grade squamous intraepithelial lesions | ||
| N_HPV: HPV-infected normal cervix | ||
| Colorectum (GSE201348) |  | FAP: Familial adenomatous polyposis |
| CRC: Colorectal cancer | ||
| Colorectum (HTA11) |  | AD: Adenomas |
| SER: Sessile serrated lesions | ||
| MSI-H: Microsatellite-high colorectal cancer | ||
| MSS: Microsatellite stable colorectal cancer | ||
| Endometrium | 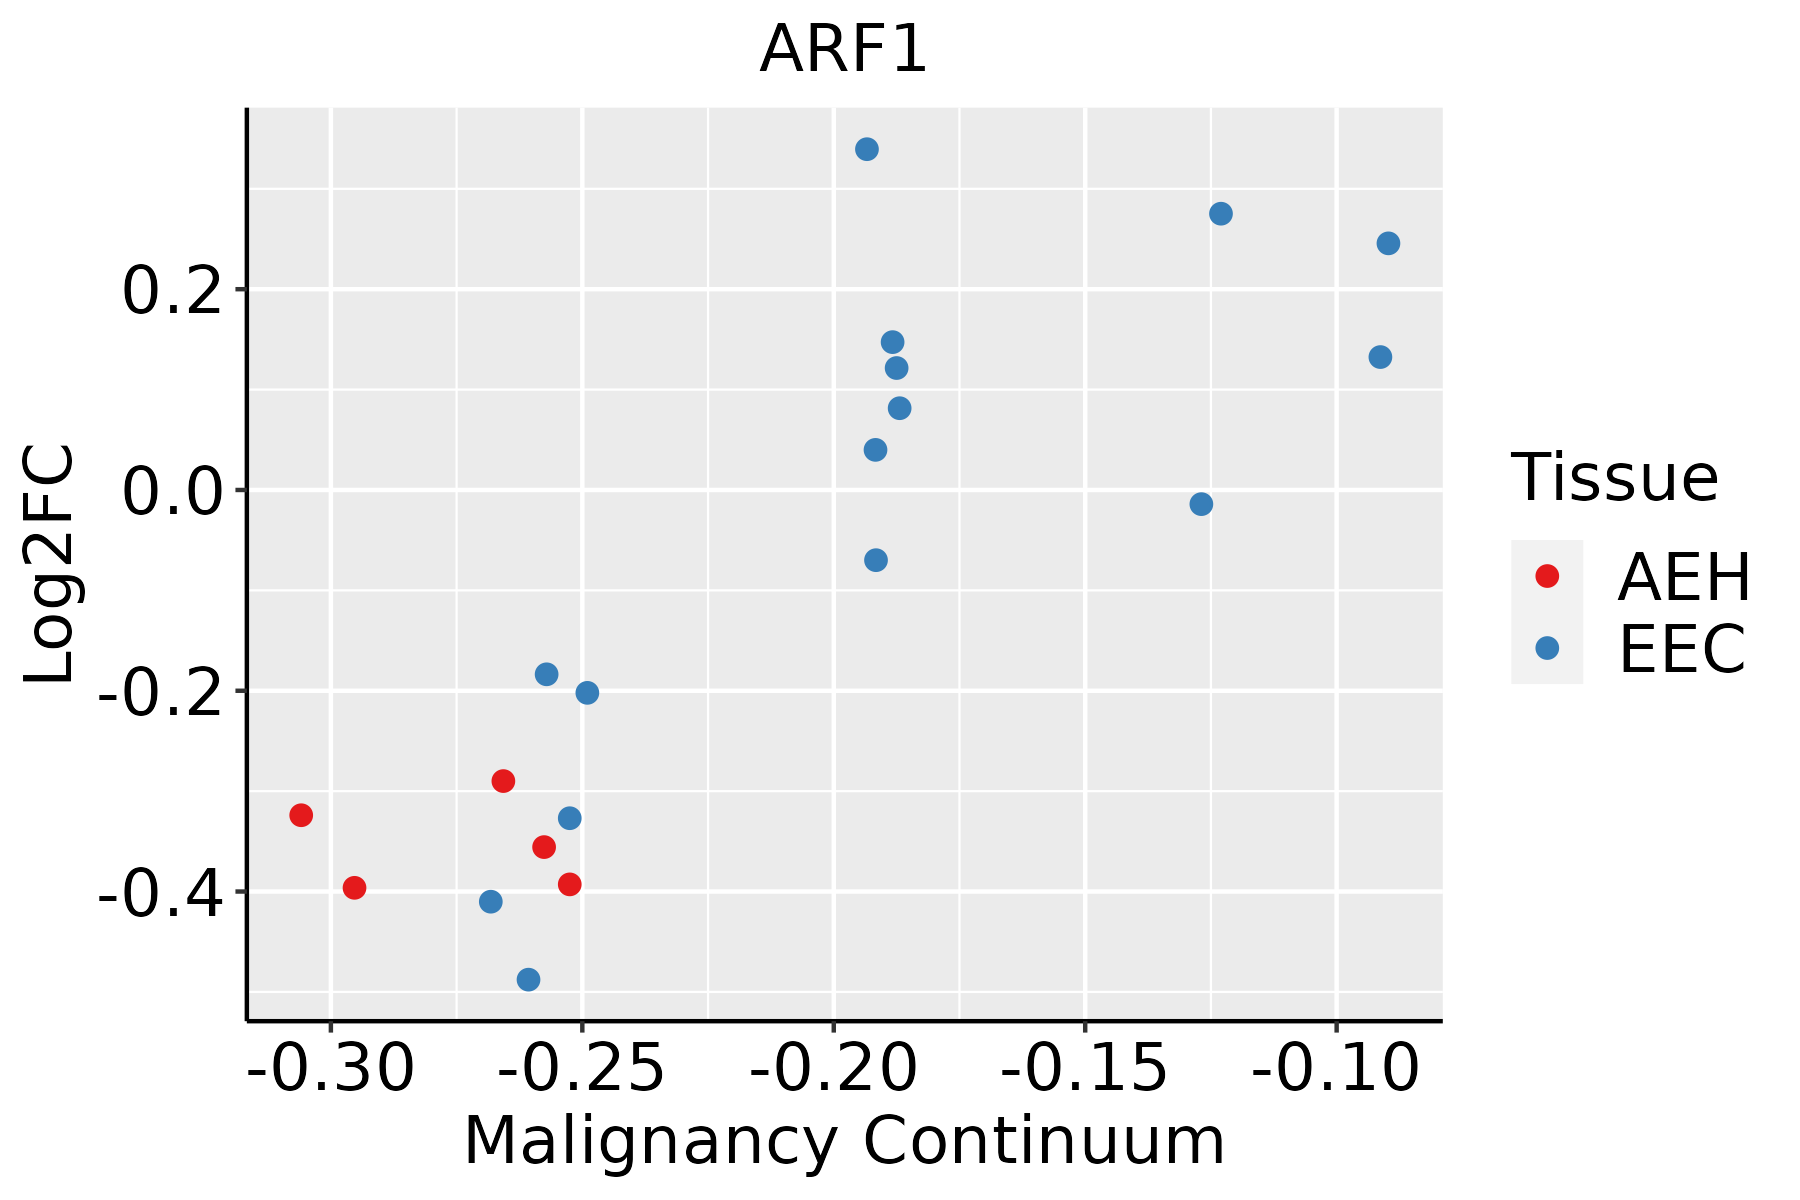 | AEH: Atypical endometrial hyperplasia |
| EEC: Endometrioid Cancer | ||
| Esophagus | 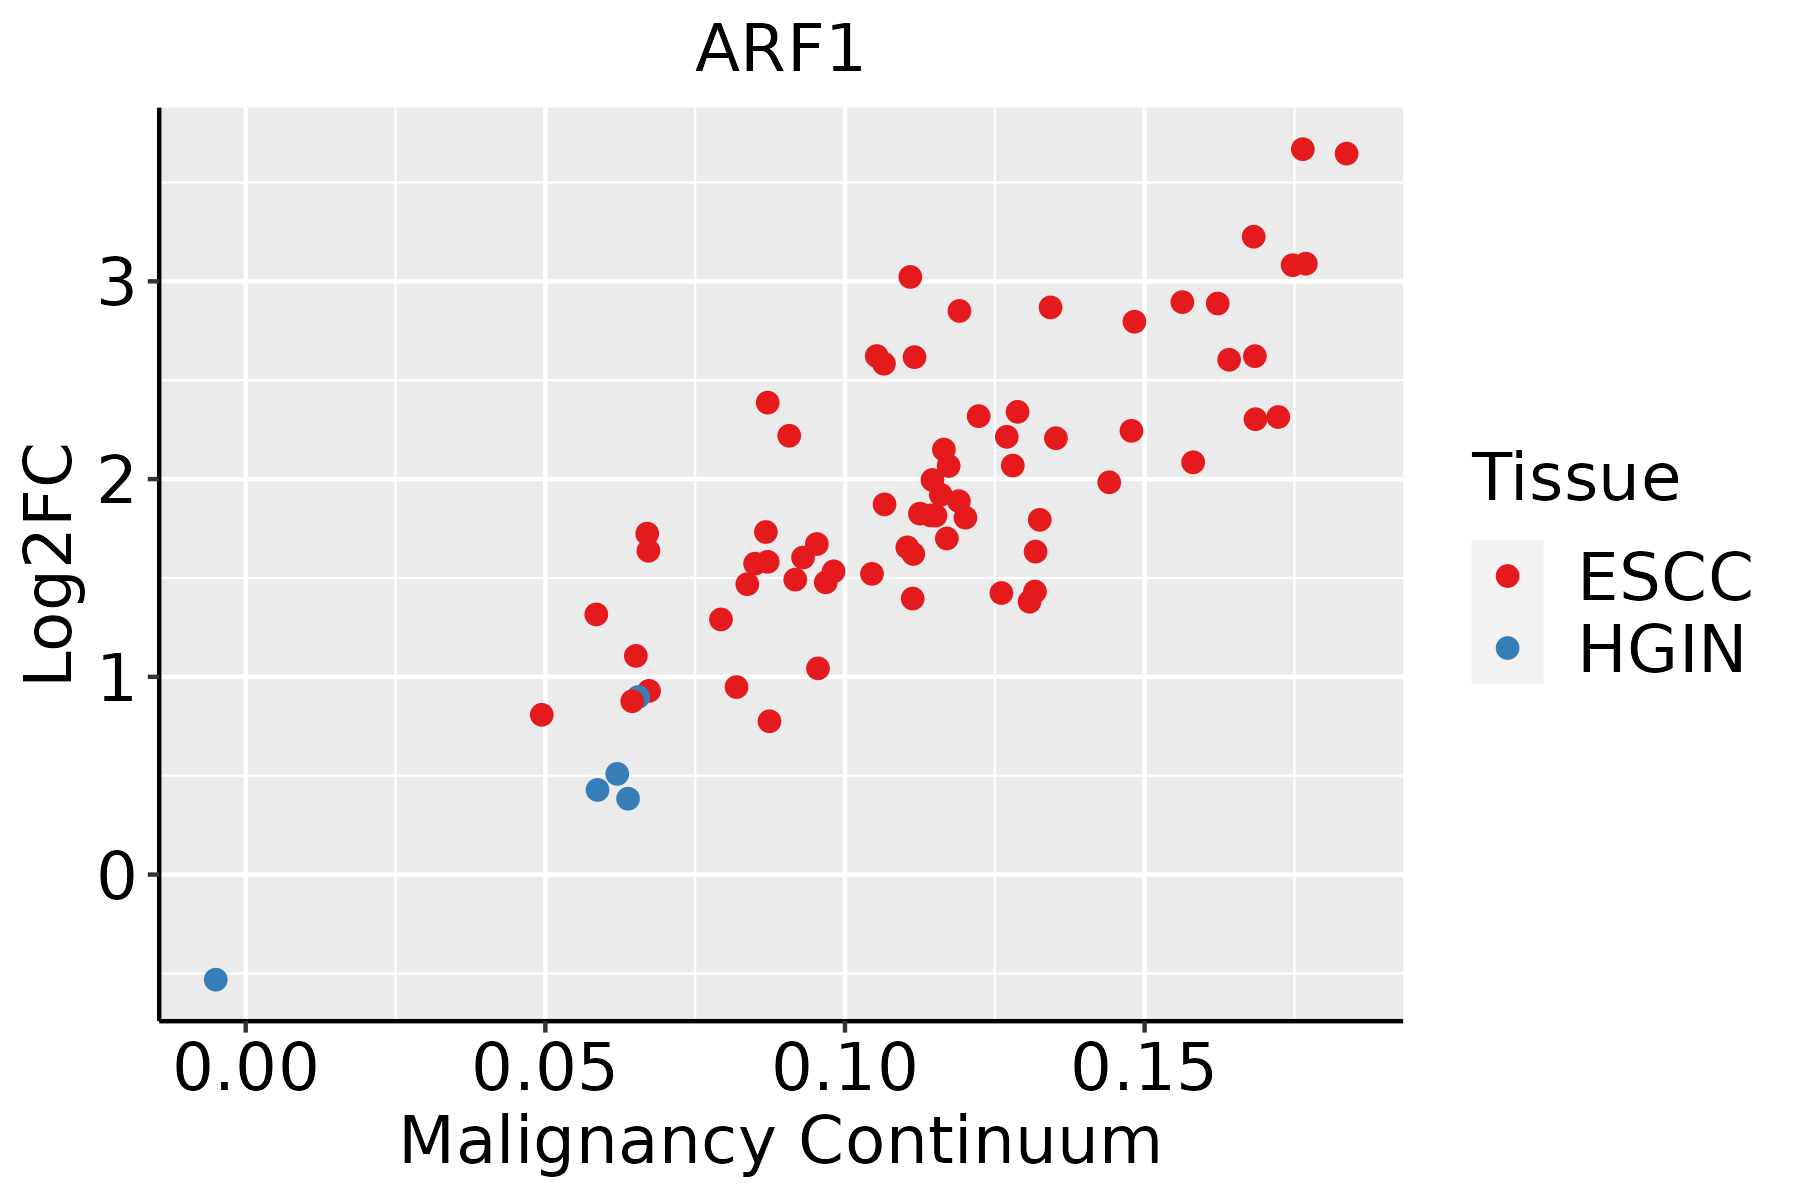 | ESCC: Esophageal squamous cell carcinoma |
| HGIN: High-grade intraepithelial neoplasias | ||
| LGIN: Low-grade intraepithelial neoplasias | ||
| Liver | 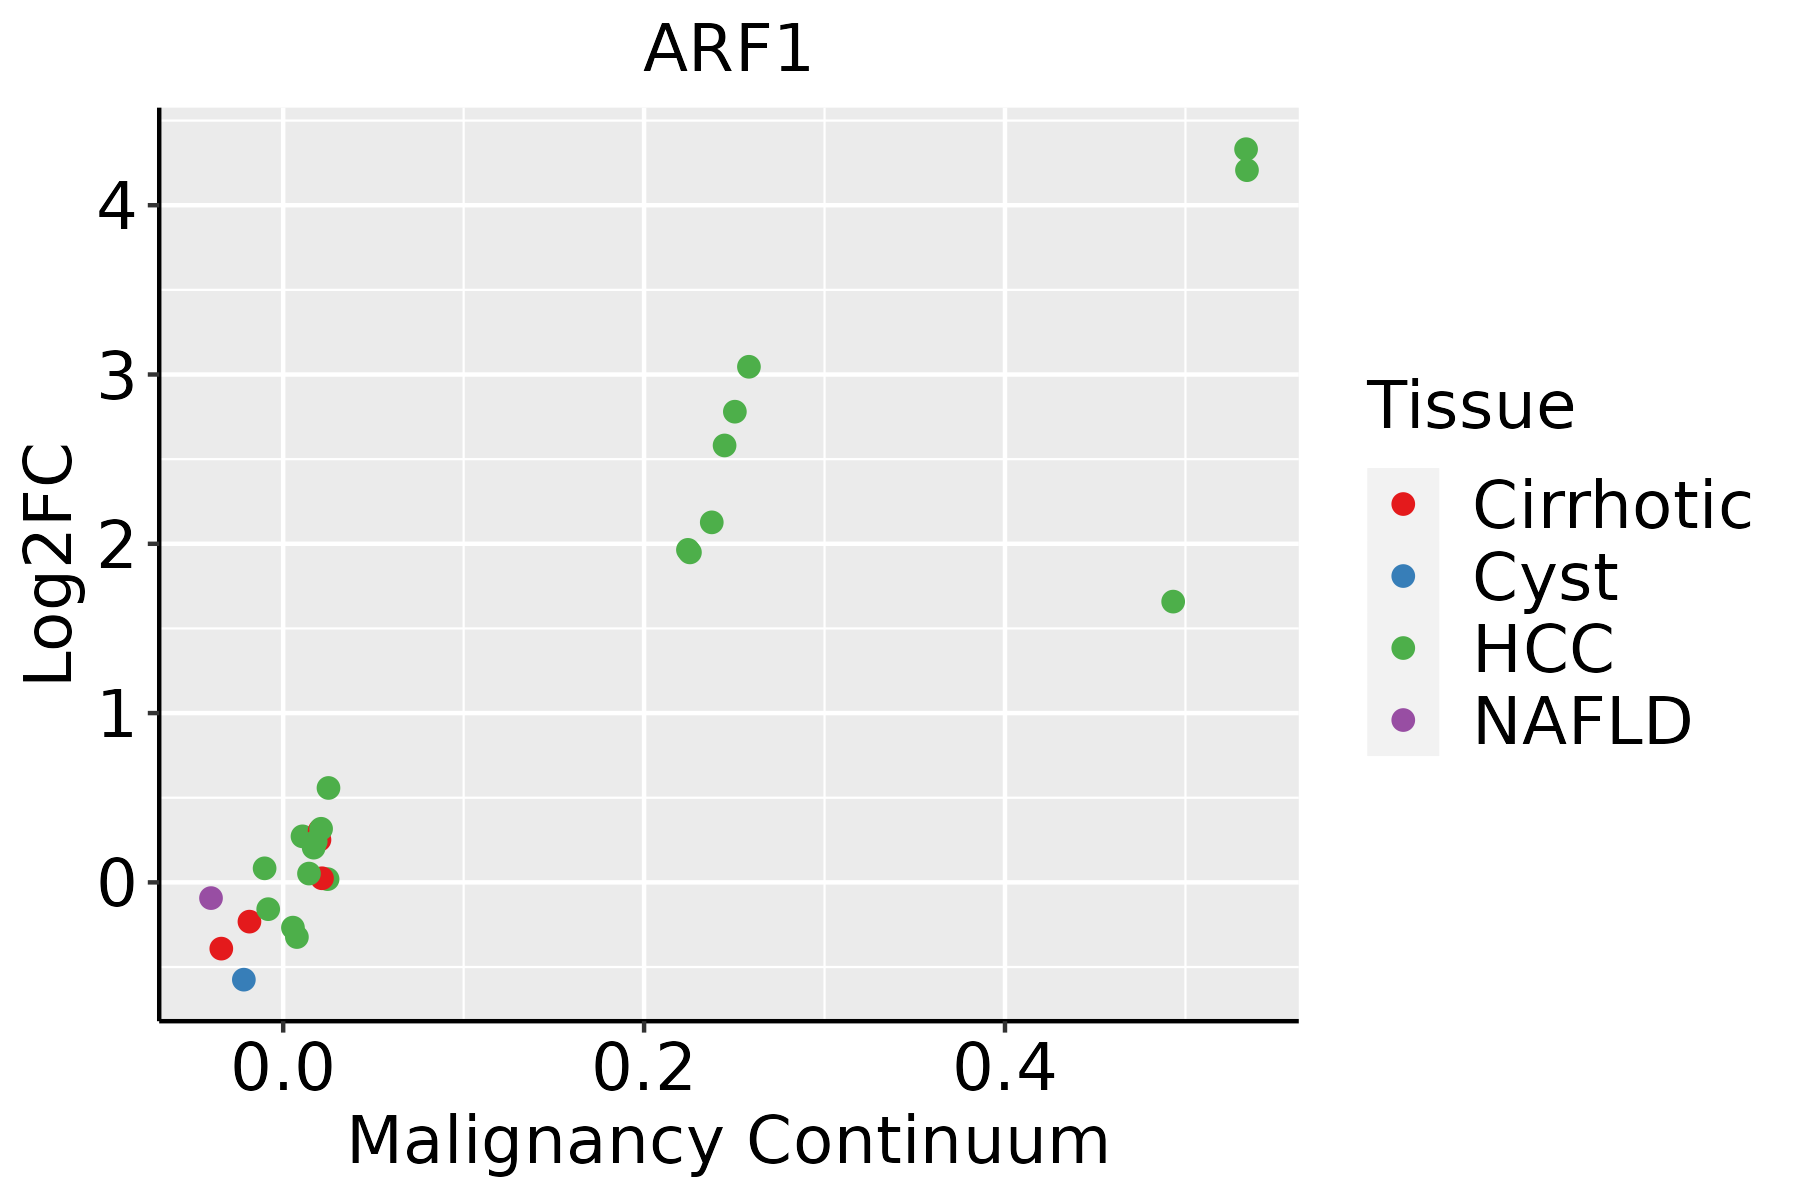 | HCC: Hepatocellular carcinoma |
| NAFLD: Non-alcoholic fatty liver disease | ||
| Oral Cavity | 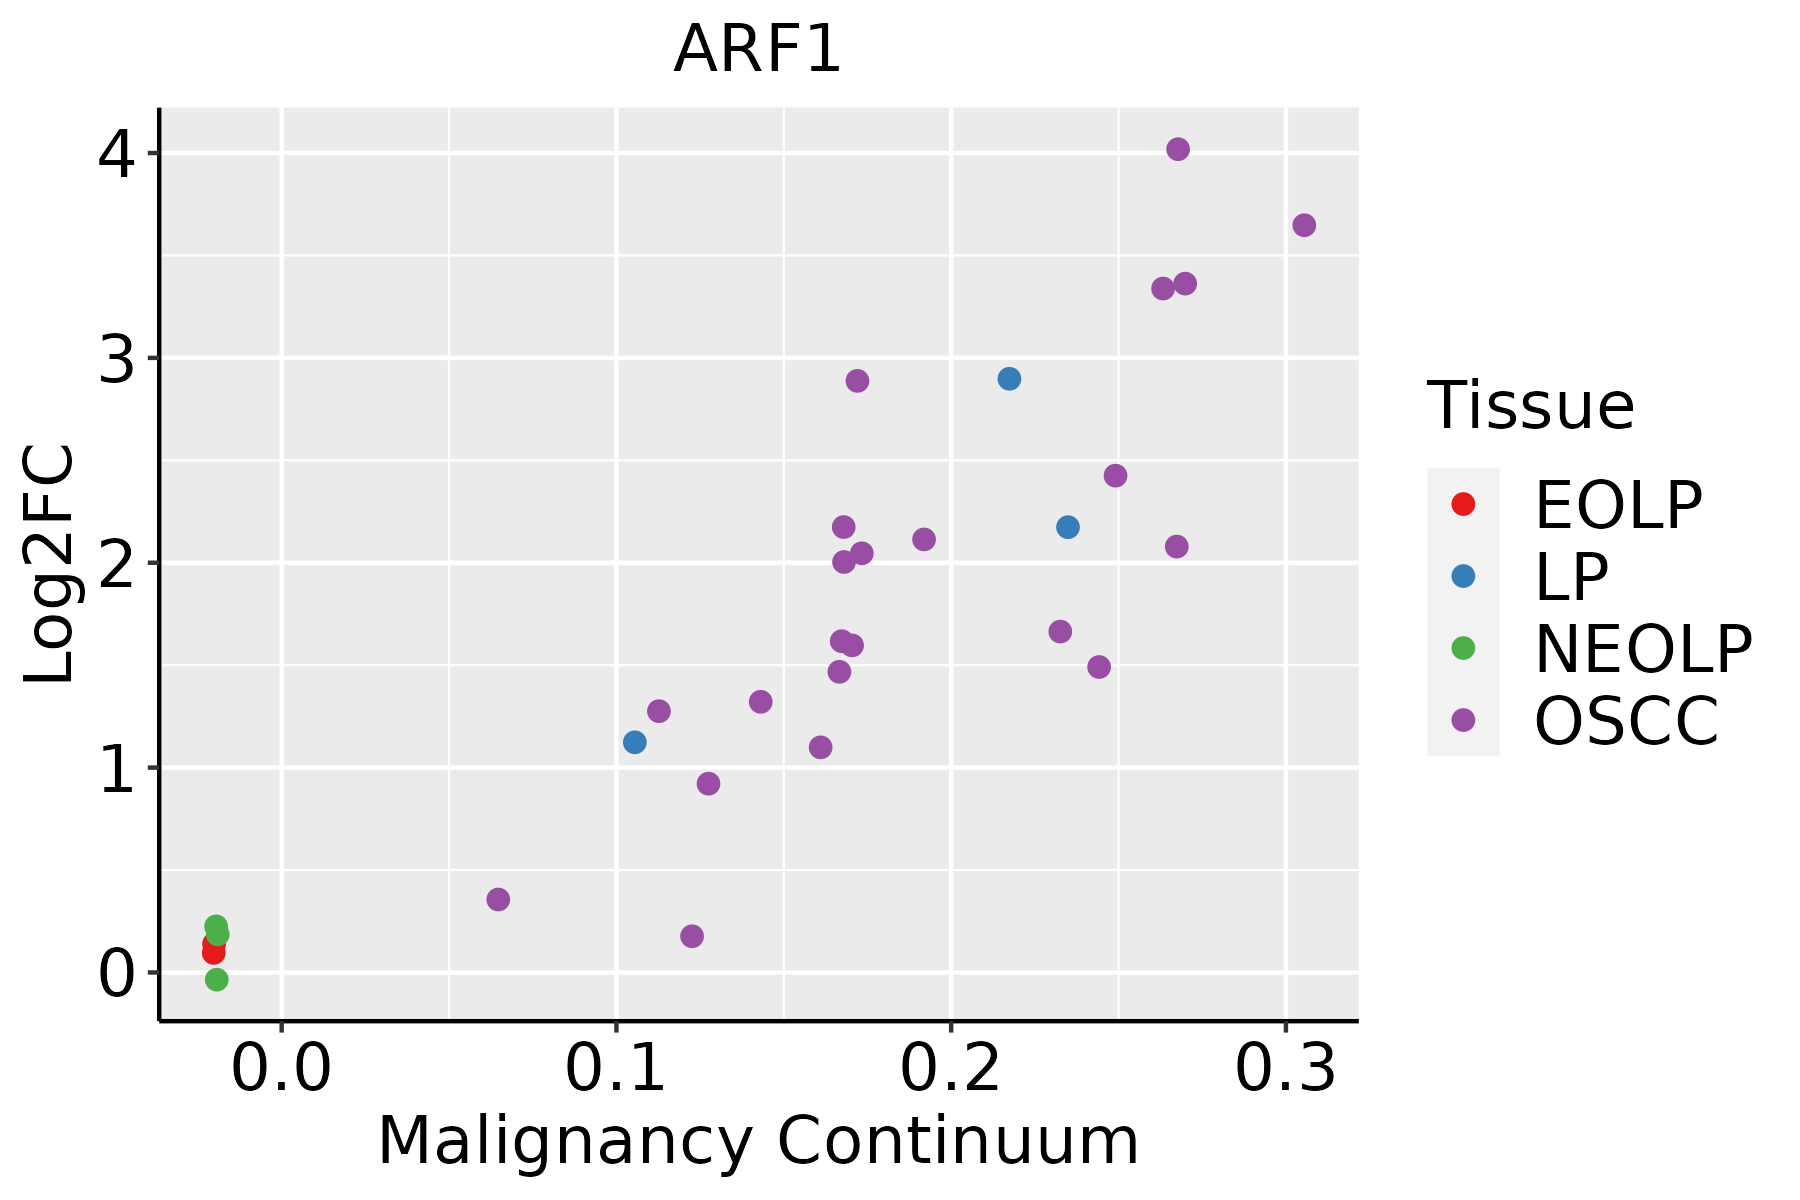 | EOLP: Erosive Oral lichen planus |
| LP: leukoplakia | ||
| NEOLP: Non-erosive oral lichen planus | ||
| OSCC: Oral squamous cell carcinoma | ||
| Prostate | 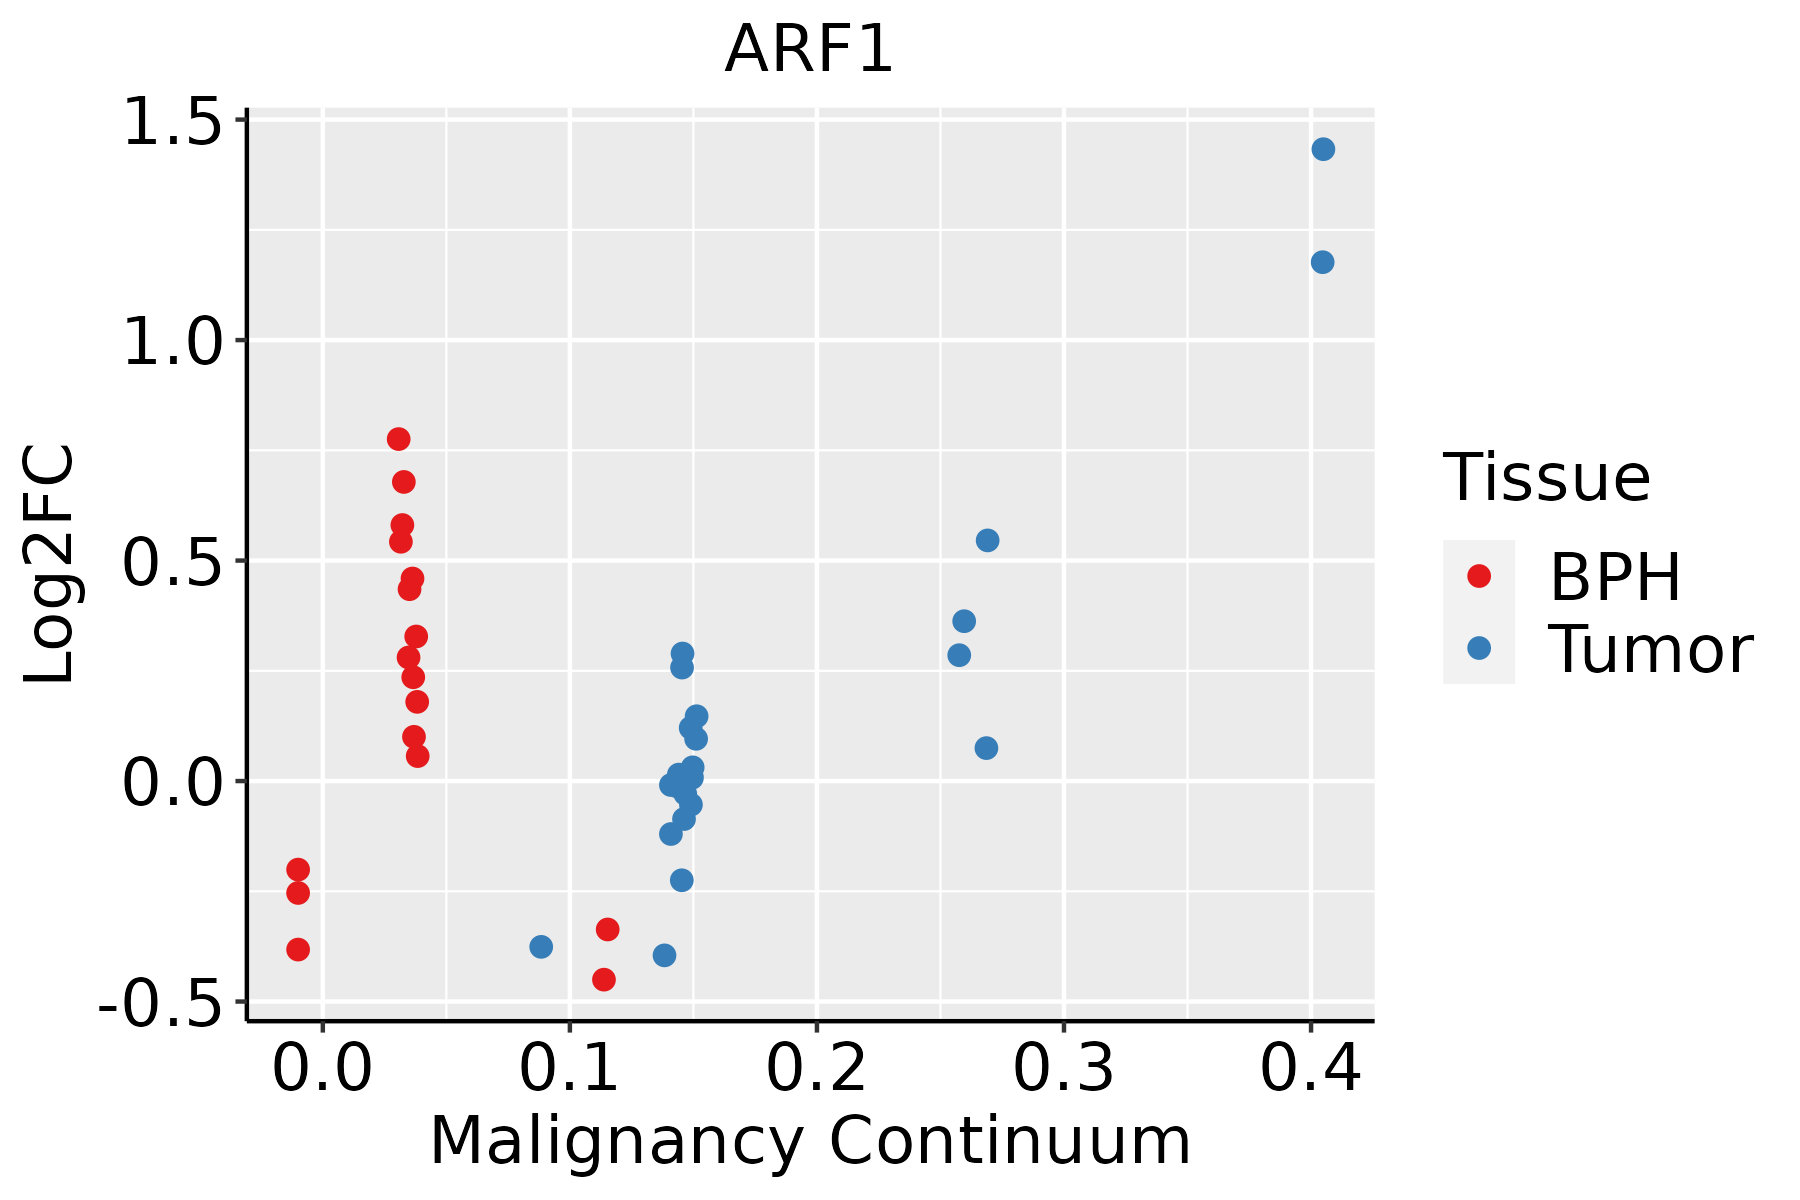 | BPH: Benign Prostatic Hyperplasia |
| Skin | 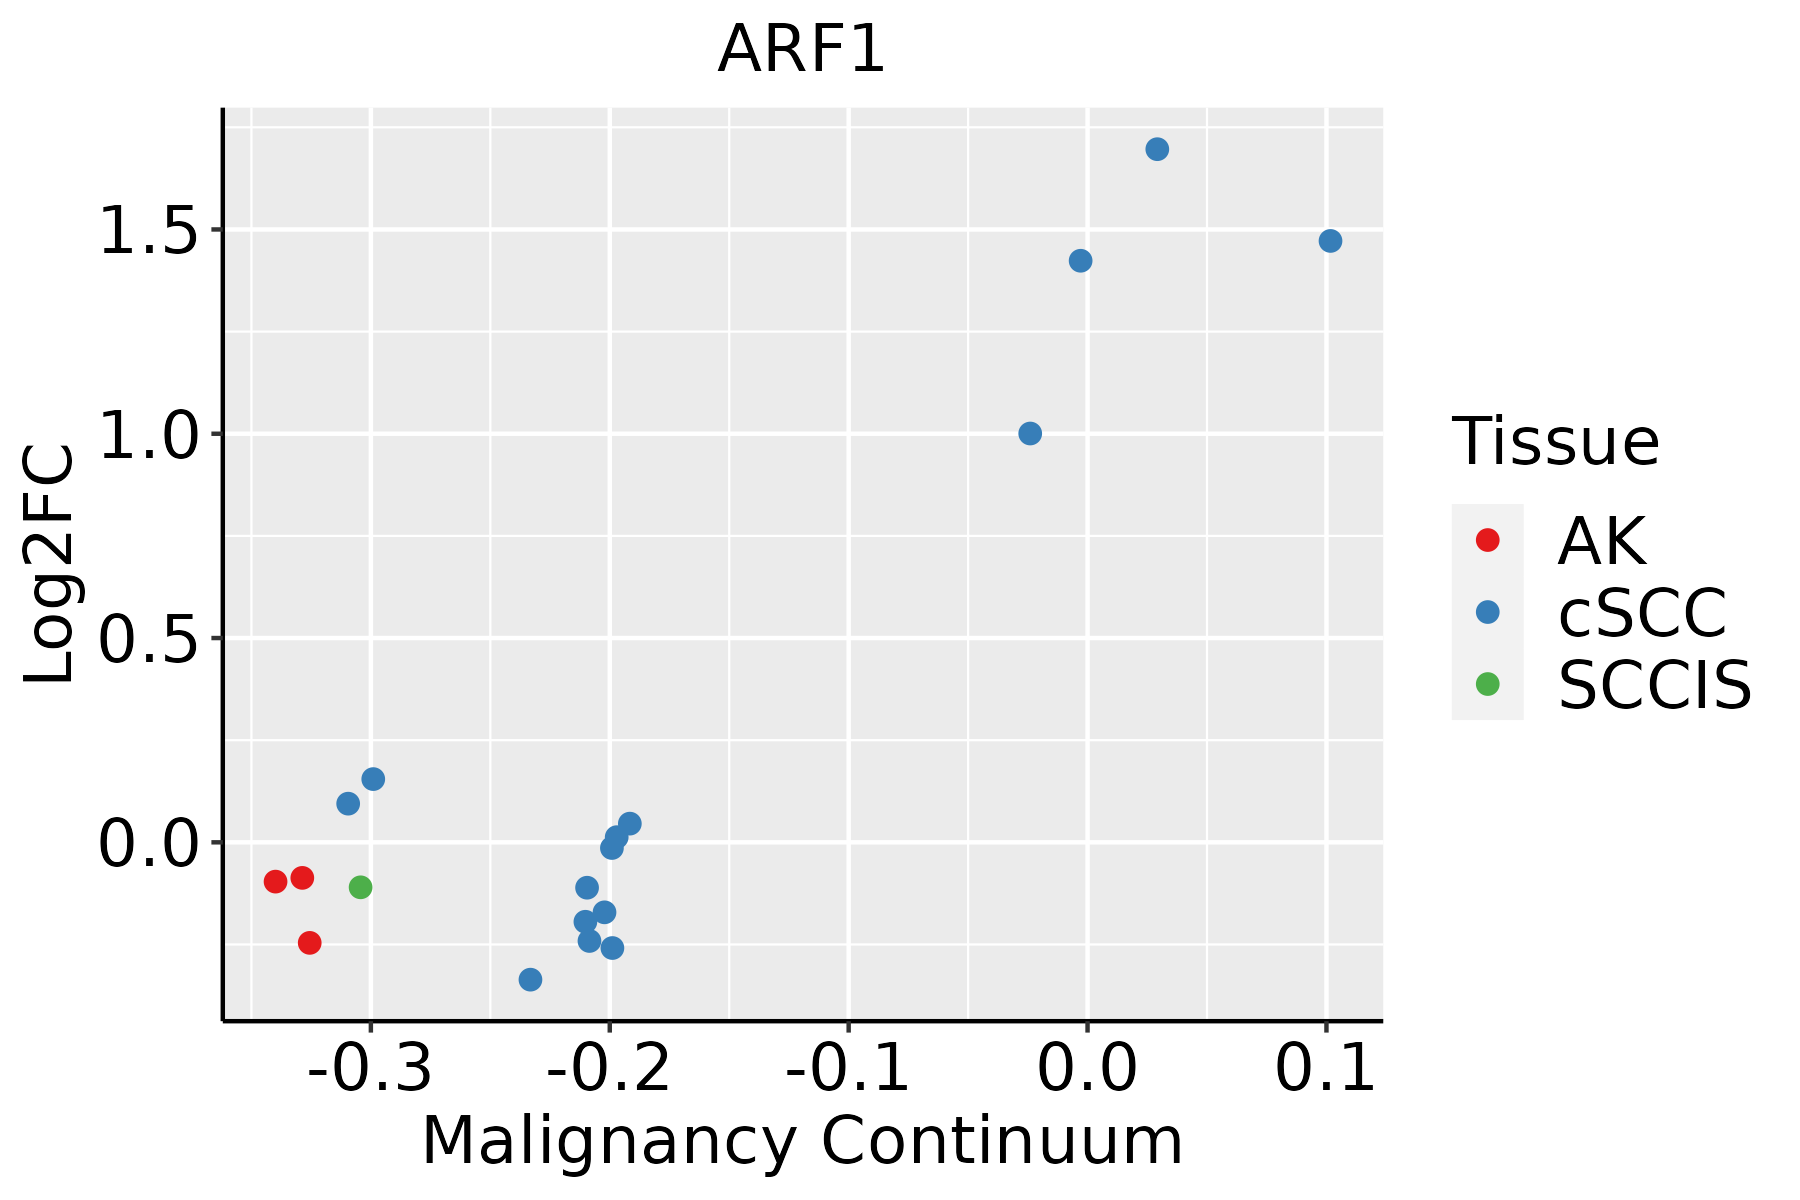 | AK: Actinic keratosis |
| cSCC: Cutaneous squamous cell carcinoma | ||
| SCCIS:squamous cell carcinoma in situ | ||
| Thyroid | 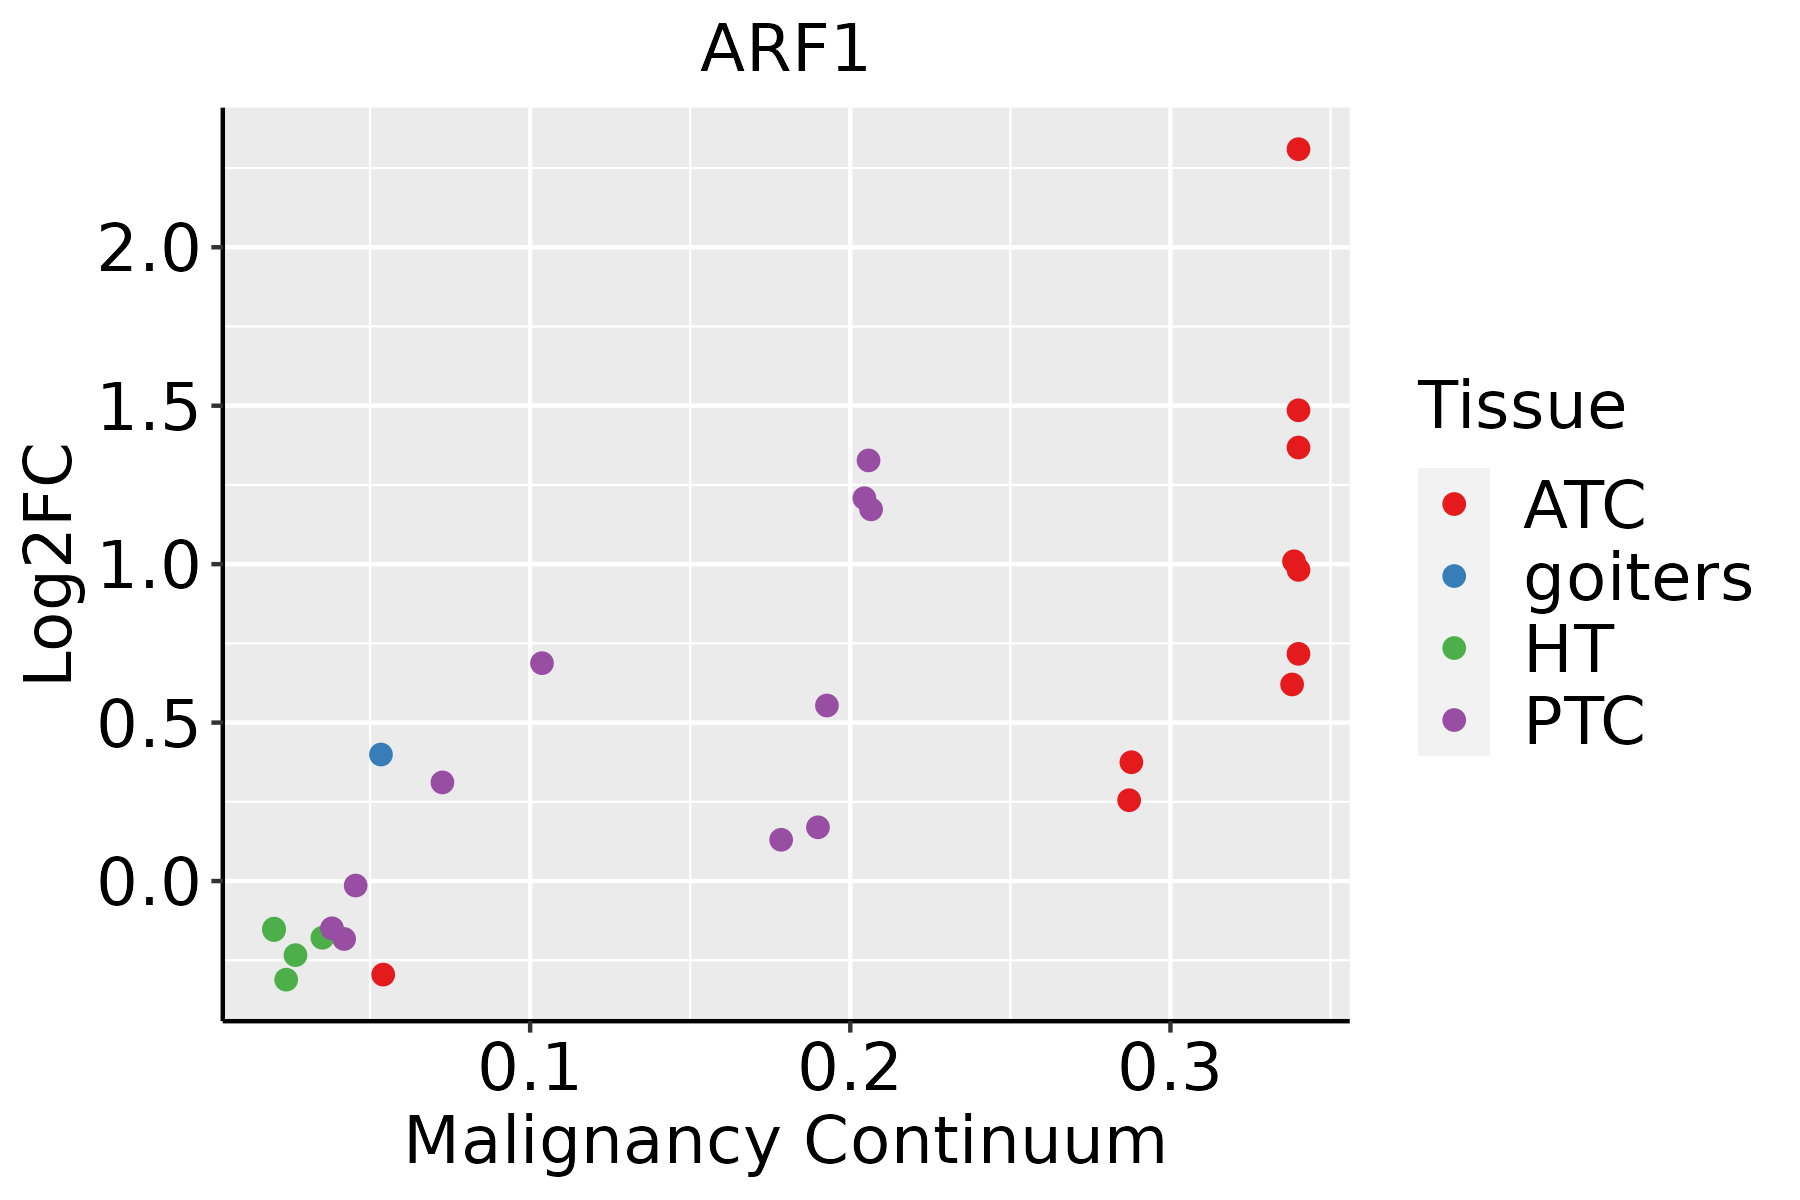 | ATC: Anaplastic thyroid cancer |
| HT: Hashimoto's thyroiditis | ||
| PTC: Papillary thyroid cancer |
| ∗log2FC in expression of this searched gene in stem-like cells from each diseased tissue sample relative to stem-like cells in normal samples in each tissue plotted against the malignancy continuum. Samples are colored based on if they are from different disease stage. |
Top |
Malignant transformation related pathway analysis |
| Find out the enriched GO biological processes and KEGG pathways involved in transition from healthy to precancer to cancer |
| Tissue | Disease Stage | Enriched GO biological Processes |
| Colorectum | AD |  |
| Colorectum | SER |  |
| Colorectum | MSS |  |
| Colorectum | MSI-H |  |
| Colorectum | FAP |  |
| ∗Top 15 enriched GO BP terms are showed in the bar plot of each disease state in each tissue. Each row represents a significant GO biological process which is colored according to the -log10(p.adjust). |
| Page: 1 2 3 4 5 6 7 8 9 |
| GO ID | Tissue | Disease Stage | Description | Gene Ratio | Bg Ratio | pvalue | p.adjust | Count |
| GO:00432549 | Breast | Precancer | regulation of protein-containing complex assembly | 50/1080 | 428/18723 | 1.63e-06 | 5.97e-05 | 50 |
| GO:00313349 | Breast | Precancer | positive regulation of protein-containing complex assembly | 33/1080 | 237/18723 | 2.39e-06 | 8.21e-05 | 33 |
| GO:19029059 | Breast | Precancer | positive regulation of supramolecular fiber organization | 28/1080 | 209/18723 | 2.79e-05 | 6.28e-04 | 28 |
| GO:19029039 | Breast | Precancer | regulation of supramolecular fiber organization | 42/1080 | 383/18723 | 4.92e-05 | 1.04e-03 | 42 |
| GO:19049519 | Breast | Precancer | positive regulation of establishment of protein localization | 36/1080 | 319/18723 | 9.30e-05 | 1.75e-03 | 36 |
| GO:00329709 | Breast | Precancer | regulation of actin filament-based process | 42/1080 | 397/18723 | 1.11e-04 | 2.01e-03 | 42 |
| GO:00514959 | Breast | Precancer | positive regulation of cytoskeleton organization | 28/1080 | 226/18723 | 1.13e-04 | 2.04e-03 | 28 |
| GO:00550767 | Breast | Precancer | transition metal ion homeostasis | 20/1080 | 138/18723 | 1.28e-04 | 2.24e-03 | 20 |
| GO:00069009 | Breast | Precancer | vesicle budding from membrane | 12/1080 | 61/18723 | 1.61e-04 | 2.69e-03 | 12 |
| GO:00070159 | Breast | Precancer | actin filament organization | 44/1080 | 442/18723 | 3.02e-04 | 4.35e-03 | 44 |
| GO:00469165 | Breast | Precancer | cellular transition metal ion homeostasis | 17/1080 | 115/18723 | 3.15e-04 | 4.49e-03 | 17 |
| GO:00192164 | Breast | Precancer | regulation of lipid metabolic process | 34/1080 | 331/18723 | 8.14e-04 | 9.55e-03 | 34 |
| GO:00329569 | Breast | Precancer | regulation of actin cytoskeleton organization | 36/1080 | 358/18723 | 8.56e-04 | 9.88e-03 | 36 |
| GO:00068986 | Breast | Precancer | receptor-mediated endocytosis | 27/1080 | 244/18723 | 9.01e-04 | 1.03e-02 | 27 |
| GO:00322739 | Breast | Precancer | positive regulation of protein polymerization | 18/1080 | 138/18723 | 9.85e-04 | 1.11e-02 | 18 |
| GO:00512229 | Breast | Precancer | positive regulation of protein transport | 31/1080 | 303/18723 | 1.44e-03 | 1.50e-02 | 31 |
| GO:01100539 | Breast | Precancer | regulation of actin filament organization | 29/1080 | 278/18723 | 1.50e-03 | 1.55e-02 | 29 |
| GO:00507086 | Breast | Precancer | regulation of protein secretion | 28/1080 | 268/18723 | 1.76e-03 | 1.74e-02 | 28 |
| GO:00458076 | Breast | Precancer | positive regulation of endocytosis | 14/1080 | 100/18723 | 1.77e-03 | 1.74e-02 | 14 |
| GO:00316235 | Breast | Precancer | receptor internalization | 15/1080 | 113/18723 | 2.11e-03 | 2.00e-02 | 15 |
| Page: 1 2 3 4 5 6 7 8 9 10 11 12 13 14 15 16 17 18 19 20 21 22 23 24 25 26 27 28 29 30 31 32 33 34 35 36 37 38 39 40 41 42 43 44 45 46 47 48 49 50 51 52 53 54 55 56 57 58 59 60 61 62 63 64 65 66 67 68 |
| Pathway ID | Tissue | Disease Stage | Description | Gene Ratio | Bg Ratio | pvalue | p.adjust | qvalue | Count |
| hsa0513218 | Breast | Precancer | Salmonella infection | 49/684 | 249/8465 | 2.92e-09 | 6.15e-08 | 4.71e-08 | 49 |
| hsa0513414 | Breast | Precancer | Legionellosis | 19/684 | 57/8465 | 4.62e-08 | 9.12e-07 | 6.98e-07 | 19 |
| hsa0513018 | Breast | Precancer | Pathogenic Escherichia coli infection | 38/684 | 197/8465 | 3.12e-07 | 5.81e-06 | 4.45e-06 | 38 |
| hsa0513118 | Breast | Precancer | Shigellosis | 44/684 | 247/8465 | 3.91e-07 | 6.86e-06 | 5.26e-06 | 44 |
| hsa0511014 | Breast | Precancer | Vibrio cholerae infection | 14/684 | 50/8465 | 2.67e-05 | 2.64e-04 | 2.02e-04 | 14 |
| hsa0513219 | Breast | Precancer | Salmonella infection | 49/684 | 249/8465 | 2.92e-09 | 6.15e-08 | 4.71e-08 | 49 |
| hsa0513415 | Breast | Precancer | Legionellosis | 19/684 | 57/8465 | 4.62e-08 | 9.12e-07 | 6.98e-07 | 19 |
| hsa0513019 | Breast | Precancer | Pathogenic Escherichia coli infection | 38/684 | 197/8465 | 3.12e-07 | 5.81e-06 | 4.45e-06 | 38 |
| hsa0513119 | Breast | Precancer | Shigellosis | 44/684 | 247/8465 | 3.91e-07 | 6.86e-06 | 5.26e-06 | 44 |
| hsa0511015 | Breast | Precancer | Vibrio cholerae infection | 14/684 | 50/8465 | 2.67e-05 | 2.64e-04 | 2.02e-04 | 14 |
| hsa0513224 | Breast | IDC | Salmonella infection | 55/867 | 249/8465 | 2.07e-08 | 4.49e-07 | 3.36e-07 | 55 |
| hsa0513422 | Breast | IDC | Legionellosis | 19/867 | 57/8465 | 1.89e-06 | 3.07e-05 | 2.29e-05 | 19 |
| hsa0513024 | Breast | IDC | Pathogenic Escherichia coli infection | 42/867 | 197/8465 | 2.66e-06 | 3.92e-05 | 2.94e-05 | 42 |
| hsa0511022 | Breast | IDC | Vibrio cholerae infection | 17/867 | 50/8465 | 4.82e-06 | 6.82e-05 | 5.10e-05 | 17 |
| hsa0513124 | Breast | IDC | Shigellosis | 47/867 | 247/8465 | 1.78e-05 | 2.00e-04 | 1.49e-04 | 47 |
| hsa0513234 | Breast | IDC | Salmonella infection | 55/867 | 249/8465 | 2.07e-08 | 4.49e-07 | 3.36e-07 | 55 |
| hsa0513432 | Breast | IDC | Legionellosis | 19/867 | 57/8465 | 1.89e-06 | 3.07e-05 | 2.29e-05 | 19 |
| hsa0513034 | Breast | IDC | Pathogenic Escherichia coli infection | 42/867 | 197/8465 | 2.66e-06 | 3.92e-05 | 2.94e-05 | 42 |
| hsa0511032 | Breast | IDC | Vibrio cholerae infection | 17/867 | 50/8465 | 4.82e-06 | 6.82e-05 | 5.10e-05 | 17 |
| hsa0513134 | Breast | IDC | Shigellosis | 47/867 | 247/8465 | 1.78e-05 | 2.00e-04 | 1.49e-04 | 47 |
| Page: 1 2 3 4 5 6 7 8 9 10 11 |
Top |
Cell-cell communication analysis |
| Identification of potential cell-cell interactions between two cell types and their ligand-receptor pairs for different disease states |
| Ligand | Receptor | LRpair | Pathway | Tissue | Disease Stage |
| Page: 1 |
Top |
Single-cell gene regulatory network inference analysis |
| Find out the significant the regulons (TFs) and the target genes of each regulon across cell types for different disease states |
| TF | Cell Type | Tissue | Disease Stage | Target Gene | RSS | Regulon Activity |
| ∗The dot plots of a searched regulon are shown for all cell subpopulations in each disease state of each tissue based on the regulon specific score inferred using pySCENIC and by calculating the average expression. |
| Page: 1 |
Top |
Somatic mutation of malignant transformation related genes |
| Annotation of somatic variants for genes involved in malignant transformation |
| Hugo Symbol | Variant Class | Variant Classification | dbSNP RS | HGVSc | HGVSp | HGVSp Short | SWISSPROT | BIOTYPE | SIFT | PolyPhen | Tumor Sample Barcode | Tissue | Histology | Sex | Age | Stage | Therapy Types | Drugs | Outcome |
| ARF1 | SNV | Missense_Mutation | c.446N>A | p.Arg149His | p.R149H | P84077 | protein_coding | tolerated_low_confidence(0.16) | benign(0.013) | TCGA-AR-A1AL-01 | Breast | breast invasive carcinoma | Female | <65 | III/IV | Hormone Therapy | anastrozole | SD | |
| ARF1 | SNV | Missense_Mutation | novel | c.409N>A | p.Ala137Thr | p.A137T | P84077 | protein_coding | tolerated_low_confidence(0.14) | benign(0.003) | TCGA-LL-A5YP-01 | Breast | breast invasive carcinoma | Female | <65 | I/II | Chemotherapy | cytoxan | SD |
| ARF1 | SNV | Missense_Mutation | c.55C>T | p.Arg19Cys | p.R19C | P84077 | protein_coding | tolerated_low_confidence(0.06) | possibly_damaging(0.591) | TCGA-2W-A8YY-01 | Cervix | cervical & endocervical cancer | Female | <65 | I/II | Chemotherapy | cisplatin | CR | |
| ARF1 | SNV | Missense_Mutation | novel | c.452G>A | p.Arg151Lys | p.R151K | P84077 | protein_coding | deleterious_low_confidence(0.04) | benign(0.097) | TCGA-2W-A8YY-01 | Cervix | cervical & endocervical cancer | Female | <65 | I/II | Chemotherapy | cisplatin | CR |
| ARF1 | SNV | Missense_Mutation | novel | c.224N>A | p.Arg75Gln | p.R75Q | P84077 | protein_coding | deleterious_low_confidence(0.04) | possibly_damaging(0.604) | TCGA-AA-3984-01 | Colorectum | colon adenocarcinoma | Female | <65 | I/II | Unknown | Unknown | SD |
| ARF1 | SNV | Missense_Mutation | c.11T>G | p.Ile4Ser | p.I4S | P84077 | protein_coding | tolerated_low_confidence(0.59) | benign(0.003) | TCGA-AZ-4615-01 | Colorectum | colon adenocarcinoma | Male | >=65 | III/IV | Chemotherapy | xeloda | PD | |
| ARF1 | SNV | Missense_Mutation | c.377N>G | p.Asn126Ser | p.N126S | P84077 | protein_coding | deleterious_low_confidence(0.04) | probably_damaging(0.987) | TCGA-NH-A5IV-01 | Colorectum | colon adenocarcinoma | Female | >=65 | I/II | Unknown | Unknown | SD | |
| ARF1 | SNV | Missense_Mutation | novel | c.451A>G | p.Arg151Gly | p.R151G | P84077 | protein_coding | deleterious_low_confidence(0.01) | possibly_damaging(0.873) | TCGA-F5-6814-01 | Colorectum | rectum adenocarcinoma | Male | <65 | I/II | Unknown | Unknown | SD |
| ARF1 | insertion | Frame_Shift_Ins | novel | c.48dupA | p.Glu17ArgfsTer22 | p.E17Rfs*22 | P84077 | protein_coding | TCGA-CM-4743-01 | Colorectum | colon adenocarcinoma | Male | >=65 | I/II | Chemotherapy | capecitabine | SD | ||
| ARF1 | SNV | Missense_Mutation | novel | c.397N>A | p.Ala133Thr | p.A133T | P84077 | protein_coding | deleterious_low_confidence(0.02) | benign(0.158) | TCGA-A5-A0G2-01 | Endometrium | uterine corpus endometrioid carcinoma | Female | <65 | III/IV | Unknown | Unknown | SD |
| Page: 1 2 3 4 |
Top |
Related drugs of malignant transformation related genes |
| Identification of chemicals and drugs interact with genes involved in malignant transfromation |
| (DGIdb 4.0) |
| Entrez ID | Symbol | Category | Interaction Types | Drug Claim Name | Drug Name | PMIDs |
| Page: 1 |

Copyright 2023-Present -The University of Texas Health Science Center at Houston |