
|
|||||
|
 | |
| |
| |
| |
| |
| |
|
Gene: ARAP2 |
Gene summary for ARAP2 |
| Gene information | Species | Human | Gene symbol | ARAP2 | Gene ID | 116984 |
| Gene name | ArfGAP with RhoGAP domain, ankyrin repeat and PH domain 2 | |
| Gene Alias | CENTD1 | |
| Cytomap | 4p14 | |
| Gene Type | protein-coding | GO ID | GO:0007154 | UniProtAcc | A7E2A5 |
Top |
Malignant transformation analysis |
| Identification of the aberrant gene expression in precancerous and cancerous lesions by comparing the gene expression of stem-like cells in diseased tissues with normal stem cells |
| Entrez ID | Symbol | Replicates | Species | Organ | Tissue | Adj P-value | Log2FC | Malignancy |
| 116984 | ARAP2 | HTA11_3410_2000001011 | Human | Colorectum | AD | 3.33e-09 | -4.43e-01 | 0.0155 |
| 116984 | ARAP2 | HTA11_3361_2000001011 | Human | Colorectum | AD | 9.67e-06 | -4.81e-01 | -0.1207 |
| 116984 | ARAP2 | HTA11_696_2000001011 | Human | Colorectum | AD | 6.50e-04 | -3.81e-01 | -0.1464 |
| 116984 | ARAP2 | HTA11_866_2000001011 | Human | Colorectum | AD | 7.04e-04 | -3.39e-01 | -0.1001 |
| 116984 | ARAP2 | HTA11_5212_2000001011 | Human | Colorectum | AD | 4.93e-02 | -5.30e-01 | -0.2061 |
| 116984 | ARAP2 | HTA11_866_3004761011 | Human | Colorectum | AD | 7.57e-06 | -4.13e-01 | 0.096 |
| 116984 | ARAP2 | HTA11_10711_2000001011 | Human | Colorectum | AD | 2.22e-02 | -4.11e-01 | 0.0338 |
| 116984 | ARAP2 | HTA11_7696_3000711011 | Human | Colorectum | AD | 4.60e-10 | -4.49e-01 | 0.0674 |
| 116984 | ARAP2 | HTA11_99999971662_82457 | Human | Colorectum | MSS | 1.94e-04 | -3.86e-01 | 0.3859 |
| 116984 | ARAP2 | HTA11_99999974143_84620 | Human | Colorectum | MSS | 1.98e-04 | -3.90e-01 | 0.3005 |
| 116984 | ARAP2 | A015-C-203 | Human | Colorectum | FAP | 3.45e-14 | -2.00e-01 | -0.1294 |
| 116984 | ARAP2 | A002-C-201 | Human | Colorectum | FAP | 2.33e-05 | -9.87e-02 | 0.0324 |
| 116984 | ARAP2 | A001-C-119 | Human | Colorectum | FAP | 2.04e-02 | -1.78e-01 | -0.1557 |
| 116984 | ARAP2 | A001-C-108 | Human | Colorectum | FAP | 6.48e-07 | -2.73e-02 | -0.0272 |
| 116984 | ARAP2 | A002-C-205 | Human | Colorectum | FAP | 1.44e-12 | -1.74e-01 | -0.1236 |
| 116984 | ARAP2 | A015-C-006 | Human | Colorectum | FAP | 6.83e-09 | -1.17e-01 | -0.0994 |
| 116984 | ARAP2 | A015-C-106 | Human | Colorectum | FAP | 3.41e-03 | -4.89e-02 | -0.0511 |
| 116984 | ARAP2 | A002-C-114 | Human | Colorectum | FAP | 3.75e-09 | -6.73e-03 | -0.1561 |
| 116984 | ARAP2 | A015-C-104 | Human | Colorectum | FAP | 2.54e-15 | -7.75e-02 | -0.1899 |
| 116984 | ARAP2 | A001-C-014 | Human | Colorectum | FAP | 2.20e-04 | 3.26e-02 | 0.0135 |
| Page: 1 2 3 4 5 6 7 |
| Tissue | Expression Dynamics | Abbreviation |
| Colorectum (GSE201348) |  | FAP: Familial adenomatous polyposis |
| CRC: Colorectal cancer | ||
| Colorectum (HTA11) | 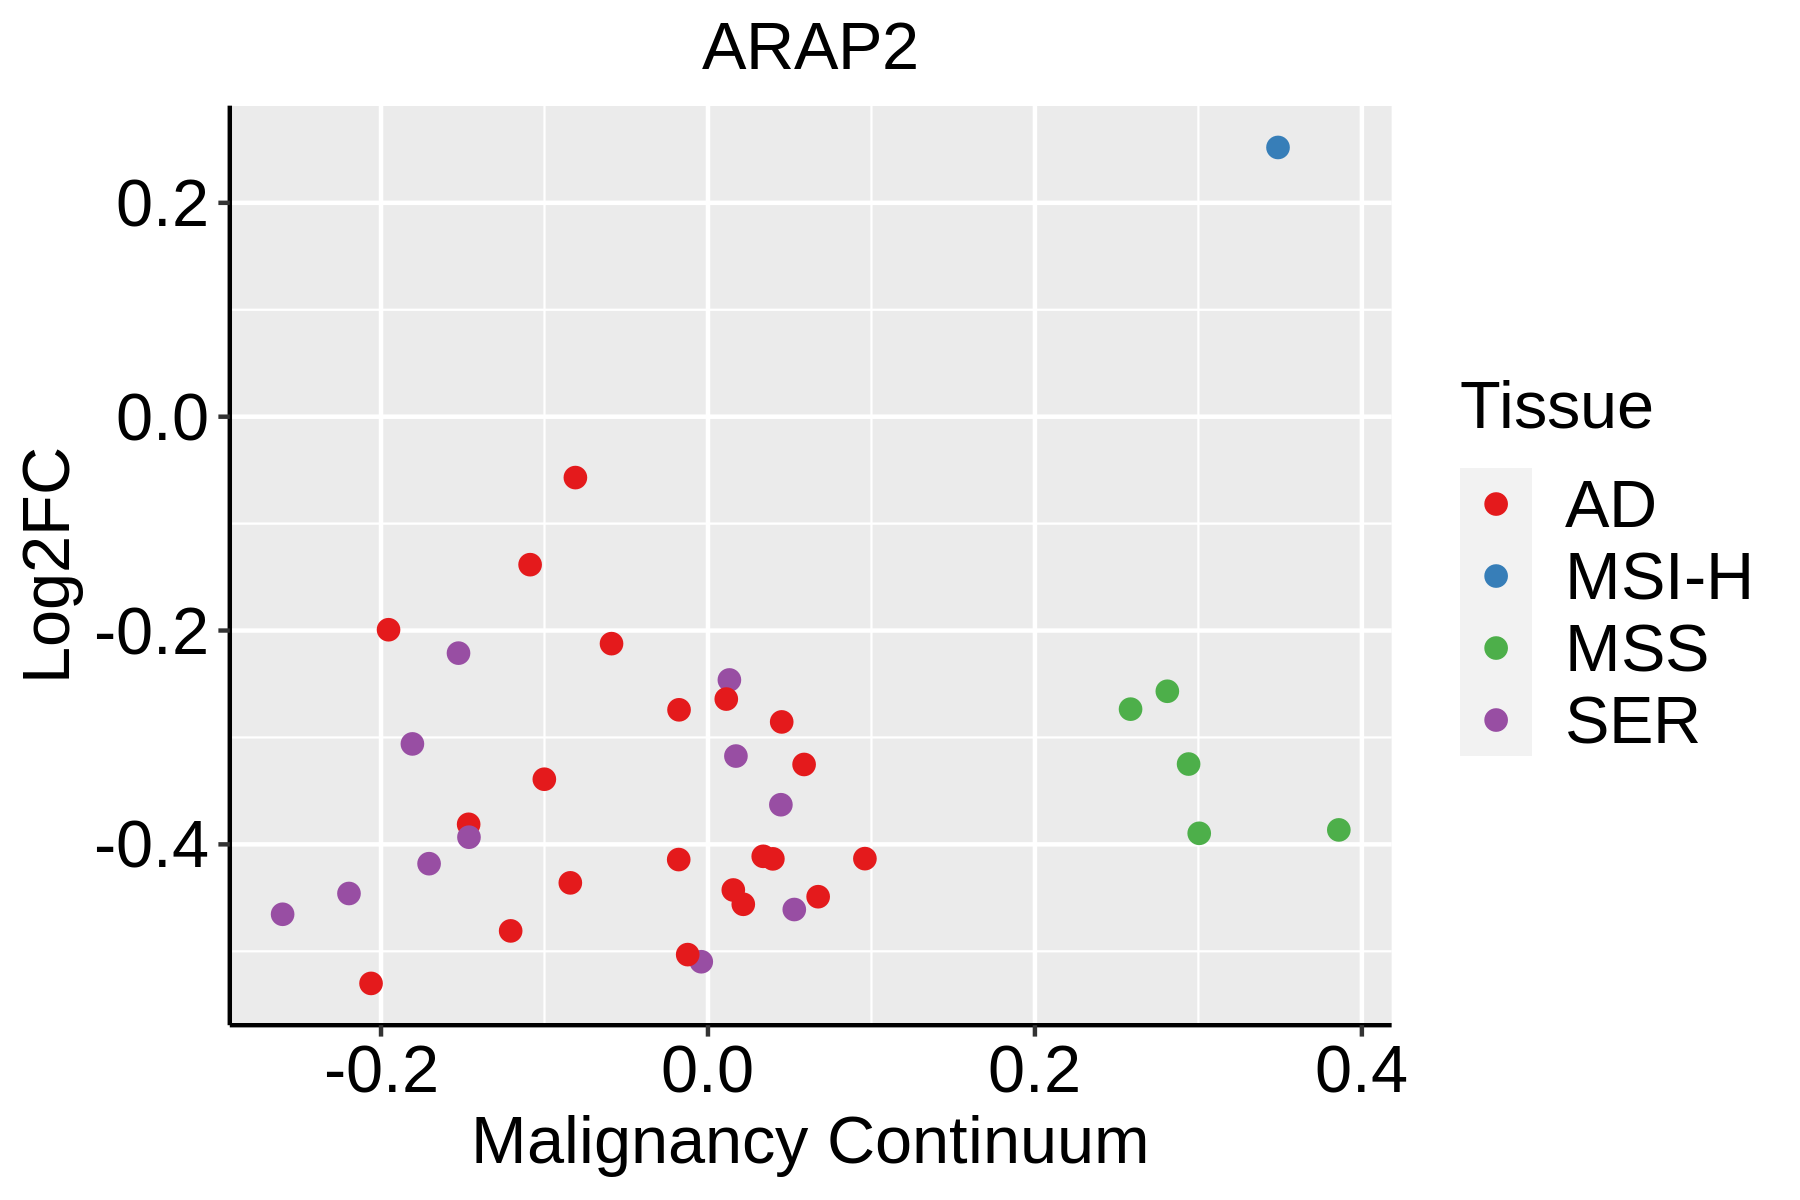 | AD: Adenomas |
| SER: Sessile serrated lesions | ||
| MSI-H: Microsatellite-high colorectal cancer | ||
| MSS: Microsatellite stable colorectal cancer | ||
| Esophagus | 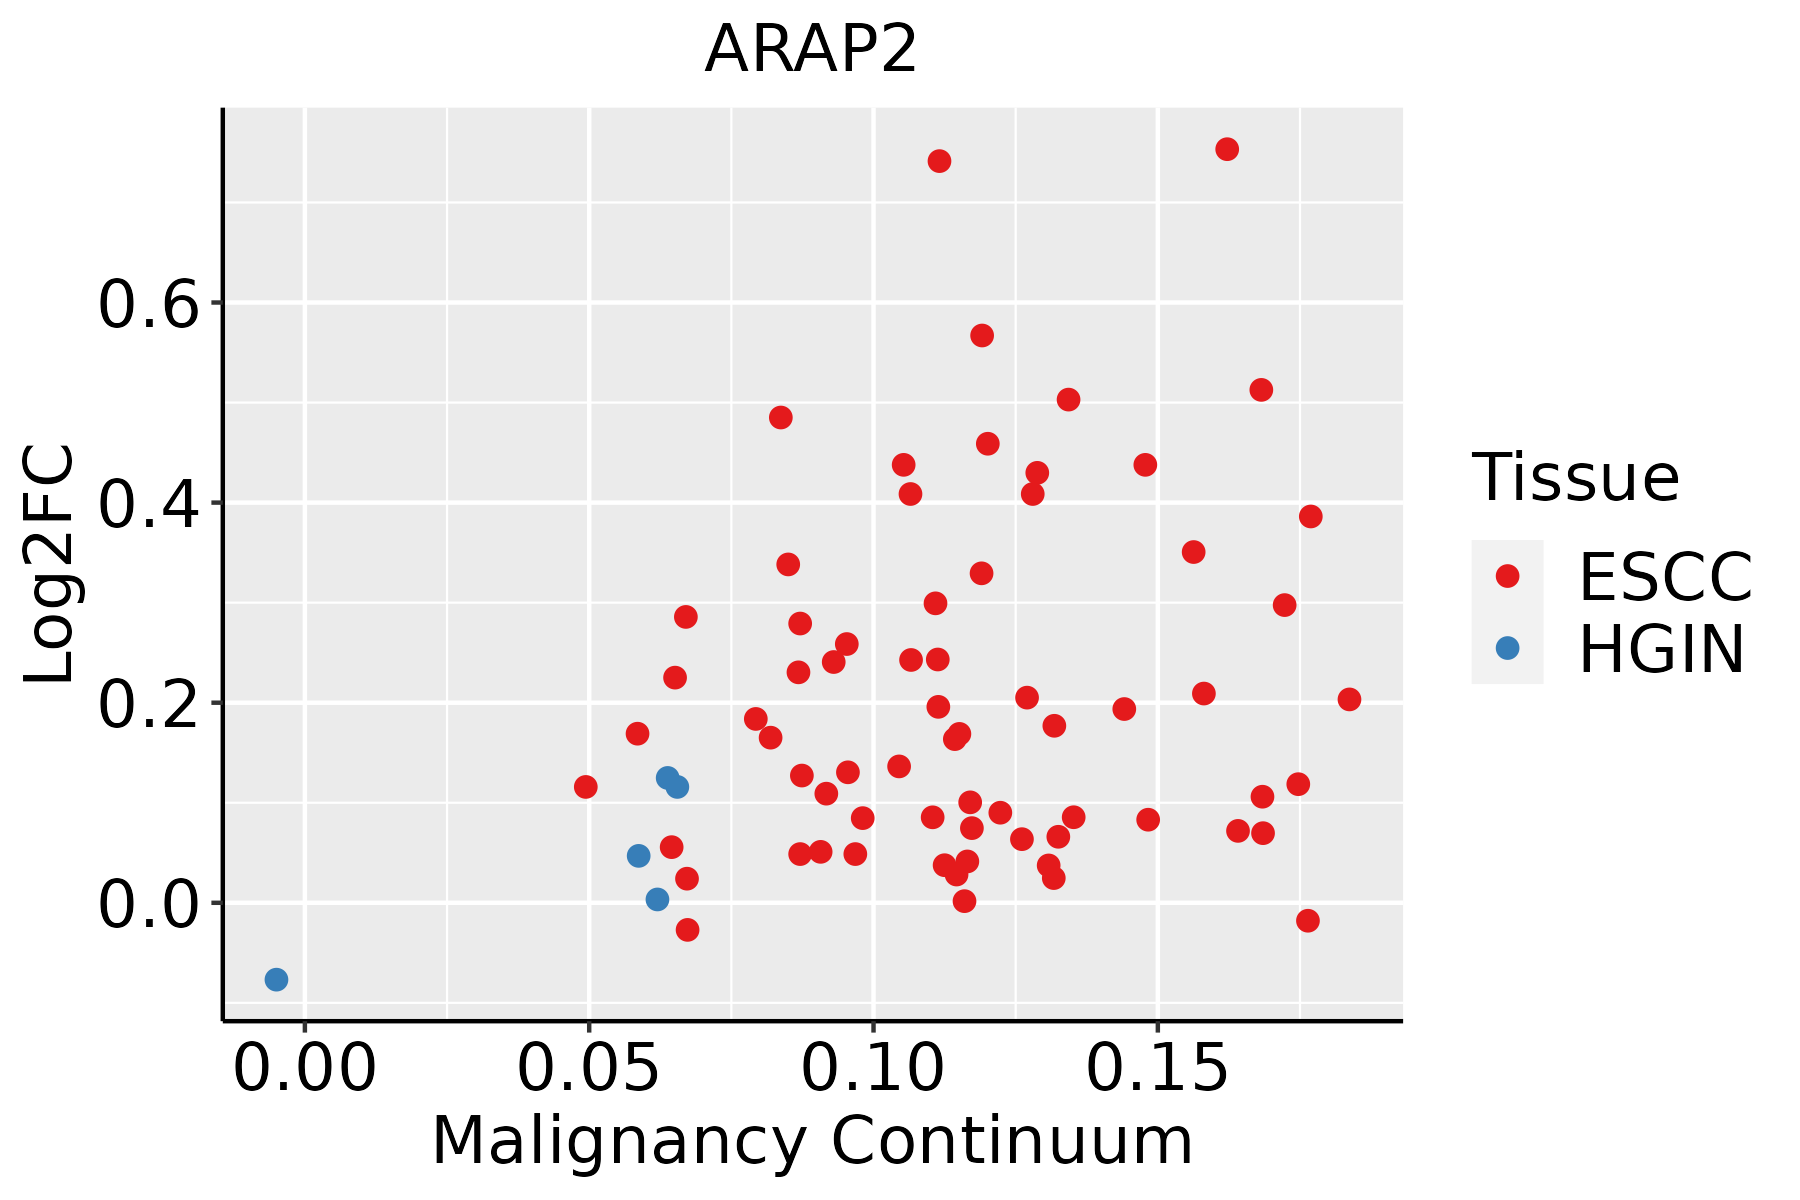 | ESCC: Esophageal squamous cell carcinoma |
| HGIN: High-grade intraepithelial neoplasias | ||
| LGIN: Low-grade intraepithelial neoplasias | ||
| Lung | 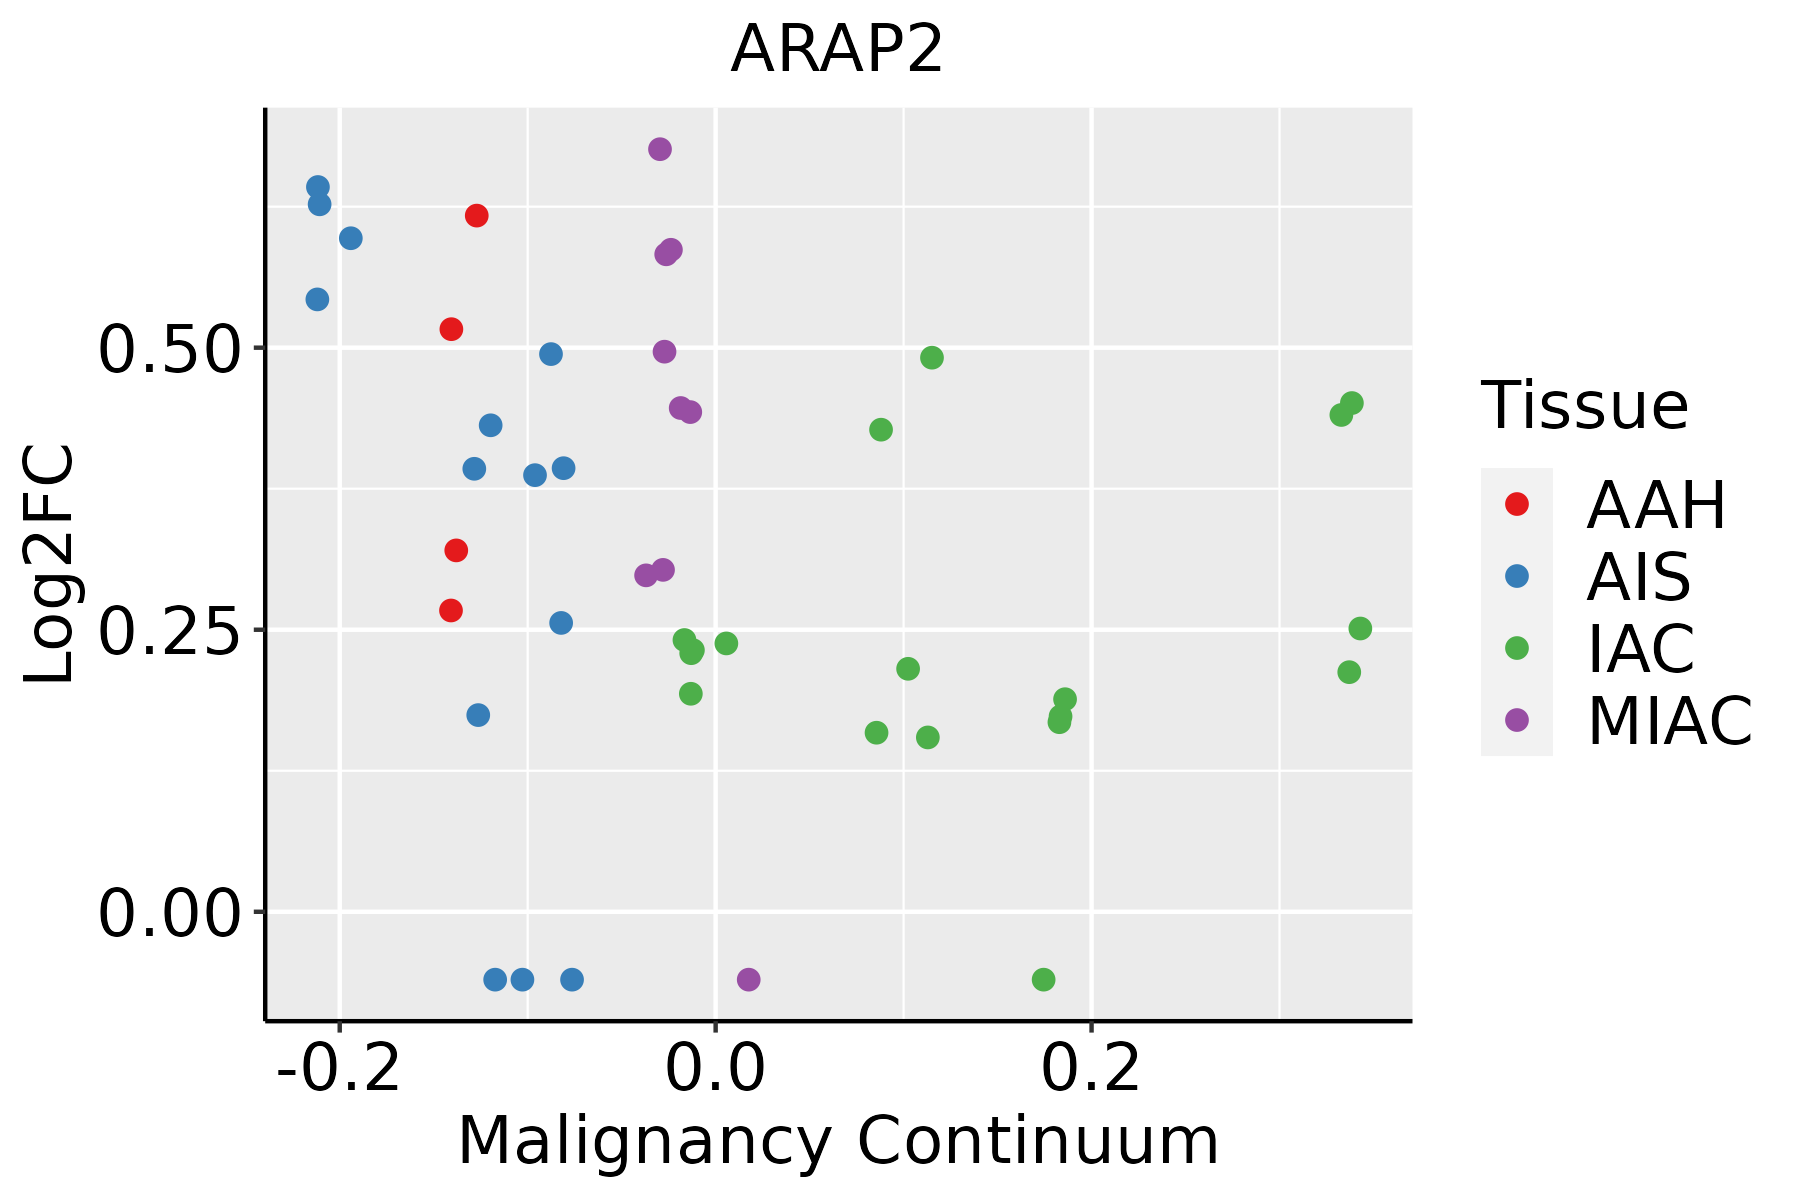 | AAH: Atypical adenomatous hyperplasia |
| AIS: Adenocarcinoma in situ | ||
| IAC: Invasive lung adenocarcinoma | ||
| MIA: Minimally invasive adenocarcinoma | ||
| Oral Cavity | 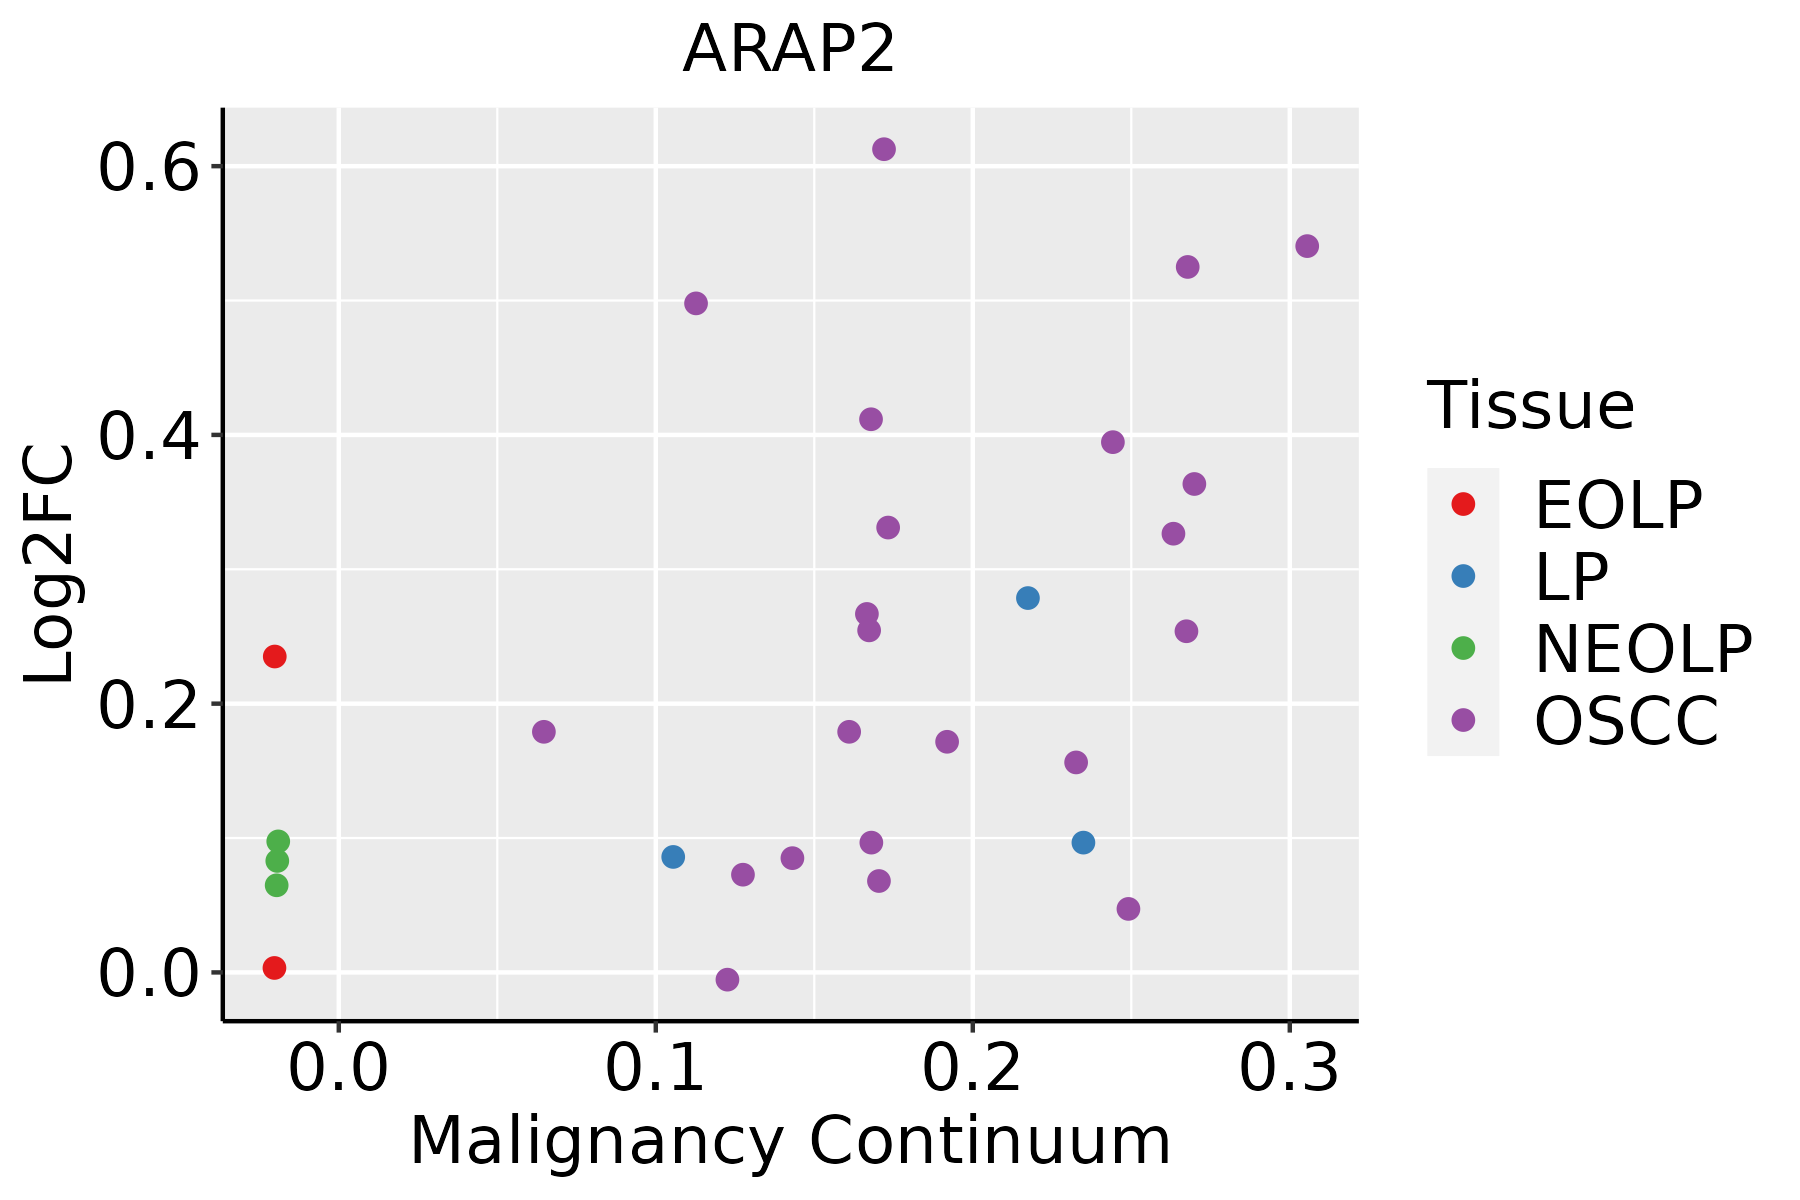 | EOLP: Erosive Oral lichen planus |
| LP: leukoplakia | ||
| NEOLP: Non-erosive oral lichen planus | ||
| OSCC: Oral squamous cell carcinoma | ||
| Prostate |  | BPH: Benign Prostatic Hyperplasia |
| Thyroid | 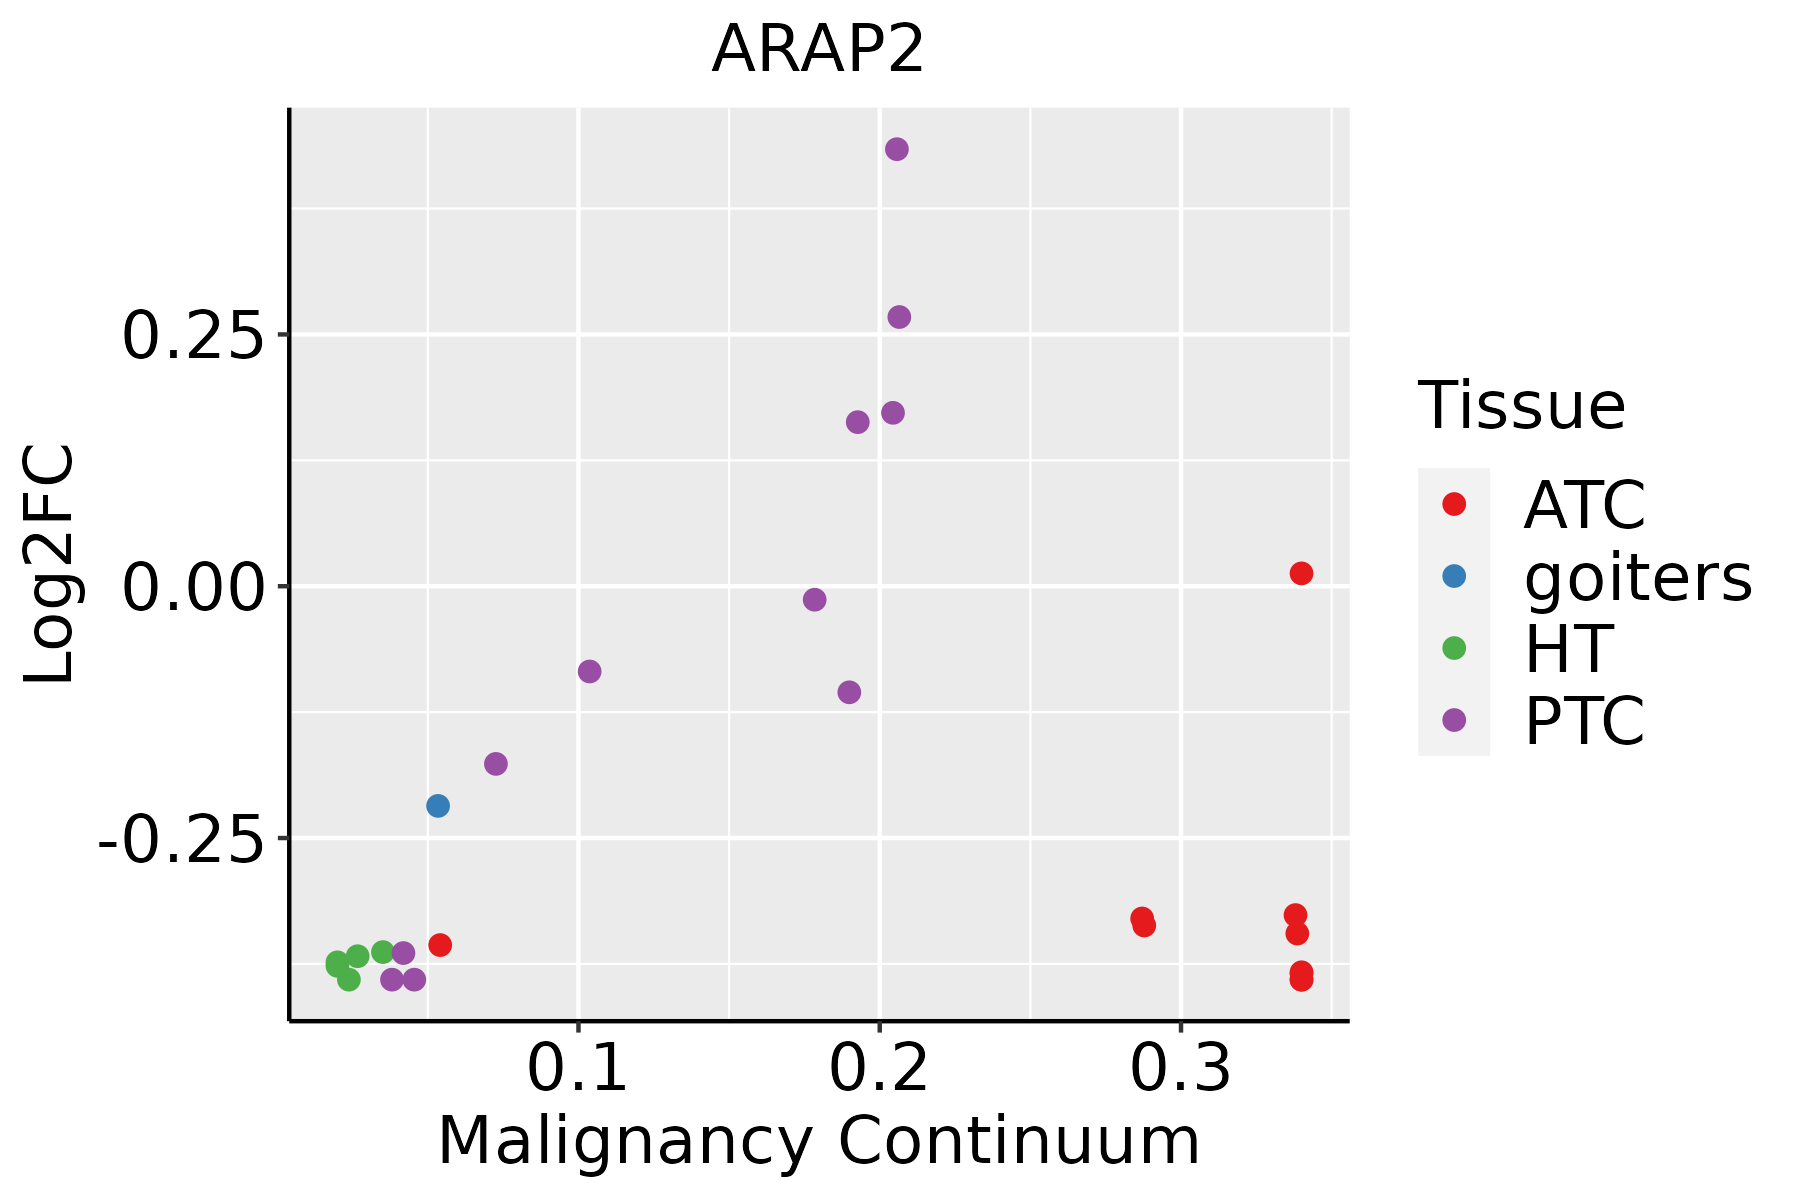 | ATC: Anaplastic thyroid cancer |
| HT: Hashimoto's thyroiditis | ||
| PTC: Papillary thyroid cancer |
| ∗log2FC in expression of this searched gene in stem-like cells from each diseased tissue sample relative to stem-like cells in normal samples in each tissue plotted against the malignancy continuum. Samples are colored based on if they are from different disease stage. |
Top |
Malignant transformation related pathway analysis |
| Find out the enriched GO biological processes and KEGG pathways involved in transition from healthy to precancer to cancer |
| Tissue | Disease Stage | Enriched GO biological Processes |
| Colorectum | AD |  |
| Colorectum | SER |  |
| Colorectum | MSS |  |
| Colorectum | MSI-H |  |
| Colorectum | FAP |  |
| ∗Top 15 enriched GO BP terms are showed in the bar plot of each disease state in each tissue. Each row represents a significant GO biological process which is colored according to the -log10(p.adjust). |
| Page: 1 2 3 4 5 6 7 8 9 |
| GO ID | Tissue | Disease Stage | Description | Gene Ratio | Bg Ratio | pvalue | p.adjust | Count |
| GO:0043087 | Colorectum | AD | regulation of GTPase activity | 110/3918 | 348/18723 | 1.64e-06 | 5.03e-05 | 110 |
| GO:0043547 | Colorectum | AD | positive regulation of GTPase activity | 75/3918 | 255/18723 | 7.95e-04 | 7.91e-03 | 75 |
| GO:00430872 | Colorectum | MSS | regulation of GTPase activity | 101/3467 | 348/18723 | 1.00e-06 | 3.46e-05 | 101 |
| GO:00435471 | Colorectum | MSS | positive regulation of GTPase activity | 68/3467 | 255/18723 | 7.97e-04 | 8.38e-03 | 68 |
| GO:00430873 | Colorectum | FAP | regulation of GTPase activity | 85/2622 | 348/18723 | 1.20e-07 | 7.68e-06 | 85 |
| GO:00435472 | Colorectum | FAP | positive regulation of GTPase activity | 61/2622 | 255/18723 | 1.39e-05 | 3.73e-04 | 61 |
| GO:00430874 | Colorectum | CRC | regulation of GTPase activity | 69/2078 | 348/18723 | 1.11e-06 | 6.69e-05 | 69 |
| GO:00435473 | Colorectum | CRC | positive regulation of GTPase activity | 49/2078 | 255/18723 | 8.67e-05 | 1.77e-03 | 49 |
| GO:004308715 | Esophagus | ESCC | regulation of GTPase activity | 183/8552 | 348/18723 | 5.34e-03 | 2.00e-02 | 183 |
| GO:00430876 | Lung | IAC | regulation of GTPase activity | 67/2061 | 348/18723 | 3.43e-06 | 1.44e-04 | 67 |
| GO:00435475 | Lung | IAC | positive regulation of GTPase activity | 48/2061 | 255/18723 | 1.40e-04 | 2.60e-03 | 48 |
| GO:004308711 | Lung | AIS | regulation of GTPase activity | 65/1849 | 348/18723 | 3.35e-07 | 2.83e-05 | 65 |
| GO:004354711 | Lung | AIS | positive regulation of GTPase activity | 44/1849 | 255/18723 | 1.74e-04 | 3.64e-03 | 44 |
| GO:004308710 | Oral cavity | OSCC | regulation of GTPase activity | 165/7305 | 348/18723 | 7.94e-04 | 4.27e-03 | 165 |
| GO:00430879 | Prostate | BPH | regulation of GTPase activity | 88/3107 | 348/18723 | 2.04e-05 | 2.49e-04 | 88 |
| GO:00435478 | Prostate | BPH | positive regulation of GTPase activity | 61/3107 | 255/18723 | 1.58e-03 | 9.23e-03 | 61 |
| GO:004308713 | Prostate | Tumor | regulation of GTPase activity | 88/3246 | 348/18723 | 1.04e-04 | 1.00e-03 | 88 |
| GO:004354713 | Prostate | Tumor | positive regulation of GTPase activity | 60/3246 | 255/18723 | 6.87e-03 | 3.11e-02 | 60 |
| GO:004308718 | Thyroid | PTC | regulation of GTPase activity | 148/5968 | 348/18723 | 1.63e-05 | 1.71e-04 | 148 |
| GO:004354714 | Thyroid | PTC | positive regulation of GTPase activity | 103/5968 | 255/18723 | 2.38e-03 | 1.25e-02 | 103 |
| Page: 1 2 |
| Pathway ID | Tissue | Disease Stage | Description | Gene Ratio | Bg Ratio | pvalue | p.adjust | qvalue | Count |
| hsa04144 | Colorectum | AD | Endocytosis | 111/2092 | 251/8465 | 5.95e-12 | 1.42e-10 | 9.08e-11 | 111 |
| hsa041441 | Colorectum | AD | Endocytosis | 111/2092 | 251/8465 | 5.95e-12 | 1.42e-10 | 9.08e-11 | 111 |
| hsa041444 | Colorectum | MSS | Endocytosis | 102/1875 | 251/8465 | 1.85e-11 | 4.43e-10 | 2.71e-10 | 102 |
| hsa041445 | Colorectum | MSS | Endocytosis | 102/1875 | 251/8465 | 1.85e-11 | 4.43e-10 | 2.71e-10 | 102 |
| hsa041446 | Colorectum | FAP | Endocytosis | 78/1404 | 251/8465 | 6.20e-09 | 2.96e-07 | 1.80e-07 | 78 |
| hsa041447 | Colorectum | FAP | Endocytosis | 78/1404 | 251/8465 | 6.20e-09 | 2.96e-07 | 1.80e-07 | 78 |
| hsa041448 | Colorectum | CRC | Endocytosis | 65/1091 | 251/8465 | 1.27e-08 | 1.06e-06 | 7.19e-07 | 65 |
| hsa041449 | Colorectum | CRC | Endocytosis | 65/1091 | 251/8465 | 1.27e-08 | 1.06e-06 | 7.19e-07 | 65 |
| hsa04144210 | Esophagus | ESCC | Endocytosis | 186/4205 | 251/8465 | 9.74e-16 | 4.66e-14 | 2.39e-14 | 186 |
| hsa0414437 | Esophagus | ESCC | Endocytosis | 186/4205 | 251/8465 | 9.74e-16 | 4.66e-14 | 2.39e-14 | 186 |
| hsa0414414 | Lung | IAC | Endocytosis | 51/1053 | 251/8465 | 2.25e-04 | 2.54e-03 | 1.68e-03 | 51 |
| hsa0414415 | Lung | IAC | Endocytosis | 51/1053 | 251/8465 | 2.25e-04 | 2.54e-03 | 1.68e-03 | 51 |
| hsa0414423 | Lung | AIS | Endocytosis | 52/961 | 251/8465 | 9.74e-06 | 3.04e-04 | 1.95e-04 | 52 |
| hsa0414433 | Lung | AIS | Endocytosis | 52/961 | 251/8465 | 9.74e-06 | 3.04e-04 | 1.95e-04 | 52 |
| hsa0414427 | Oral cavity | OSCC | Endocytosis | 174/3704 | 251/8465 | 9.42e-17 | 4.51e-15 | 2.29e-15 | 174 |
| hsa04144112 | Oral cavity | OSCC | Endocytosis | 174/3704 | 251/8465 | 9.42e-17 | 4.51e-15 | 2.29e-15 | 174 |
| hsa0414425 | Prostate | BPH | Endocytosis | 89/1718 | 251/8465 | 1.06e-08 | 1.29e-07 | 7.99e-08 | 89 |
| hsa04144111 | Prostate | BPH | Endocytosis | 89/1718 | 251/8465 | 1.06e-08 | 1.29e-07 | 7.99e-08 | 89 |
| hsa0414426 | Prostate | Tumor | Endocytosis | 92/1791 | 251/8465 | 7.83e-09 | 1.04e-07 | 6.43e-08 | 92 |
| hsa0414435 | Prostate | Tumor | Endocytosis | 92/1791 | 251/8465 | 7.83e-09 | 1.04e-07 | 6.43e-08 | 92 |
| Page: 1 |
Top |
Cell-cell communication analysis |
| Identification of potential cell-cell interactions between two cell types and their ligand-receptor pairs for different disease states |
| Ligand | Receptor | LRpair | Pathway | Tissue | Disease Stage |
| Page: 1 |
Top |
Single-cell gene regulatory network inference analysis |
| Find out the significant the regulons (TFs) and the target genes of each regulon across cell types for different disease states |
| TF | Cell Type | Tissue | Disease Stage | Target Gene | RSS | Regulon Activity |
| ∗The dot plots of a searched regulon are shown for all cell subpopulations in each disease state of each tissue based on the regulon specific score inferred using pySCENIC and by calculating the average expression. |
| Page: 1 |
Top |
Somatic mutation of malignant transformation related genes |
| Annotation of somatic variants for genes involved in malignant transformation |
| Hugo Symbol | Variant Class | Variant Classification | dbSNP RS | HGVSc | HGVSp | HGVSp Short | SWISSPROT | BIOTYPE | SIFT | PolyPhen | Tumor Sample Barcode | Tissue | Histology | Sex | Age | Stage | Therapy Types | Drugs | Outcome |
| ARAP2 | SNV | Missense_Mutation | c.1272T>A | p.Ser424Arg | p.S424R | Q8WZ64 | protein_coding | tolerated(0.2) | probably_damaging(0.942) | TCGA-A7-A0CG-01 | Breast | breast invasive carcinoma | Female | >=65 | I/II | Unknown | Unknown | SD | |
| ARAP2 | SNV | Missense_Mutation | c.3649N>T | p.Asp1217Tyr | p.D1217Y | Q8WZ64 | protein_coding | deleterious(0) | possibly_damaging(0.797) | TCGA-A8-A08S-01 | Breast | breast invasive carcinoma | Female | >=65 | I/II | Hormone Therapy | anastrozole | SD | |
| ARAP2 | SNV | Missense_Mutation | rs752381896 | c.978G>T | p.Glu326Asp | p.E326D | Q8WZ64 | protein_coding | tolerated(0.11) | benign(0.001) | TCGA-AN-A046-01 | Breast | breast invasive carcinoma | Female | >=65 | I/II | Unknown | Unknown | SD |
| ARAP2 | SNV | Missense_Mutation | c.3418N>G | p.Thr1140Ala | p.T1140A | Q8WZ64 | protein_coding | deleterious(0) | probably_damaging(0.998) | TCGA-B6-A0RQ-01 | Breast | breast invasive carcinoma | Female | >=65 | I/II | Unknown | Unknown | SD | |
| ARAP2 | SNV | Missense_Mutation | c.4138N>G | p.Ile1380Val | p.I1380V | Q8WZ64 | protein_coding | deleterious(0.03) | possibly_damaging(0.622) | TCGA-BH-A203-01 | Breast | breast invasive carcinoma | Female | >=65 | I/II | Unknown | Unknown | PD | |
| ARAP2 | SNV | Missense_Mutation | c.1133N>A | p.Ser378Asn | p.S378N | Q8WZ64 | protein_coding | tolerated(0.15) | benign(0) | TCGA-C8-A3M7-01 | Breast | breast invasive carcinoma | Female | <65 | III/IV | Unknown | Unknown | PD | |
| ARAP2 | SNV | Missense_Mutation | rs747621294 | c.4891C>T | p.Arg1631Trp | p.R1631W | Q8WZ64 | protein_coding | deleterious(0.03) | possibly_damaging(0.745) | TCGA-D8-A27G-01 | Breast | breast invasive carcinoma | Female | >=65 | I/II | Unknown | Unknown | SD |
| ARAP2 | insertion | Nonsense_Mutation | novel | c.3002_3003insAGGCTCCTAGAAGGTAGCTACCTC | p.His1001delinsGlnGlySerTerLysValAlaThrSer | p.H1001delinsQGS*KVATS | Q8WZ64 | protein_coding | TCGA-AO-A128-01 | Breast | breast invasive carcinoma | Female | <65 | I/II | Chemotherapy | doxorubicin | SD | ||
| ARAP2 | SNV | Missense_Mutation | novel | c.3158T>C | p.Val1053Ala | p.V1053A | Q8WZ64 | protein_coding | tolerated(1) | benign(0) | TCGA-2W-A8YY-01 | Cervix | cervical & endocervical cancer | Female | <65 | I/II | Chemotherapy | cisplatin | CR |
| ARAP2 | SNV | Missense_Mutation | novel | c.2669C>T | p.Ser890Phe | p.S890F | Q8WZ64 | protein_coding | tolerated(0.05) | possibly_damaging(0.478) | TCGA-EA-A3HU-01 | Cervix | cervical & endocervical cancer | Female | <65 | I/II | Unknown | Unknown | SD |
| Page: 1 2 3 4 5 6 7 8 9 10 11 12 13 14 15 16 17 18 19 20 |
Top |
Related drugs of malignant transformation related genes |
| Identification of chemicals and drugs interact with genes involved in malignant transfromation |
| (DGIdb 4.0) |
| Entrez ID | Symbol | Category | Interaction Types | Drug Claim Name | Drug Name | PMIDs |
| 116984 | ARAP2 | NA | Tumor necrosis factor alpha (TNF-alpha) inhibitors |
| Page: 1 |

Copyright 2023-Present -The University of Texas Health Science Center at Houston |