
|
|||||
|
 | |
| |
| |
| |
| |
| |
|
Gene: AQP9 |
Gene summary for AQP9 |
| Gene information | Species | Human | Gene symbol | AQP9 | Gene ID | 366 |
| Gene name | aquaporin 9 | |
| Gene Alias | AQP-9 | |
| Cytomap | 15q21.3 | |
| Gene Type | protein-coding | GO ID | GO:0003008 | UniProtAcc | H0YK62 |
Top |
Malignant transformation analysis |
| Identification of the aberrant gene expression in precancerous and cancerous lesions by comparing the gene expression of stem-like cells in diseased tissues with normal stem cells |
| Entrez ID | Symbol | Replicates | Species | Organ | Tissue | Adj P-value | Log2FC | Malignancy |
| 366 | AQP9 | NAFLD1 | Human | Liver | NAFLD | 7.77e-10 | 7.62e-01 | -0.04 |
| 366 | AQP9 | S41 | Human | Liver | Cirrhotic | 4.44e-02 | 3.01e-01 | -0.0343 |
| 366 | AQP9 | HCC1_Meng | Human | Liver | HCC | 2.93e-03 | -1.54e-01 | 0.0246 |
| 366 | AQP9 | HCC2_Meng | Human | Liver | HCC | 2.47e-02 | -1.55e-01 | 0.0107 |
| 366 | AQP9 | cirrhotic1 | Human | Liver | Cirrhotic | 4.57e-04 | -1.48e-01 | 0.0202 |
| 366 | AQP9 | HCC1 | Human | Liver | HCC | 6.30e-29 | 6.40e+00 | 0.5336 |
| 366 | AQP9 | HCC2 | Human | Liver | HCC | 3.59e-08 | 1.52e+00 | 0.5341 |
| 366 | AQP9 | HCC5 | Human | Liver | HCC | 8.89e-06 | 3.93e+00 | 0.4932 |
| 366 | AQP9 | Pt13.b | Human | Liver | HCC | 4.48e-04 | 5.36e-02 | 0.0251 |
| 366 | AQP9 | Pt14.b | Human | Liver | HCC | 4.68e-04 | 2.55e-01 | 0.018 |
| 366 | AQP9 | S014 | Human | Liver | HCC | 7.13e-20 | 1.24e+00 | 0.2254 |
| 366 | AQP9 | S015 | Human | Liver | HCC | 4.50e-05 | 1.30e+00 | 0.2375 |
| 366 | AQP9 | S016 | Human | Liver | HCC | 9.40e-25 | 1.61e+00 | 0.2243 |
| Page: 1 |
| Tissue | Expression Dynamics | Abbreviation |
| Liver | 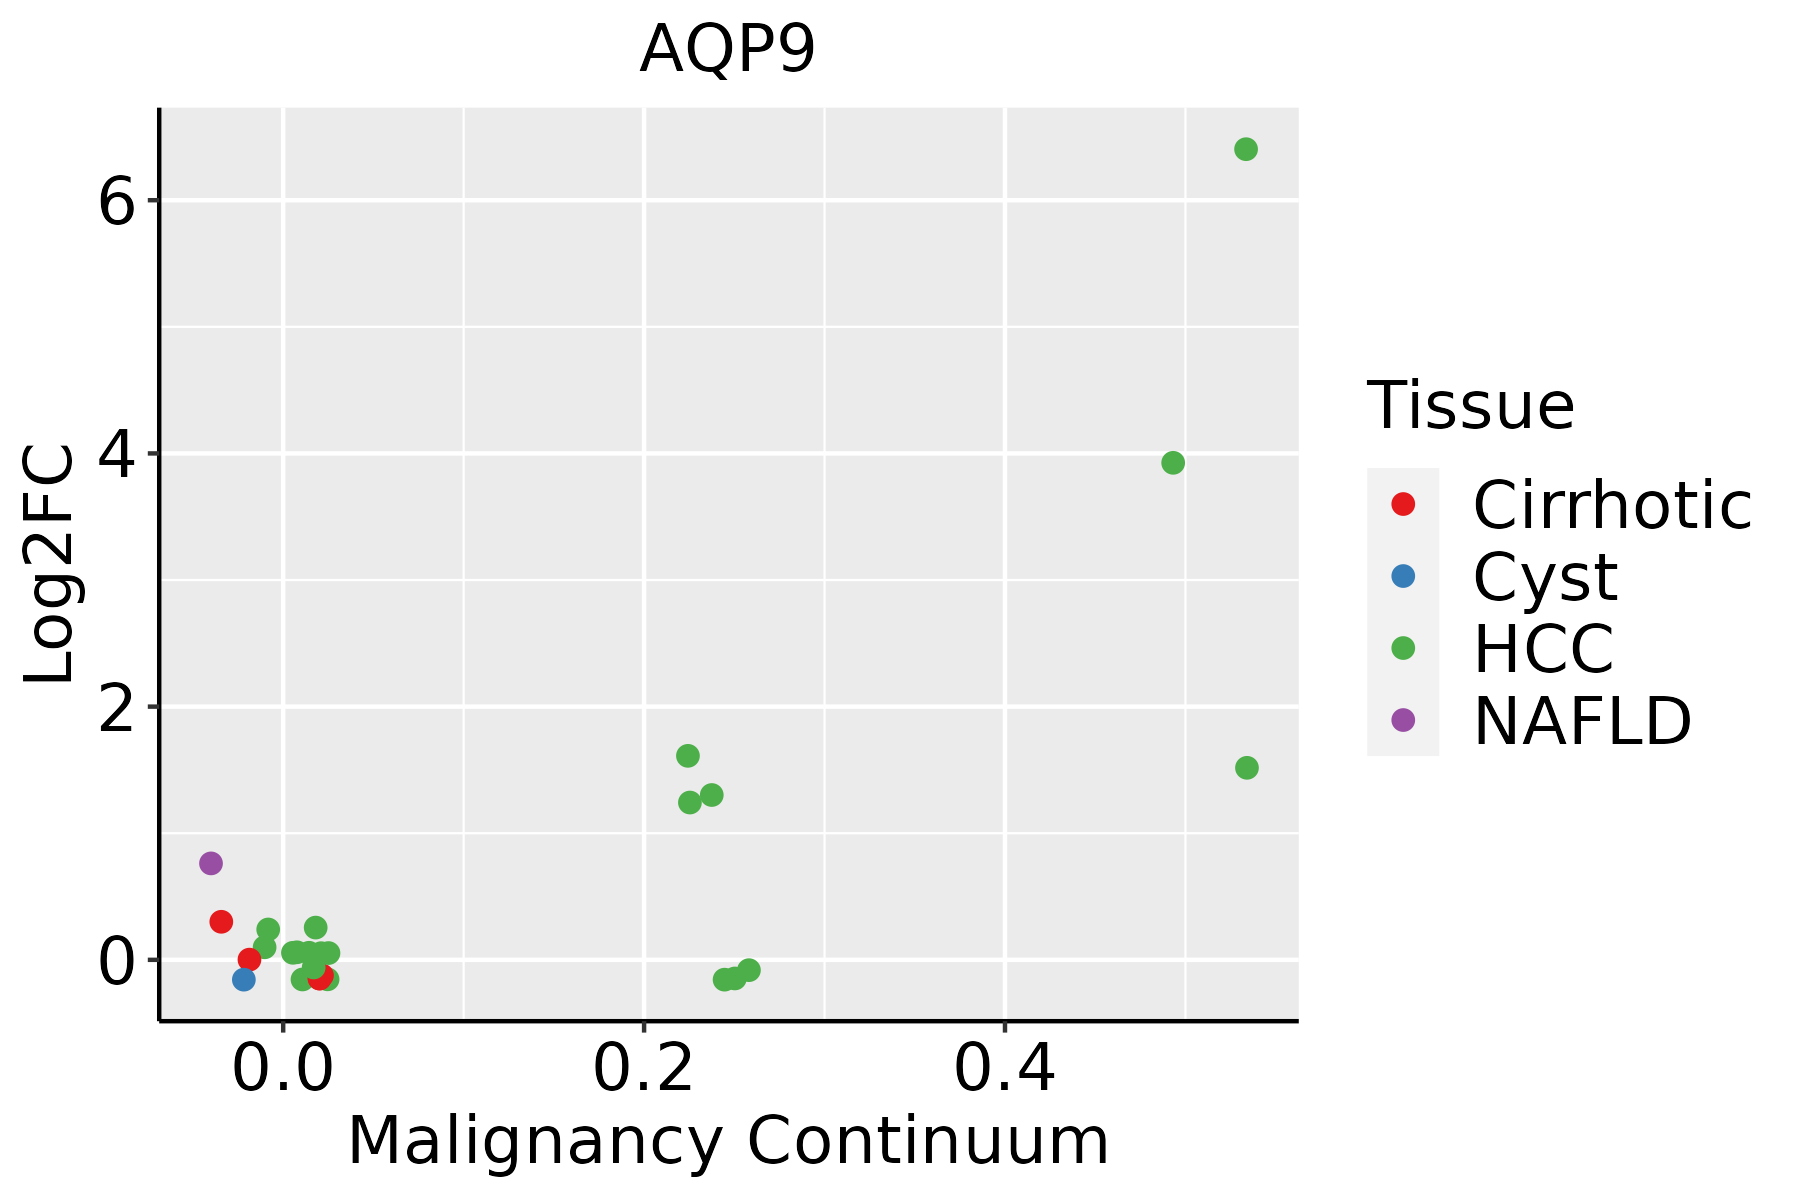 | HCC: Hepatocellular carcinoma |
| NAFLD: Non-alcoholic fatty liver disease |
| ∗log2FC in expression of this searched gene in stem-like cells from each diseased tissue sample relative to stem-like cells in normal samples in each tissue plotted against the malignancy continuum. Samples are colored based on if they are from different disease stage. |
Top |
Malignant transformation related pathway analysis |
| Find out the enriched GO biological processes and KEGG pathways involved in transition from healthy to precancer to cancer |
| Tissue | Disease Stage | Enriched GO biological Processes |
| Colorectum | AD |  |
| Colorectum | SER |  |
| Colorectum | MSS |  |
| Colorectum | MSI-H |  |
| Colorectum | FAP |  |
| ∗Top 15 enriched GO BP terms are showed in the bar plot of each disease state in each tissue. Each row represents a significant GO biological process which is colored according to the -log10(p.adjust). |
| Page: 1 2 3 4 5 6 7 8 9 |
| GO ID | Tissue | Disease Stage | Description | Gene Ratio | Bg Ratio | pvalue | p.adjust | Count |
| GO:00108765 | Liver | NAFLD | lipid localization | 79/1882 | 448/18723 | 4.75e-07 | 2.92e-05 | 79 |
| GO:00068694 | Liver | NAFLD | lipid transport | 71/1882 | 398/18723 | 1.16e-06 | 5.59e-05 | 71 |
| GO:00100387 | Liver | NAFLD | response to metal ion | 62/1882 | 373/18723 | 5.05e-05 | 1.19e-03 | 62 |
| GO:0015850 | Liver | NAFLD | organic hydroxy compound transport | 50/1882 | 284/18723 | 6.01e-05 | 1.32e-03 | 50 |
| GO:00466837 | Liver | NAFLD | response to organophosphorus | 28/1882 | 131/18723 | 9.05e-05 | 1.82e-03 | 28 |
| GO:00069703 | Liver | NAFLD | response to osmotic stress | 20/1882 | 84/18723 | 1.95e-04 | 3.41e-03 | 20 |
| GO:00140747 | Liver | NAFLD | response to purine-containing compound | 29/1882 | 148/18723 | 3.34e-04 | 5.13e-03 | 29 |
| GO:0015721 | Liver | NAFLD | bile acid and bile salt transport | 10/1882 | 30/18723 | 4.67e-04 | 6.74e-03 | 10 |
| GO:00515917 | Liver | NAFLD | response to cAMP | 20/1882 | 93/18723 | 8.01e-04 | 9.95e-03 | 20 |
| GO:001003812 | Liver | Cirrhotic | response to metal ion | 150/4634 | 373/18723 | 2.27e-11 | 1.37e-09 | 150 |
| GO:001087611 | Liver | Cirrhotic | lipid localization | 147/4634 | 448/18723 | 6.24e-05 | 7.12e-04 | 147 |
| GO:000686911 | Liver | Cirrhotic | lipid transport | 128/4634 | 398/18723 | 4.54e-04 | 3.69e-03 | 128 |
| GO:005159112 | Liver | Cirrhotic | response to cAMP | 37/4634 | 93/18723 | 9.58e-04 | 6.78e-03 | 37 |
| GO:000697011 | Liver | Cirrhotic | response to osmotic stress | 34/4634 | 84/18723 | 1.06e-03 | 7.40e-03 | 34 |
| GO:001407411 | Liver | Cirrhotic | response to purine-containing compound | 53/4634 | 148/18723 | 1.70e-03 | 1.08e-02 | 53 |
| GO:0046689 | Liver | Cirrhotic | response to mercury ion | 8/4634 | 13/18723 | 5.27e-03 | 2.70e-02 | 8 |
| GO:004668311 | Liver | Cirrhotic | response to organophosphorus | 45/4634 | 131/18723 | 8.57e-03 | 3.97e-02 | 45 |
| GO:001003822 | Liver | HCC | response to metal ion | 208/7958 | 373/18723 | 1.35e-07 | 2.56e-06 | 208 |
| GO:001087621 | Liver | HCC | lipid localization | 228/7958 | 448/18723 | 1.80e-04 | 1.41e-03 | 228 |
| GO:005159121 | Liver | HCC | response to cAMP | 57/7958 | 93/18723 | 1.96e-04 | 1.52e-03 | 57 |
| Page: 1 2 |
| Pathway ID | Tissue | Disease Stage | Description | Gene Ratio | Bg Ratio | pvalue | p.adjust | qvalue | Count |
| hsa049762 | Liver | NAFLD | Bile secretion | 20/1043 | 89/8465 | 5.08e-03 | 4.43e-02 | 3.57e-02 | 20 |
| hsa0497611 | Liver | NAFLD | Bile secretion | 20/1043 | 89/8465 | 5.08e-03 | 4.43e-02 | 3.57e-02 | 20 |
| Page: 1 |
Top |
Cell-cell communication analysis |
| Identification of potential cell-cell interactions between two cell types and their ligand-receptor pairs for different disease states |
| Ligand | Receptor | LRpair | Pathway | Tissue | Disease Stage |
| Page: 1 |
Top |
Single-cell gene regulatory network inference analysis |
| Find out the significant the regulons (TFs) and the target genes of each regulon across cell types for different disease states |
| TF | Cell Type | Tissue | Disease Stage | Target Gene | RSS | Regulon Activity |
| ∗The dot plots of a searched regulon are shown for all cell subpopulations in each disease state of each tissue based on the regulon specific score inferred using pySCENIC and by calculating the average expression. |
| Page: 1 |
Top |
Somatic mutation of malignant transformation related genes |
| Annotation of somatic variants for genes involved in malignant transformation |
| Hugo Symbol | Variant Class | Variant Classification | dbSNP RS | HGVSc | HGVSp | HGVSp Short | SWISSPROT | BIOTYPE | SIFT | PolyPhen | Tumor Sample Barcode | Tissue | Histology | Sex | Age | Stage | Therapy Types | Drugs | Outcome |
| AQP9 | SNV | Missense_Mutation | rs536480649 | c.229N>A | p.Gly77Ser | p.G77S | O43315 | protein_coding | deleterious(0.02) | possibly_damaging(0.903) | TCGA-AA-3678-01 | Colorectum | colon adenocarcinoma | Female | <65 | III/IV | Chemotherapy | folinic | CR |
| AQP9 | SNV | Missense_Mutation | c.740C>A | p.Pro247His | p.P247H | O43315 | protein_coding | deleterious(0) | probably_damaging(1) | TCGA-AA-A010-01 | Colorectum | colon adenocarcinoma | Female | <65 | I/II | Chemotherapy | folinic | CR | |
| AQP9 | SNV | Missense_Mutation | novel | c.629N>G | p.Asn210Ser | p.N210S | O43315 | protein_coding | deleterious(0.04) | probably_damaging(0.971) | TCGA-AZ-4315-01 | Colorectum | colon adenocarcinoma | Male | <65 | I/II | Unknown | Unknown | SD |
| AQP9 | SNV | Missense_Mutation | c.227G>A | p.Gly76Asp | p.G76D | O43315 | protein_coding | deleterious(0) | probably_damaging(0.986) | TCGA-AZ-4615-01 | Colorectum | colon adenocarcinoma | Male | >=65 | III/IV | Chemotherapy | xeloda | PD | |
| AQP9 | SNV | Missense_Mutation | rs751975709 | c.152N>A | p.Arg51Gln | p.R51Q | O43315 | protein_coding | tolerated(0.34) | benign(0.234) | TCGA-CA-6718-01 | Colorectum | colon adenocarcinoma | Male | <65 | I/II | Unknown | Unknown | PD |
| AQP9 | SNV | Missense_Mutation | c.308N>T | p.Pro103Leu | p.P103L | O43315 | protein_coding | deleterious(0.03) | probably_damaging(0.914) | TCGA-AG-4015-01 | Colorectum | rectum adenocarcinoma | Female | >=65 | I/II | Unknown | Unknown | SD | |
| AQP9 | SNV | Missense_Mutation | novel | c.728T>C | p.Phe243Ser | p.F243S | O43315 | protein_coding | deleterious(0) | possibly_damaging(0.868) | TCGA-EI-6917-01 | Colorectum | rectum adenocarcinoma | Male | <65 | III/IV | Chemotherapy | 5fluorouracil+oxaciplatina+l-folinian | SD |
| AQP9 | SNV | Missense_Mutation | c.90N>A | p.Phe30Leu | p.F30L | O43315 | protein_coding | tolerated(0.36) | benign(0.02) | TCGA-F5-6814-01 | Colorectum | rectum adenocarcinoma | Male | <65 | I/II | Unknown | Unknown | SD | |
| AQP9 | SNV | Missense_Mutation | novel | c.28N>G | p.Lys10Glu | p.K10E | O43315 | protein_coding | tolerated(0.07) | benign(0.012) | TCGA-AJ-A3EL-01 | Endometrium | uterine corpus endometrioid carcinoma | Female | <65 | I/II | Unknown | Unknown | SD |
| AQP9 | SNV | Missense_Mutation | rs752717219 | c.481N>A | p.Ala161Thr | p.A161T | O43315 | protein_coding | deleterious(0.01) | benign(0.026) | TCGA-AJ-A8CW-01 | Endometrium | uterine corpus endometrioid carcinoma | Female | <65 | I/II | Unknown | Unknown | SD |
| Page: 1 2 3 4 5 |
Top |
Related drugs of malignant transformation related genes |
| Identification of chemicals and drugs interact with genes involved in malignant transfromation |
| (DGIdb 4.0) |
| Entrez ID | Symbol | Category | Interaction Types | Drug Claim Name | Drug Name | PMIDs |
| 366 | AQP9 | ION CHANNEL | HORMONES | 15647391 | ||
| 366 | AQP9 | ION CHANNEL | ANDROGENS | 12021052 | ||
| 366 | AQP9 | ION CHANNEL | TESTOSTERONE | TESTOSTERONE | 12021052,12002438 | |
| 366 | AQP9 | ION CHANNEL | ANTISERUM | 16035648 | ||
| 366 | AQP9 | ION CHANNEL | inhibitor | 178101032 | ||
| 366 | AQP9 | ION CHANNEL | FLUTAMIDE | FLUTAMIDE | 12021052 | |
| 366 | AQP9 | ION CHANNEL | CISPLATIN | CISPLATIN | 12396244 | |
| 366 | AQP9 | ION CHANNEL | UREA | UREA | 12594337 | |
| 366 | AQP9 | ION CHANNEL | inhibitor | 178101102 | PHLORETIN | |
| 366 | AQP9 | ION CHANNEL | DHT | ANDROSTANOLONE | 15850448 |
| Page: 1 |

Copyright 2023-Present -The University of Texas Health Science Center at Houston |