
|
|||||
|
 | |
| |
| |
| |
| |
| |
|
Gene: AQP4 |
Gene summary for AQP4 |
| Gene information | Species | Human | Gene symbol | AQP4 | Gene ID | 361 |
| Gene name | aquaporin 4 | |
| Gene Alias | MIWC | |
| Cytomap | 18q11.2 | |
| Gene Type | protein-coding | GO ID | GO:0002376 | UniProtAcc | F1DSG4 |
Top |
Malignant transformation analysis |
| Identification of the aberrant gene expression in precancerous and cancerous lesions by comparing the gene expression of stem-like cells in diseased tissues with normal stem cells |
| Entrez ID | Symbol | Replicates | Species | Organ | Tissue | Adj P-value | Log2FC | Malignancy |
| 361 | AQP4 | RNA-P10T2-P10T2-4 | Human | Lung | AAH | 1.07e-03 | -7.26e-01 | -0.138 |
| 361 | AQP4 | RNA-P17T-P17T-2 | Human | Lung | IAC | 1.31e-02 | -1.09e+00 | 0.3371 |
| 361 | AQP4 | RNA-P17T-P17T-6 | Human | Lung | IAC | 1.48e-02 | -1.09e+00 | 0.3385 |
| 361 | AQP4 | RNA-P17T-P17T-8 | Human | Lung | IAC | 5.62e-03 | -1.10e+00 | 0.3329 |
| 361 | AQP4 | RNA-P25T1-P25T1-1 | Human | Lung | AIS | 4.85e-19 | 6.99e-03 | -0.2116 |
| 361 | AQP4 | RNA-P25T1-P25T1-2 | Human | Lung | AIS | 1.63e-10 | -8.20e-02 | -0.1941 |
| 361 | AQP4 | RNA-P25T1-P25T1-3 | Human | Lung | AIS | 3.02e-11 | -7.23e-02 | -0.2107 |
| 361 | AQP4 | RNA-P25T1-P25T1-4 | Human | Lung | AIS | 2.08e-16 | -2.30e-02 | -0.2119 |
| 361 | AQP4 | RNA-P3T-P3T-1 | Human | Lung | IAC | 7.83e-07 | -1.17e+00 | 0.1829 |
| 361 | AQP4 | RNA-P3T-P3T-2 | Human | Lung | IAC | 2.13e-07 | -1.17e+00 | 0.1835 |
| 361 | AQP4 | RNA-P3T-P3T-4 | Human | Lung | IAC | 9.01e-08 | -1.17e+00 | 0.1859 |
| 361 | AQP4 | RNA-P6T2-P6T2-1 | Human | Lung | IAC | 4.42e-20 | -1.03e+00 | -0.0166 |
| 361 | AQP4 | RNA-P6T2-P6T2-2 | Human | Lung | IAC | 8.20e-23 | -1.11e+00 | -0.0132 |
| 361 | AQP4 | RNA-P6T2-P6T2-3 | Human | Lung | IAC | 3.58e-27 | -1.05e+00 | -0.013 |
| 361 | AQP4 | RNA-P6T2-P6T2-4 | Human | Lung | IAC | 5.36e-21 | -1.09e+00 | -0.0121 |
| 361 | AQP4 | RNA-P7T1-P7T1-1 | Human | Lung | AIS | 2.94e-03 | -9.17e-01 | -0.0961 |
| 361 | AQP4 | RNA-P7T1-P7T1-2 | Human | Lung | AIS | 3.71e-04 | -8.86e-01 | -0.0876 |
| 361 | AQP4 | RNA-P7T1-P7T1-3 | Human | Lung | AIS | 2.63e-02 | -8.97e-01 | -0.0822 |
| 361 | AQP4 | RNA-P7T1-P7T1-4 | Human | Lung | AIS | 2.76e-04 | -9.74e-01 | -0.0809 |
| Page: 1 |
| Tissue | Expression Dynamics | Abbreviation |
| Lung | 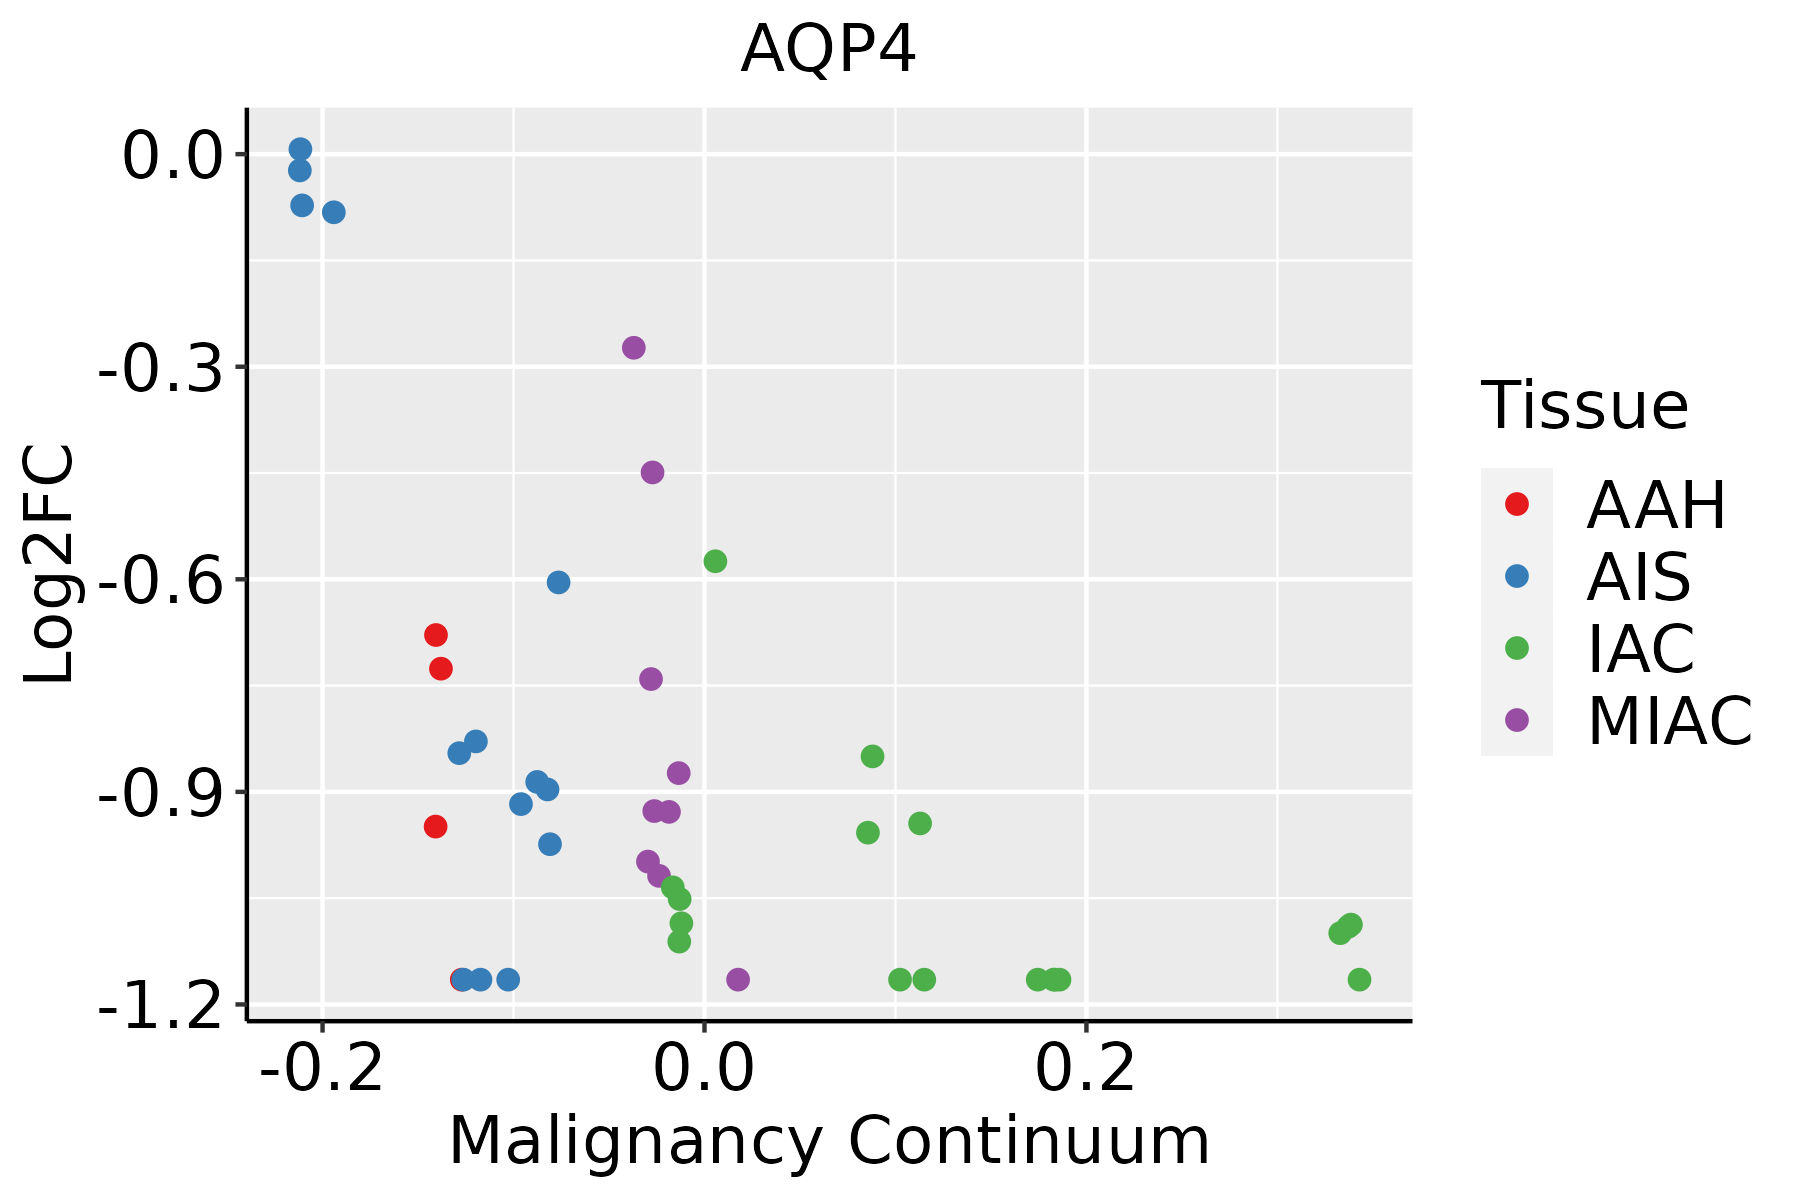 | AAH: Atypical adenomatous hyperplasia |
| AIS: Adenocarcinoma in situ | ||
| IAC: Invasive lung adenocarcinoma | ||
| MIA: Minimally invasive adenocarcinoma |
| ∗log2FC in expression of this searched gene in stem-like cells from each diseased tissue sample relative to stem-like cells in normal samples in each tissue plotted against the malignancy continuum. Samples are colored based on if they are from different disease stage. |
Top |
Malignant transformation related pathway analysis |
| Find out the enriched GO biological processes and KEGG pathways involved in transition from healthy to precancer to cancer |
| Tissue | Disease Stage | Enriched GO biological Processes |
| Colorectum | AD |  |
| Colorectum | SER |  |
| Colorectum | MSS |  |
| Colorectum | MSI-H |  |
| Colorectum | FAP |  |
| ∗Top 15 enriched GO BP terms are showed in the bar plot of each disease state in each tissue. Each row represents a significant GO biological process which is colored according to the -log10(p.adjust). |
| Page: 1 2 3 4 5 6 7 8 9 |
| GO ID | Tissue | Disease Stage | Description | Gene Ratio | Bg Ratio | pvalue | p.adjust | Count |
| GO:00325357 | Lung | IAC | regulation of cellular component size | 65/2061 | 383/18723 | 2.56e-04 | 4.26e-03 | 65 |
| GO:0099111 | Lung | IAC | microtubule-based transport | 35/2061 | 190/18723 | 1.55e-03 | 1.64e-02 | 35 |
| GO:00083615 | Lung | IAC | regulation of cell size | 33/2061 | 181/18723 | 2.47e-03 | 2.33e-02 | 33 |
| GO:00508788 | Lung | AIS | regulation of body fluid levels | 57/1849 | 379/18723 | 8.60e-04 | 1.17e-02 | 57 |
| GO:003253513 | Lung | AIS | regulation of cellular component size | 56/1849 | 383/18723 | 1.83e-03 | 2.05e-02 | 56 |
| GO:0030104 | Lung | AIS | water homeostasis | 14/1849 | 64/18723 | 3.36e-03 | 3.20e-02 | 14 |
| GO:00512621 | Lung | AAH | protein tetramerization | 9/613 | 87/18723 | 2.16e-03 | 4.66e-02 | 9 |
| Page: 1 |
| Pathway ID | Tissue | Disease Stage | Description | Gene Ratio | Bg Ratio | pvalue | p.adjust | qvalue | Count |
| Page: 1 |
Top |
Cell-cell communication analysis |
| Identification of potential cell-cell interactions between two cell types and their ligand-receptor pairs for different disease states |
| Ligand | Receptor | LRpair | Pathway | Tissue | Disease Stage |
| Page: 1 |
Top |
Single-cell gene regulatory network inference analysis |
| Find out the significant the regulons (TFs) and the target genes of each regulon across cell types for different disease states |
| TF | Cell Type | Tissue | Disease Stage | Target Gene | RSS | Regulon Activity |
| ∗The dot plots of a searched regulon are shown for all cell subpopulations in each disease state of each tissue based on the regulon specific score inferred using pySCENIC and by calculating the average expression. |
| Page: 1 |
Top |
Somatic mutation of malignant transformation related genes |
| Annotation of somatic variants for genes involved in malignant transformation |
| Hugo Symbol | Variant Class | Variant Classification | dbSNP RS | HGVSc | HGVSp | HGVSp Short | SWISSPROT | BIOTYPE | SIFT | PolyPhen | Tumor Sample Barcode | Tissue | Histology | Sex | Age | Stage | Therapy Types | Drugs | Outcome |
| AQP4 | SNV | Missense_Mutation | c.947C>T | p.Ser316Phe | p.S316F | P55087 | protein_coding | tolerated_low_confidence(0.07) | benign(0.121) | TCGA-AN-A0FX-01 | Breast | breast invasive carcinoma | Female | <65 | I/II | Unknown | Unknown | SD | |
| AQP4 | insertion | Nonsense_Mutation | novel | c.43_44insAATGATATTAATACATTGTCATCGAAAATACTCTTGCTTCAATT | p.Pro15GlnfsTer2 | p.P15Qfs*2 | P55087 | protein_coding | TCGA-A2-A0CQ-01 | Breast | breast invasive carcinoma | Female | <65 | I/II | Chemotherapy | adriamycin | SD | ||
| AQP4 | insertion | Nonsense_Mutation | novel | c.649_650insAGAATGTTATGCTCTTTGTGGTGGCACTCTATGAG | p.Ser217Ter | p.S217* | P55087 | protein_coding | TCGA-A8-A09B-01 | Breast | breast invasive carcinoma | Female | <65 | III/IV | Chemotherapy | 5-fluorouracil | SD | ||
| AQP4 | insertion | Frame_Shift_Ins | novel | c.374_375insTCTTCAGCCTCAGCTTA | p.Ala126LeufsTer45 | p.A126Lfs*45 | P55087 | protein_coding | TCGA-BH-A0H7-01 | Breast | breast invasive carcinoma | Female | >=65 | III/IV | Chemotherapy | doxorubicin | SD | ||
| AQP4 | SNV | Missense_Mutation | novel | c.812N>G | p.Gln271Arg | p.Q271R | P55087 | protein_coding | tolerated(0.35) | benign(0.017) | TCGA-AA-3710-01 | Colorectum | colon adenocarcinoma | Female | >=65 | I/II | Unknown | Unknown | SD |
| AQP4 | SNV | Missense_Mutation | c.5G>C | p.Ser2Thr | p.S2T | P55087 | protein_coding | deleterious_low_confidence(0) | benign(0.162) | TCGA-AA-3949-01 | Colorectum | colon adenocarcinoma | Female | >=65 | III/IV | Unknown | Unknown | SD | |
| AQP4 | SNV | Missense_Mutation | c.308N>T | p.Ala103Val | p.A103V | P55087 | protein_coding | deleterious(0) | probably_damaging(0.99) | TCGA-AA-3966-01 | Colorectum | colon adenocarcinoma | Female | >=65 | I/II | Unknown | Unknown | SD | |
| AQP4 | SNV | Missense_Mutation | novel | c.452N>T | p.His151Leu | p.H151L | P55087 | protein_coding | deleterious(0.04) | benign(0.1) | TCGA-AM-5820-01 | Colorectum | colon adenocarcinoma | Female | <65 | I/II | Unknown | Unknown | SD |
| AQP4 | SNV | Missense_Mutation | c.341A>C | p.Lys114Thr | p.K114T | P55087 | protein_coding | deleterious(0) | possibly_damaging(0.549) | TCGA-AZ-6606-01 | Colorectum | colon adenocarcinoma | Male | >=65 | III/IV | Chemotherapy | folfiri | PD | |
| AQP4 | SNV | Missense_Mutation | c.801C>A | p.Ser267Arg | p.S267R | P55087 | protein_coding | tolerated(0.28) | benign(0) | TCGA-CM-4744-01 | Colorectum | colon adenocarcinoma | Male | >=65 | I/II | Unknown | Unknown | SD |
| Page: 1 2 3 4 |
Top |
Related drugs of malignant transformation related genes |
| Identification of chemicals and drugs interact with genes involved in malignant transfromation |
| (DGIdb 4.0) |
| Entrez ID | Symbol | Category | Interaction Types | Drug Claim Name | Drug Name | PMIDs |
| 361 | AQP4 | ION CHANNEL, EXTERNAL SIDE OF PLASMA MEMBRANE, DRUGGABLE GENOME | ZONISAMIDE | ZONISAMIDE | 18572411 | |
| 361 | AQP4 | ION CHANNEL, EXTERNAL SIDE OF PLASMA MEMBRANE, DRUGGABLE GENOME | TOPIRAMATE | TOPIRAMATE | 18572411 | |
| 361 | AQP4 | ION CHANNEL, EXTERNAL SIDE OF PLASMA MEMBRANE, DRUGGABLE GENOME | ETHOXZOLAMIDE | ETHOXZOLAMIDE | 18572411 | |
| 361 | AQP4 | ION CHANNEL, EXTERNAL SIDE OF PLASMA MEMBRANE, DRUGGABLE GENOME | SUMATRIPTAN | SUMATRIPTAN | 18572411 | |
| 361 | AQP4 | ION CHANNEL, EXTERNAL SIDE OF PLASMA MEMBRANE, DRUGGABLE GENOME | PHENYTOIN | PHENYTOIN | 18572411 | |
| 361 | AQP4 | ION CHANNEL, EXTERNAL SIDE OF PLASMA MEMBRANE, DRUGGABLE GENOME | ACETYLSULFANILAMIDE | ACETYLSULFANILAMIDE | 18572411 | |
| 361 | AQP4 | ION CHANNEL, EXTERNAL SIDE OF PLASMA MEMBRANE, DRUGGABLE GENOME | LAMOTRIGINE | LAMOTRIGINE | 18572411 | |
| 361 | AQP4 | ION CHANNEL, EXTERNAL SIDE OF PLASMA MEMBRANE, DRUGGABLE GENOME | ACETAZOLAMIDE | ACETAZOLAMIDE | 18572411 |
| Page: 1 |

Copyright 2023-Present -The University of Texas Health Science Center at Houston |