
|
|||||
|
 | |
| |
| |
| |
| |
| |
|
Gene: AQP1 |
Gene summary for AQP1 |
| Gene information | Species | Human | Gene symbol | AQP1 | Gene ID | 358 |
| Gene name | aquaporin 1 (Colton blood group) | |
| Gene Alias | AQP-CHIP | |
| Cytomap | 7p14.3 | |
| Gene Type | protein-coding | GO ID | GO:0000302 | UniProtAcc | A0A024RA31 |
Top |
Malignant transformation analysis |
| Identification of the aberrant gene expression in precancerous and cancerous lesions by comparing the gene expression of stem-like cells in diseased tissues with normal stem cells |
| Entrez ID | Symbol | Replicates | Species | Organ | Tissue | Adj P-value | Log2FC | Malignancy |
| 358 | AQP1 | HTA11_2951_2000001011 | Human | Colorectum | AD | 4.37e-02 | 3.54e-01 | 0.0216 |
| 358 | AQP1 | HTA11_347_2000001011 | Human | Colorectum | AD | 1.00e-03 | 2.67e-01 | -0.1954 |
| 358 | AQP1 | HTA11_696_2000001011 | Human | Colorectum | AD | 1.26e-02 | 1.86e-01 | -0.1464 |
| 358 | AQP1 | HTA11_546_2000001011 | Human | Colorectum | AD | 2.89e-03 | 3.41e-01 | -0.0842 |
| 358 | AQP1 | HTA11_7862_2000001011 | Human | Colorectum | AD | 1.75e-04 | 4.22e-01 | -0.0179 |
| 358 | AQP1 | HTA11_7663_2000001011 | Human | Colorectum | SER | 7.50e-07 | 7.56e-01 | 0.0131 |
| 358 | AQP1 | HTA11_7469_2000001011 | Human | Colorectum | AD | 4.85e-02 | 5.42e-01 | -0.0124 |
| 358 | AQP1 | P12T-E | Human | Esophagus | ESCC | 1.31e-05 | 8.01e-02 | 0.1122 |
| 358 | AQP1 | P56T-E | Human | Esophagus | ESCC | 1.43e-03 | 1.72e+00 | 0.1613 |
| 358 | AQP1 | P62T-E | Human | Esophagus | ESCC | 9.43e-03 | 1.80e-02 | 0.1302 |
| 358 | AQP1 | P76T-E | Human | Esophagus | ESCC | 1.66e-10 | 5.78e-01 | 0.1207 |
| 358 | AQP1 | S41 | Human | Liver | Cirrhotic | 2.41e-04 | -5.27e-01 | -0.0343 |
| 358 | AQP1 | S43 | Human | Liver | Cirrhotic | 3.78e-35 | 5.67e-01 | -0.0187 |
| 358 | AQP1 | HCC1_Meng | Human | Liver | HCC | 2.88e-23 | -7.13e-01 | 0.0246 |
| 358 | AQP1 | HCC2_Meng | Human | Liver | HCC | 1.44e-21 | -5.97e-01 | 0.0107 |
| 358 | AQP1 | cirrhotic1 | Human | Liver | Cirrhotic | 1.63e-20 | 1.75e-01 | 0.0202 |
| 358 | AQP1 | cirrhotic2 | Human | Liver | Cirrhotic | 4.57e-30 | 5.21e-01 | 0.0201 |
| 358 | AQP1 | cirrhotic3 | Human | Liver | Cirrhotic | 1.41e-06 | 2.10e-01 | 0.0215 |
| 358 | AQP1 | p6 | Human | Liver | Cyst | 8.64e-05 | -7.13e-01 | -0.0218 |
| 358 | AQP1 | HCC1 | Human | Liver | HCC | 8.90e-14 | 7.45e-01 | 0.5336 |
| Page: 1 2 3 |
| Tissue | Expression Dynamics | Abbreviation |
| Colorectum (GSE201348) | 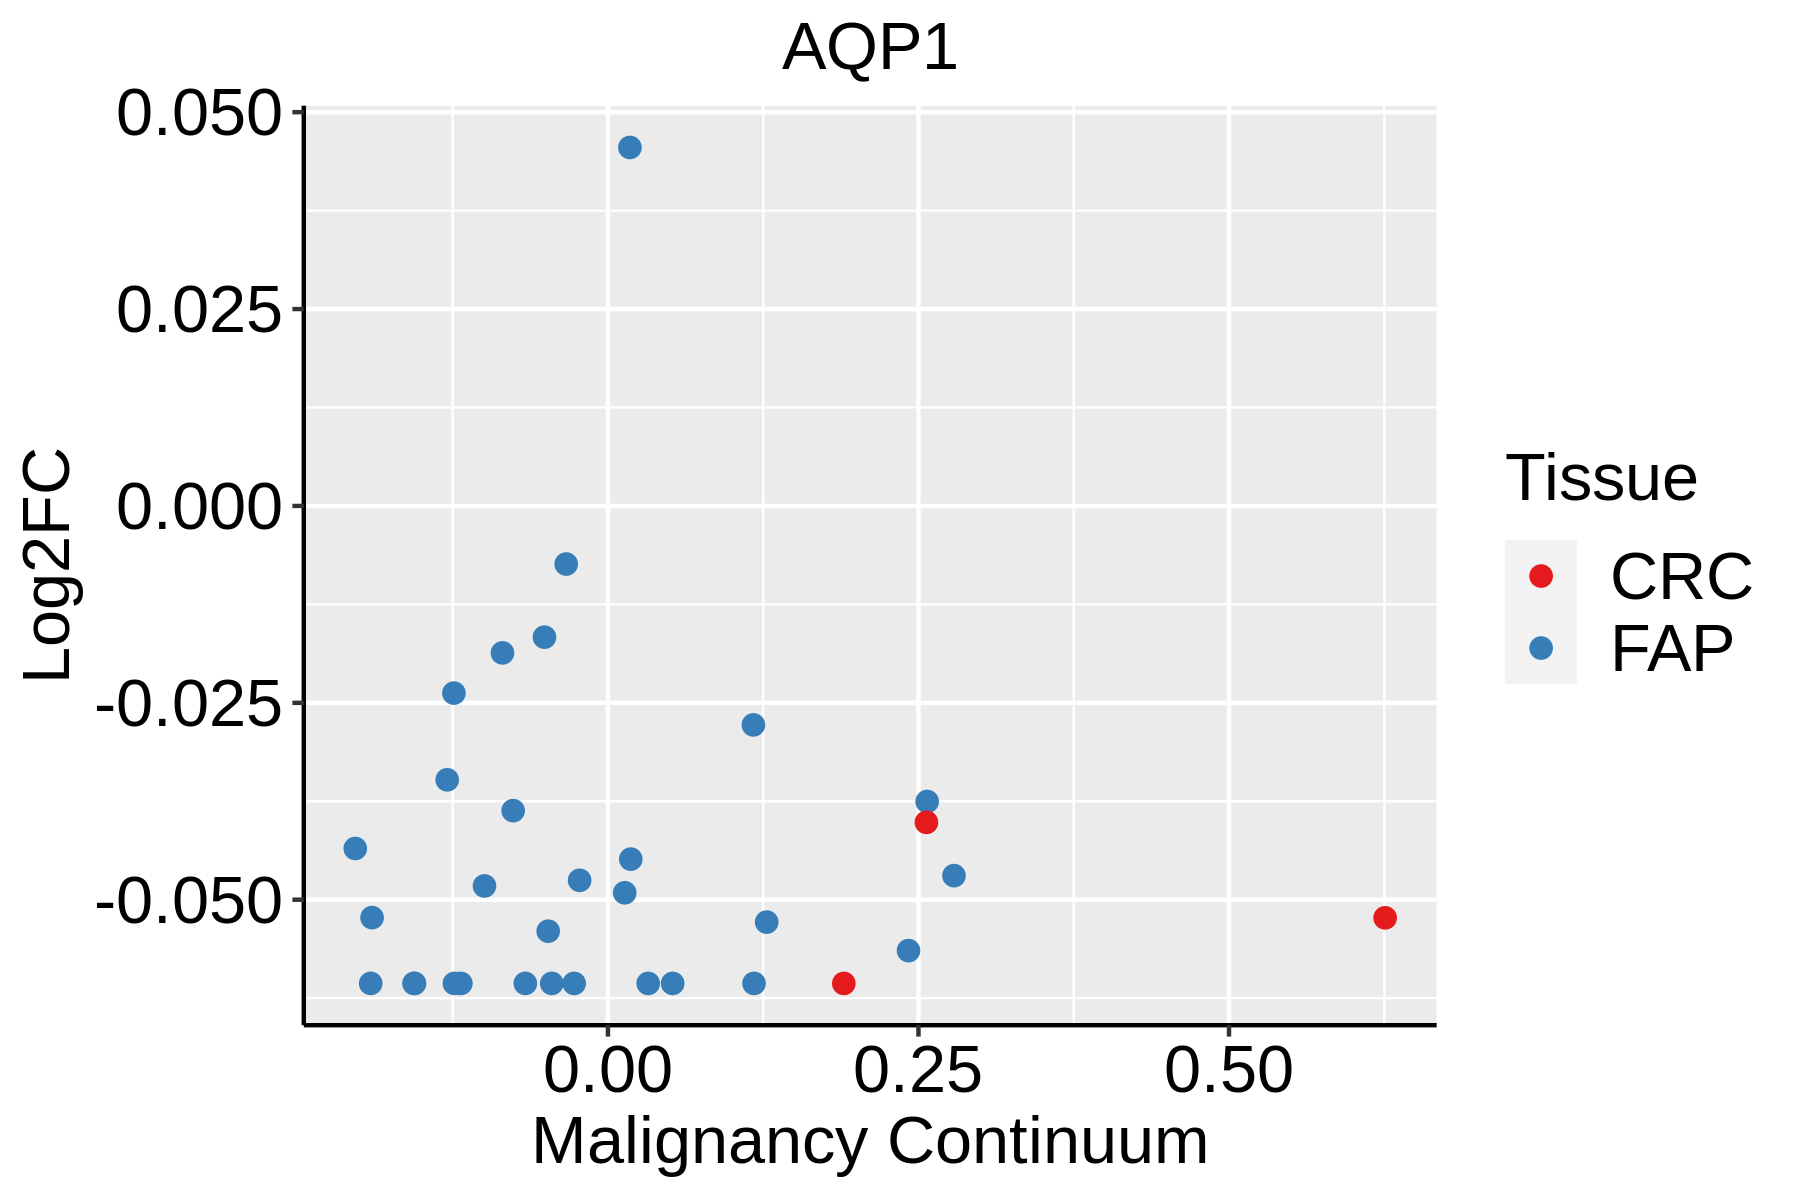 | FAP: Familial adenomatous polyposis |
| CRC: Colorectal cancer | ||
| Colorectum (HTA11) |  | AD: Adenomas |
| SER: Sessile serrated lesions | ||
| MSI-H: Microsatellite-high colorectal cancer | ||
| MSS: Microsatellite stable colorectal cancer | ||
| Esophagus |  | ESCC: Esophageal squamous cell carcinoma |
| HGIN: High-grade intraepithelial neoplasias | ||
| LGIN: Low-grade intraepithelial neoplasias | ||
| Liver | 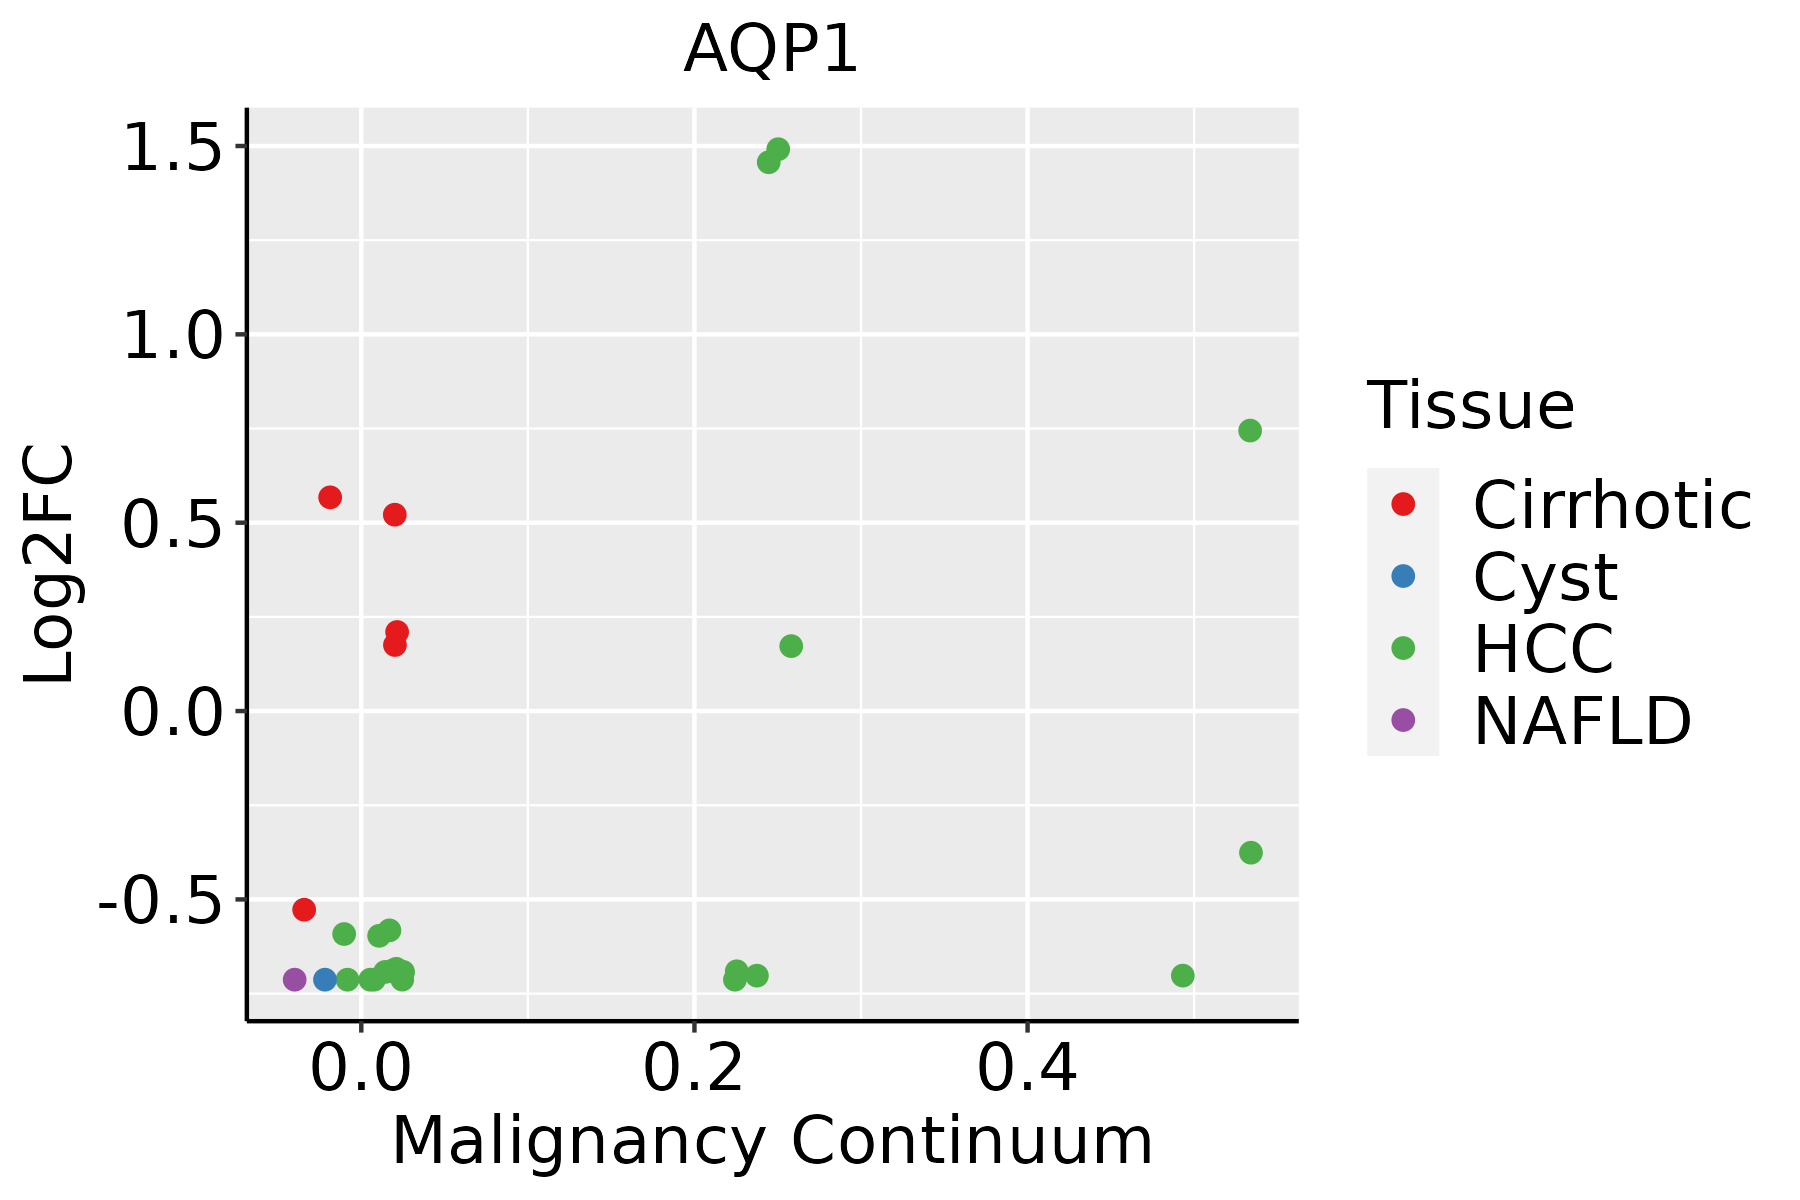 | HCC: Hepatocellular carcinoma |
| NAFLD: Non-alcoholic fatty liver disease | ||
| Lung | 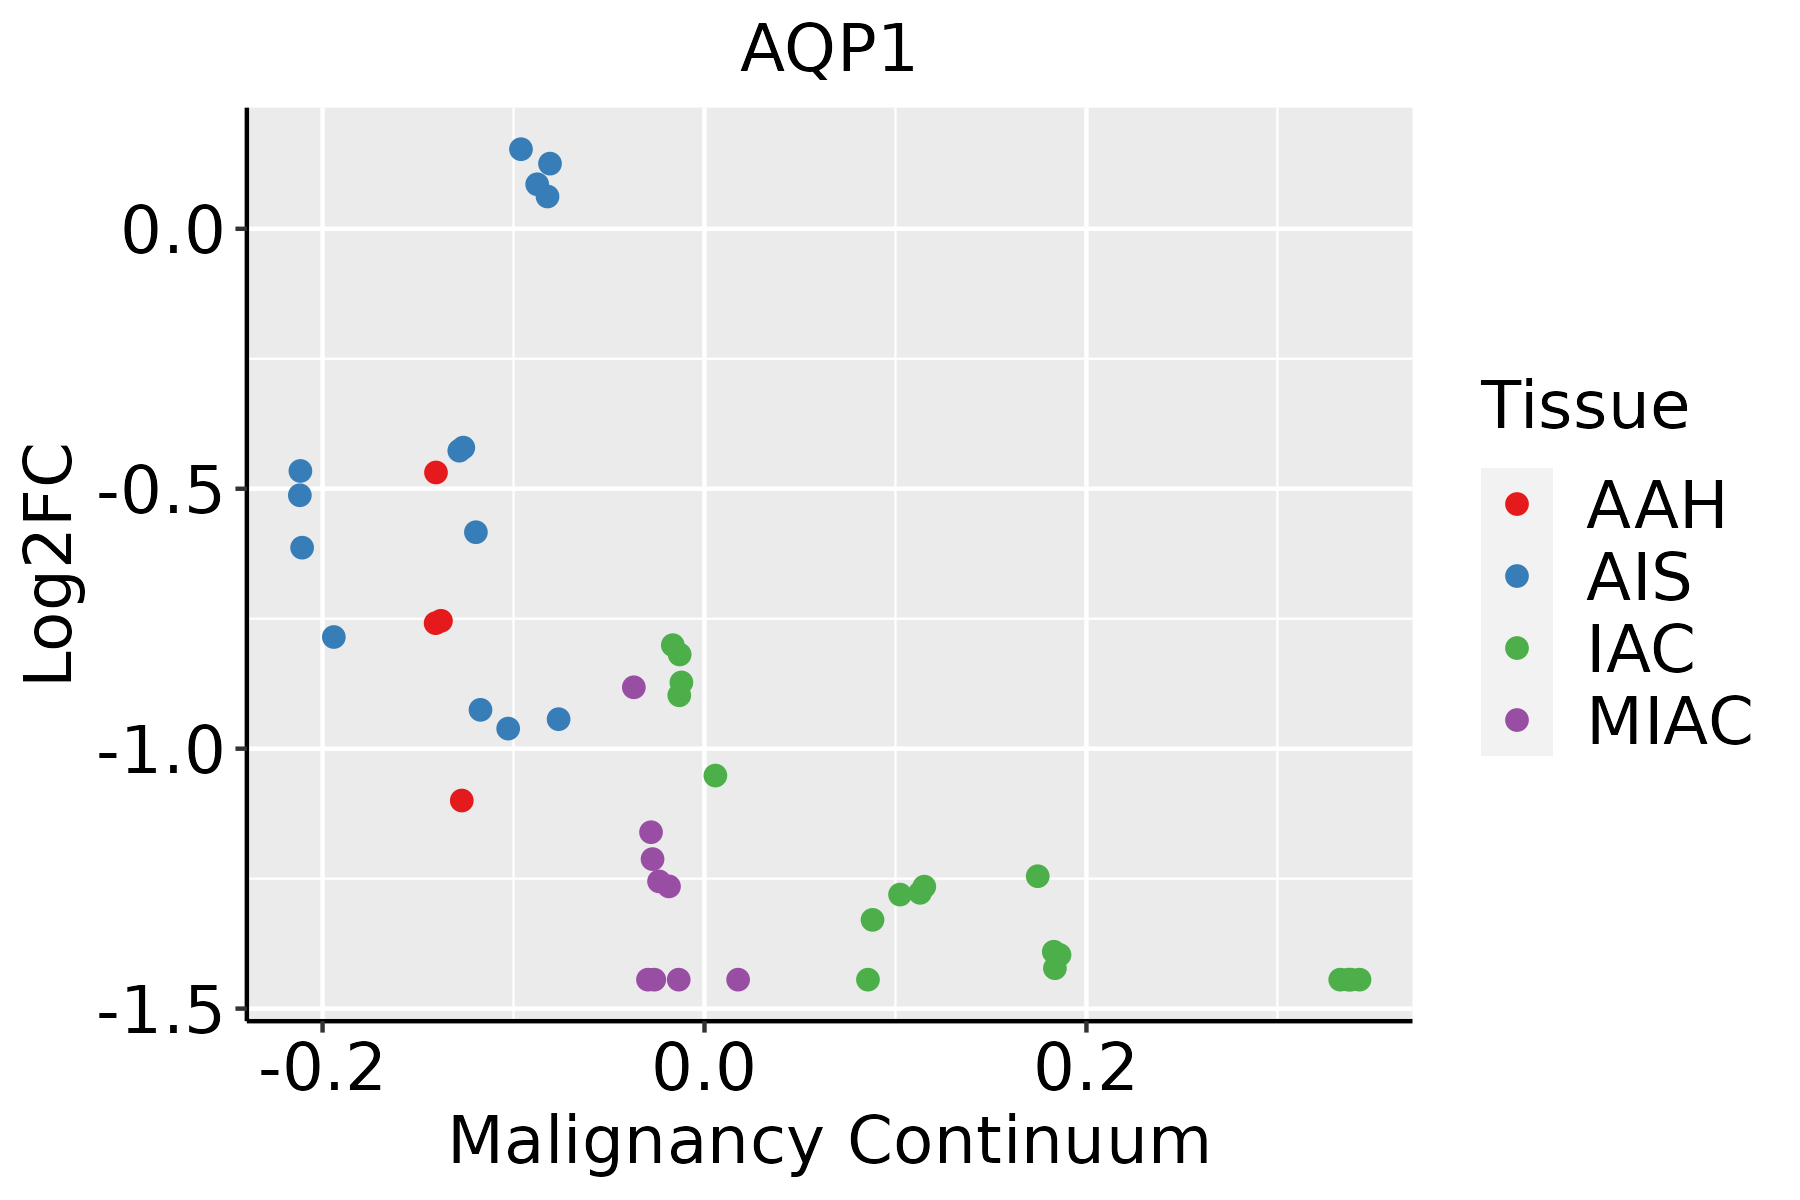 | AAH: Atypical adenomatous hyperplasia |
| AIS: Adenocarcinoma in situ | ||
| IAC: Invasive lung adenocarcinoma | ||
| MIA: Minimally invasive adenocarcinoma | ||
| Oral Cavity | 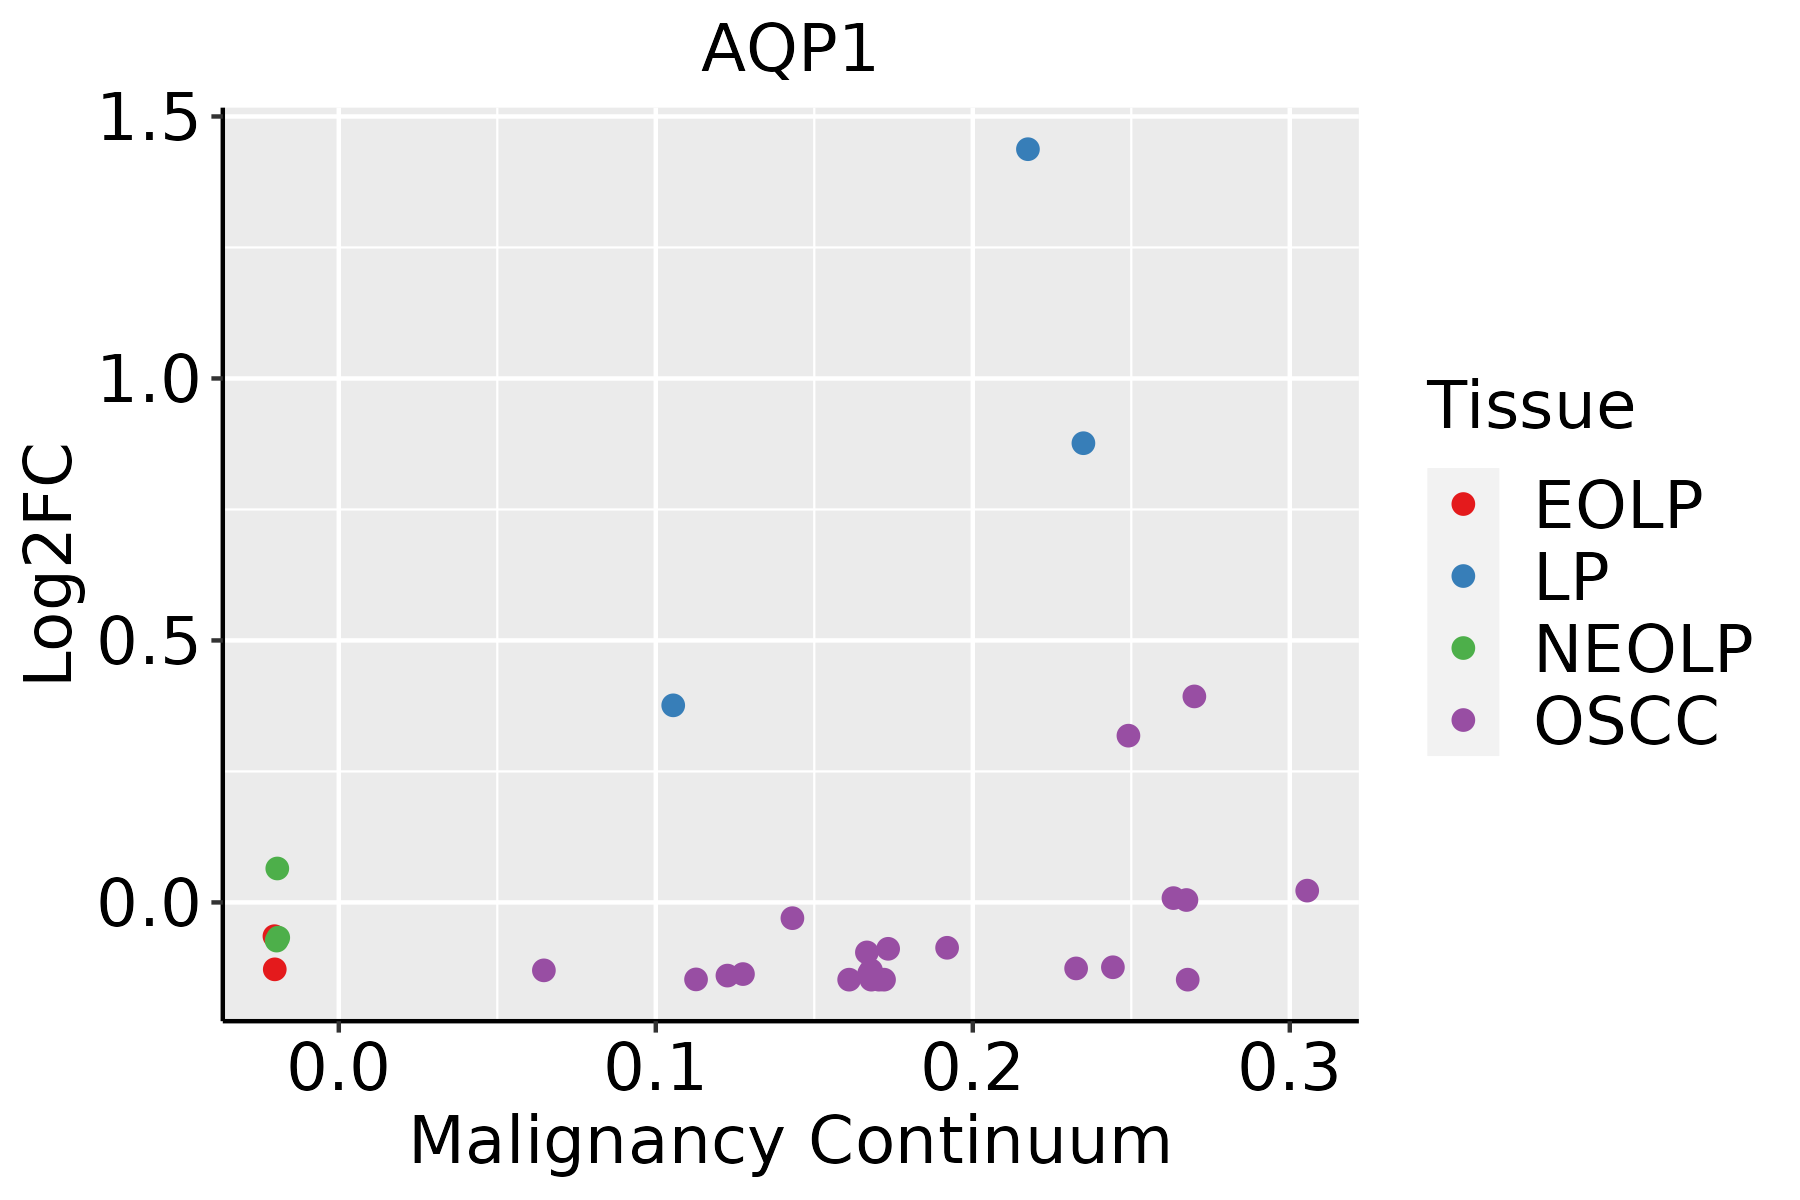 | EOLP: Erosive Oral lichen planus |
| LP: leukoplakia | ||
| NEOLP: Non-erosive oral lichen planus | ||
| OSCC: Oral squamous cell carcinoma |
| ∗log2FC in expression of this searched gene in stem-like cells from each diseased tissue sample relative to stem-like cells in normal samples in each tissue plotted against the malignancy continuum. Samples are colored based on if they are from different disease stage. |
Top |
Malignant transformation related pathway analysis |
| Find out the enriched GO biological processes and KEGG pathways involved in transition from healthy to precancer to cancer |
| Tissue | Disease Stage | Enriched GO biological Processes |
| Colorectum | AD |  |
| Colorectum | SER |  |
| Colorectum | MSS |  |
| Colorectum | MSI-H |  |
| Colorectum | FAP |  |
| ∗Top 15 enriched GO BP terms are showed in the bar plot of each disease state in each tissue. Each row represents a significant GO biological process which is colored according to the -log10(p.adjust). |
| Page: 1 2 3 4 5 6 7 8 9 |
| GO ID | Tissue | Disease Stage | Description | Gene Ratio | Bg Ratio | pvalue | p.adjust | Count |
| GO:0032535 | Colorectum | AD | regulation of cellular component size | 142/3918 | 383/18723 | 1.74e-13 | 3.41e-11 | 142 |
| GO:0006979 | Colorectum | AD | response to oxidative stress | 145/3918 | 446/18723 | 5.16e-09 | 3.23e-07 | 145 |
| GO:0062197 | Colorectum | AD | cellular response to chemical stress | 109/3918 | 337/18723 | 5.33e-07 | 1.95e-05 | 109 |
| GO:0007163 | Colorectum | AD | establishment or maintenance of cell polarity | 77/3918 | 218/18723 | 5.72e-07 | 2.08e-05 | 77 |
| GO:0000302 | Colorectum | AD | response to reactive oxygen species | 78/3918 | 222/18723 | 6.17e-07 | 2.21e-05 | 78 |
| GO:0071383 | Colorectum | AD | cellular response to steroid hormone stimulus | 73/3918 | 204/18723 | 6.31e-07 | 2.24e-05 | 73 |
| GO:0034599 | Colorectum | AD | cellular response to oxidative stress | 94/3918 | 288/18723 | 2.03e-06 | 6.02e-05 | 94 |
| GO:0043281 | Colorectum | AD | regulation of cysteine-type endopeptidase activity involved in apoptotic process | 72/3918 | 209/18723 | 3.70e-06 | 1.03e-04 | 72 |
| GO:2000116 | Colorectum | AD | regulation of cysteine-type endopeptidase activity | 79/3918 | 235/18723 | 3.74e-06 | 1.03e-04 | 79 |
| GO:0052547 | Colorectum | AD | regulation of peptidase activity | 137/3918 | 461/18723 | 4.12e-06 | 1.12e-04 | 137 |
| GO:0048545 | Colorectum | AD | response to steroid hormone | 104/3918 | 339/18723 | 1.33e-05 | 2.90e-04 | 104 |
| GO:0045861 | Colorectum | AD | negative regulation of proteolysis | 106/3918 | 351/18723 | 2.33e-05 | 4.57e-04 | 106 |
| GO:0042542 | Colorectum | AD | response to hydrogen peroxide | 52/3918 | 146/18723 | 2.83e-05 | 5.30e-04 | 52 |
| GO:0052548 | Colorectum | AD | regulation of endopeptidase activity | 124/3918 | 432/18723 | 6.58e-05 | 1.07e-03 | 124 |
| GO:0071496 | Colorectum | AD | cellular response to external stimulus | 94/3918 | 320/18723 | 1.98e-04 | 2.64e-03 | 94 |
| GO:0050878 | Colorectum | AD | regulation of body fluid levels | 108/3918 | 379/18723 | 2.54e-04 | 3.20e-03 | 108 |
| GO:0043154 | Colorectum | AD | negative regulation of cysteine-type endopeptidase activity involved in apoptotic process | 30/3918 | 78/18723 | 2.95e-04 | 3.59e-03 | 30 |
| GO:0010038 | Colorectum | AD | response to metal ion | 106/3918 | 373/18723 | 3.22e-04 | 3.83e-03 | 106 |
| GO:0051047 | Colorectum | AD | positive regulation of secretion | 90/3918 | 310/18723 | 4.11e-04 | 4.66e-03 | 90 |
| GO:0070482 | Colorectum | AD | response to oxygen levels | 99/3918 | 347/18723 | 4.29e-04 | 4.82e-03 | 99 |
| Page: 1 2 3 4 5 6 7 8 9 10 11 12 13 14 15 16 17 18 19 20 21 22 23 24 25 |
| Pathway ID | Tissue | Disease Stage | Description | Gene Ratio | Bg Ratio | pvalue | p.adjust | qvalue | Count |
| hsa04964 | Colorectum | AD | Proximal tubule bicarbonate reclamation | 11/2092 | 23/8465 | 1.35e-02 | 4.86e-02 | 3.10e-02 | 11 |
| hsa049641 | Colorectum | AD | Proximal tubule bicarbonate reclamation | 11/2092 | 23/8465 | 1.35e-02 | 4.86e-02 | 3.10e-02 | 11 |
| Page: 1 |
Top |
Cell-cell communication analysis |
| Identification of potential cell-cell interactions between two cell types and their ligand-receptor pairs for different disease states |
| Ligand | Receptor | LRpair | Pathway | Tissue | Disease Stage |
| Page: 1 |
Top |
Single-cell gene regulatory network inference analysis |
| Find out the significant the regulons (TFs) and the target genes of each regulon across cell types for different disease states |
| TF | Cell Type | Tissue | Disease Stage | Target Gene | RSS | Regulon Activity |
| ∗The dot plots of a searched regulon are shown for all cell subpopulations in each disease state of each tissue based on the regulon specific score inferred using pySCENIC and by calculating the average expression. |
| Page: 1 |
Top |
Somatic mutation of malignant transformation related genes |
| Annotation of somatic variants for genes involved in malignant transformation |
| Hugo Symbol | Variant Class | Variant Classification | dbSNP RS | HGVSc | HGVSp | HGVSp Short | SWISSPROT | BIOTYPE | SIFT | PolyPhen | Tumor Sample Barcode | Tissue | Histology | Sex | Age | Stage | Therapy Types | Drugs | Outcome |
| AQP1 | SNV | Missense_Mutation | rs183830991 | c.278N>A | p.Arg93His | p.R93H | P29972 | protein_coding | deleterious(0) | benign(0.372) | TCGA-AD-A5EJ-01 | Colorectum | colon adenocarcinoma | Female | >=65 | I/II | Unknown | Unknown | SD |
| AQP1 | SNV | Missense_Mutation | novel | c.191N>T | p.Ala64Val | p.A64V | P29972 | protein_coding | tolerated(1) | probably_damaging(0.95) | TCGA-AZ-4315-01 | Colorectum | colon adenocarcinoma | Male | <65 | I/II | Unknown | Unknown | SD |
| AQP1 | SNV | Missense_Mutation | c.659N>T | p.Gly220Val | p.G220V | P29972 | protein_coding | deleterious(0.03) | probably_damaging(0.955) | TCGA-CK-4951-01 | Colorectum | colon adenocarcinoma | Female | >=65 | I/II | Unknown | Unknown | PD | |
| AQP1 | deletion | Frame_Shift_Del | c.508delC | p.Ala171ProfsTer6 | p.A171Pfs*6 | P29972 | protein_coding | TCGA-WS-AB45-01 | Colorectum | colon adenocarcinoma | Female | <65 | I/II | Unknown | Unknown | SD | |||
| AQP1 | SNV | Missense_Mutation | rs767949083 | c.368C>T | p.Ser123Leu | p.S123L | P29972 | protein_coding | tolerated(0.05) | benign(0.005) | TCGA-A5-A0G2-01 | Endometrium | uterine corpus endometrioid carcinoma | Female | <65 | III/IV | Unknown | Unknown | SD |
| AQP1 | SNV | Missense_Mutation | novel | c.724G>A | p.Val242Met | p.V242M | P29972 | protein_coding | tolerated(0.23) | benign(0) | TCGA-A5-A0G2-01 | Endometrium | uterine corpus endometrioid carcinoma | Female | <65 | III/IV | Unknown | Unknown | SD |
| AQP1 | SNV | Missense_Mutation | rs375226621 | c.701G>A | p.Arg234His | p.R234H | P29972 | protein_coding | tolerated(0.21) | benign(0.001) | TCGA-A5-A1OF-01 | Endometrium | uterine corpus endometrioid carcinoma | Female | <65 | I/II | Unknown | Unknown | SD |
| AQP1 | SNV | Missense_Mutation | rs183830991 | c.278N>A | p.Arg93His | p.R93H | P29972 | protein_coding | deleterious(0) | benign(0.372) | TCGA-AJ-A2QO-01 | Endometrium | uterine corpus endometrioid carcinoma | Female | >=65 | I/II | Unknown | Unknown | SD |
| AQP1 | SNV | Missense_Mutation | rs748039521 | c.721N>T | p.Arg241Cys | p.R241C | P29972 | protein_coding | deleterious(0.01) | probably_damaging(0.959) | TCGA-AJ-A2QO-01 | Endometrium | uterine corpus endometrioid carcinoma | Female | >=65 | I/II | Unknown | Unknown | SD |
| AQP1 | SNV | Missense_Mutation | rs760251239 | c.98N>C | p.Leu33Pro | p.L33P | P29972 | protein_coding | deleterious(0) | probably_damaging(0.979) | TCGA-AP-A1DK-01 | Endometrium | uterine corpus endometrioid carcinoma | Female | <65 | I/II | Unknown | Unknown | SD |
| Page: 1 2 3 |
Top |
Related drugs of malignant transformation related genes |
| Identification of chemicals and drugs interact with genes involved in malignant transfromation |
| (DGIdb 4.0) |
| Entrez ID | Symbol | Category | Interaction Types | Drug Claim Name | Drug Name | PMIDs |
| 358 | AQP1 | ION CHANNEL, DRUGGABLE GENOME | Vitamin C | |||
| 358 | AQP1 | ION CHANNEL, DRUGGABLE GENOME | CARBONIC ANHYDRASE INHIBITOR | 14704128 | ||
| 358 | AQP1 | ION CHANNEL, DRUGGABLE GENOME | inhibitor | 178101032 | ||
| 358 | AQP1 | ION CHANNEL, DRUGGABLE GENOME | inhibitor | 178100948 | ||
| 358 | AQP1 | ION CHANNEL, DRUGGABLE GENOME | blocker | 405560380 | ||
| 358 | AQP1 | ION CHANNEL, DRUGGABLE GENOME | GLYBURIDE | GLYBURIDE | 14759764 | |
| 358 | AQP1 | ION CHANNEL, DRUGGABLE GENOME | DIMETHYL SULFOXIDE | 9374641 | ||
| 358 | AQP1 | ION CHANNEL, DRUGGABLE GENOME | inhibitor | 135650790 | ||
| 358 | AQP1 | ION CHANNEL, DRUGGABLE GENOME | GLUCOCORTICOID | 9374641 | ||
| 358 | AQP1 | ION CHANNEL, DRUGGABLE GENOME | ACETAZOLAMIDE | ACETAZOLAMIDE | 12147198 |
| Page: 1 2 |

Copyright 2023-Present -The University of Texas Health Science Center at Houston |