
|
|||||
|
 | |
| |
| |
| |
| |
| |
|
Gene: APTX |
Gene summary for APTX |
| Gene information | Species | Human | Gene symbol | APTX | Gene ID | 54840 |
| Gene name | aprataxin | |
| Gene Alias | AOA | |
| Cytomap | 9p21.1 | |
| Gene Type | protein-coding | GO ID | GO:0000012 | UniProtAcc | Q7Z2E3 |
Top |
Malignant transformation analysis |
| Identification of the aberrant gene expression in precancerous and cancerous lesions by comparing the gene expression of stem-like cells in diseased tissues with normal stem cells |
| Entrez ID | Symbol | Replicates | Species | Organ | Tissue | Adj P-value | Log2FC | Malignancy |
| 54840 | APTX | CCI_2 | Human | Cervix | CC | 1.82e-07 | 8.89e-01 | 0.5249 |
| 54840 | APTX | CCI_3 | Human | Cervix | CC | 3.46e-04 | 5.07e-01 | 0.516 |
| 54840 | APTX | LZE4T | Human | Esophagus | ESCC | 1.31e-21 | 6.03e-01 | 0.0811 |
| 54840 | APTX | LZE5T | Human | Esophagus | ESCC | 3.05e-05 | 3.18e-01 | 0.0514 |
| 54840 | APTX | LZE7T | Human | Esophagus | ESCC | 1.42e-09 | 6.28e-01 | 0.0667 |
| 54840 | APTX | LZE8T | Human | Esophagus | ESCC | 3.85e-11 | 3.15e-01 | 0.067 |
| 54840 | APTX | LZE20T | Human | Esophagus | ESCC | 3.64e-05 | 1.69e-01 | 0.0662 |
| 54840 | APTX | LZE24T | Human | Esophagus | ESCC | 2.97e-18 | 5.53e-01 | 0.0596 |
| 54840 | APTX | LZE21T | Human | Esophagus | ESCC | 3.39e-02 | 4.57e-01 | 0.0655 |
| 54840 | APTX | LZE6T | Human | Esophagus | ESCC | 2.53e-03 | 1.64e-01 | 0.0845 |
| 54840 | APTX | P1T-E | Human | Esophagus | ESCC | 1.78e-04 | 2.42e-01 | 0.0875 |
| 54840 | APTX | P2T-E | Human | Esophagus | ESCC | 1.71e-36 | 7.60e-01 | 0.1177 |
| 54840 | APTX | P4T-E | Human | Esophagus | ESCC | 2.92e-16 | 4.47e-01 | 0.1323 |
| 54840 | APTX | P5T-E | Human | Esophagus | ESCC | 5.98e-36 | 7.42e-01 | 0.1327 |
| 54840 | APTX | P8T-E | Human | Esophagus | ESCC | 9.36e-14 | 1.71e-01 | 0.0889 |
| 54840 | APTX | P9T-E | Human | Esophagus | ESCC | 1.24e-13 | 4.24e-01 | 0.1131 |
| 54840 | APTX | P10T-E | Human | Esophagus | ESCC | 1.63e-15 | 4.13e-01 | 0.116 |
| 54840 | APTX | P11T-E | Human | Esophagus | ESCC | 1.15e-14 | 5.48e-01 | 0.1426 |
| 54840 | APTX | P12T-E | Human | Esophagus | ESCC | 2.33e-25 | 5.23e-01 | 0.1122 |
| 54840 | APTX | P15T-E | Human | Esophagus | ESCC | 4.22e-24 | 4.77e-01 | 0.1149 |
| Page: 1 2 3 4 5 |
| Tissue | Expression Dynamics | Abbreviation |
| Cervix |  | CC: Cervix cancer |
| HSIL_HPV: HPV-infected high-grade squamous intraepithelial lesions | ||
| N_HPV: HPV-infected normal cervix | ||
| Esophagus | 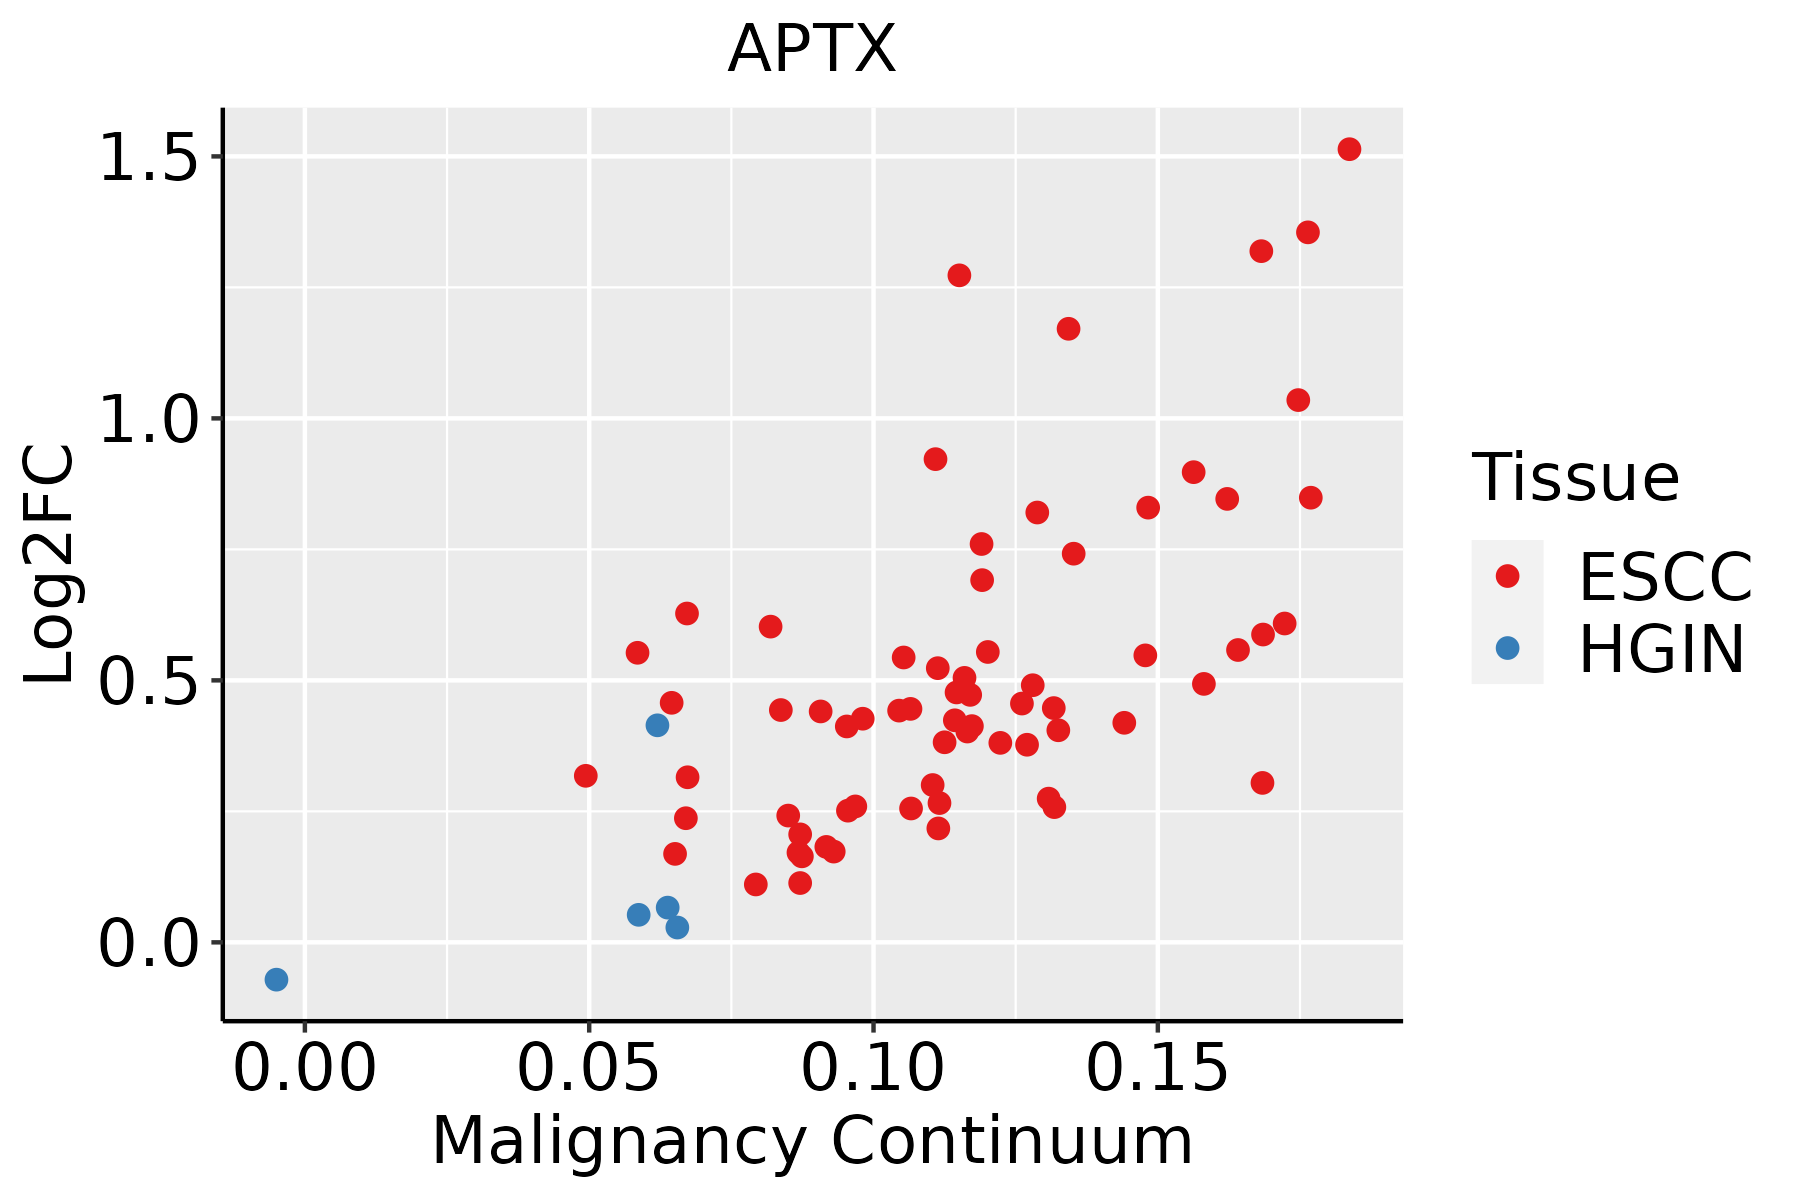 | ESCC: Esophageal squamous cell carcinoma |
| HGIN: High-grade intraepithelial neoplasias | ||
| LGIN: Low-grade intraepithelial neoplasias | ||
| Oral Cavity |  | EOLP: Erosive Oral lichen planus |
| LP: leukoplakia | ||
| NEOLP: Non-erosive oral lichen planus | ||
| OSCC: Oral squamous cell carcinoma | ||
| Skin | 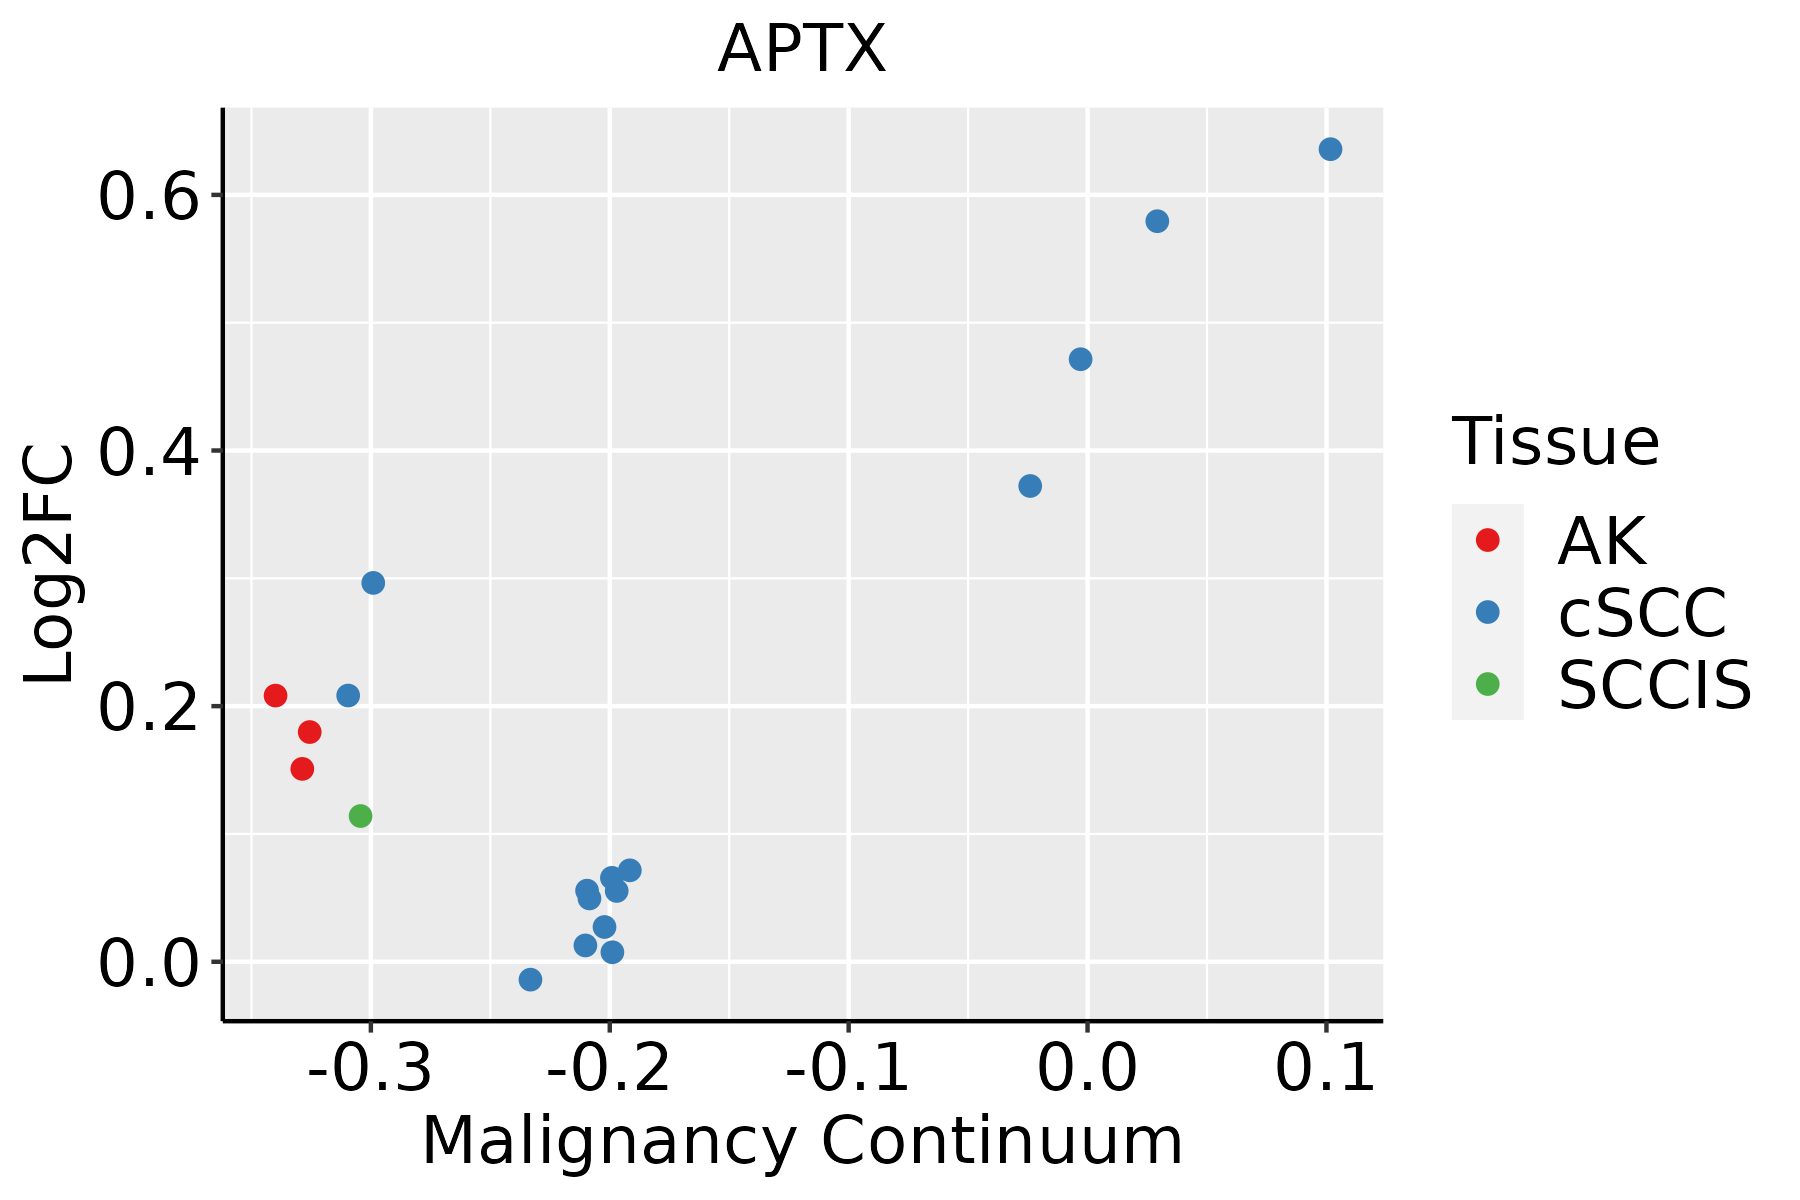 | AK: Actinic keratosis |
| cSCC: Cutaneous squamous cell carcinoma | ||
| SCCIS:squamous cell carcinoma in situ |
| ∗log2FC in expression of this searched gene in stem-like cells from each diseased tissue sample relative to stem-like cells in normal samples in each tissue plotted against the malignancy continuum. Samples are colored based on if they are from different disease stage. |
Top |
Malignant transformation related pathway analysis |
| Find out the enriched GO biological processes and KEGG pathways involved in transition from healthy to precancer to cancer |
| Tissue | Disease Stage | Enriched GO biological Processes |
| Colorectum | AD |  |
| Colorectum | SER |  |
| Colorectum | MSS |  |
| Colorectum | MSI-H |  |
| Colorectum | FAP |  |
| ∗Top 15 enriched GO BP terms are showed in the bar plot of each disease state in each tissue. Each row represents a significant GO biological process which is colored according to the -log10(p.adjust). |
| Page: 1 2 3 4 5 6 7 8 9 |
| GO ID | Tissue | Disease Stage | Description | Gene Ratio | Bg Ratio | pvalue | p.adjust | Count |
| GO:000697910 | Cervix | CC | response to oxidative stress | 102/2311 | 446/18723 | 2.99e-10 | 4.36e-08 | 102 |
| GO:000030210 | Cervix | CC | response to reactive oxygen species | 56/2311 | 222/18723 | 1.00e-07 | 5.25e-06 | 56 |
| GO:004254210 | Cervix | CC | response to hydrogen peroxide | 40/2311 | 146/18723 | 6.79e-07 | 2.46e-05 | 40 |
| GO:003164710 | Cervix | CC | regulation of protein stability | 63/2311 | 298/18723 | 1.14e-05 | 2.45e-04 | 63 |
| GO:00163117 | Cervix | CC | dephosphorylation | 73/2311 | 417/18723 | 1.23e-03 | 9.87e-03 | 73 |
| GO:0031647111 | Esophagus | ESCC | regulation of protein stability | 223/8552 | 298/18723 | 5.76e-25 | 1.52e-22 | 223 |
| GO:0006979111 | Esophagus | ESCC | response to oxidative stress | 303/8552 | 446/18723 | 7.15e-22 | 1.30e-19 | 303 |
| GO:0000302111 | Esophagus | ESCC | response to reactive oxygen species | 150/8552 | 222/18723 | 3.06e-11 | 1.02e-09 | 150 |
| GO:001631110 | Esophagus | ESCC | dephosphorylation | 251/8552 | 417/18723 | 1.26e-09 | 2.99e-08 | 251 |
| GO:0042542111 | Esophagus | ESCC | response to hydrogen peroxide | 102/8552 | 146/18723 | 2.64e-09 | 5.81e-08 | 102 |
| GO:00903053 | Esophagus | ESCC | nucleic acid phosphodiester bond hydrolysis | 163/8552 | 261/18723 | 3.07e-08 | 5.73e-07 | 163 |
| GO:00063024 | Esophagus | ESCC | double-strand break repair | 152/8552 | 251/18723 | 1.33e-06 | 1.62e-05 | 152 |
| GO:00062661 | Esophagus | ESCC | DNA ligation | 13/8552 | 16/18723 | 4.05e-03 | 1.62e-02 | 13 |
| GO:000697920 | Oral cavity | OSCC | response to oxidative stress | 273/7305 | 446/18723 | 8.35e-22 | 1.65e-19 | 273 |
| GO:003164720 | Oral cavity | OSCC | regulation of protein stability | 193/7305 | 298/18723 | 1.30e-19 | 1.95e-17 | 193 |
| GO:000030220 | Oral cavity | OSCC | response to reactive oxygen species | 143/7305 | 222/18723 | 1.32e-14 | 7.88e-13 | 143 |
| GO:004254219 | Oral cavity | OSCC | response to hydrogen peroxide | 101/7305 | 146/18723 | 1.30e-13 | 6.66e-12 | 101 |
| GO:00163119 | Oral cavity | OSCC | dephosphorylation | 220/7305 | 417/18723 | 6.33e-09 | 1.34e-07 | 220 |
| GO:00903052 | Oral cavity | OSCC | nucleic acid phosphodiester bond hydrolysis | 142/7305 | 261/18723 | 2.90e-07 | 4.43e-06 | 142 |
| GO:00063023 | Oral cavity | OSCC | double-strand break repair | 132/7305 | 251/18723 | 7.93e-06 | 8.52e-05 | 132 |
| Page: 1 2 3 |
| Pathway ID | Tissue | Disease Stage | Description | Gene Ratio | Bg Ratio | pvalue | p.adjust | qvalue | Count |
| hsa034104 | Esophagus | ESCC | Base excision repair | 38/4205 | 44/8465 | 3.59e-07 | 2.62e-06 | 1.34e-06 | 38 |
| hsa0341011 | Esophagus | ESCC | Base excision repair | 38/4205 | 44/8465 | 3.59e-07 | 2.62e-06 | 1.34e-06 | 38 |
| hsa03410 | Oral cavity | OSCC | Base excision repair | 32/3704 | 44/8465 | 9.11e-05 | 3.25e-04 | 1.65e-04 | 32 |
| hsa034101 | Oral cavity | OSCC | Base excision repair | 32/3704 | 44/8465 | 9.11e-05 | 3.25e-04 | 1.65e-04 | 32 |
| hsa034102 | Oral cavity | LP | Base excision repair | 23/2418 | 44/8465 | 7.66e-04 | 3.75e-03 | 2.42e-03 | 23 |
| hsa034103 | Oral cavity | LP | Base excision repair | 23/2418 | 44/8465 | 7.66e-04 | 3.75e-03 | 2.42e-03 | 23 |
| Page: 1 |
Top |
Cell-cell communication analysis |
| Identification of potential cell-cell interactions between two cell types and their ligand-receptor pairs for different disease states |
| Ligand | Receptor | LRpair | Pathway | Tissue | Disease Stage |
| Page: 1 |
Top |
Single-cell gene regulatory network inference analysis |
| Find out the significant the regulons (TFs) and the target genes of each regulon across cell types for different disease states |
| TF | Cell Type | Tissue | Disease Stage | Target Gene | RSS | Regulon Activity |
| ∗The dot plots of a searched regulon are shown for all cell subpopulations in each disease state of each tissue based on the regulon specific score inferred using pySCENIC and by calculating the average expression. |
| Page: 1 |
Top |
Somatic mutation of malignant transformation related genes |
| Annotation of somatic variants for genes involved in malignant transformation |
| Hugo Symbol | Variant Class | Variant Classification | dbSNP RS | HGVSc | HGVSp | HGVSp Short | SWISSPROT | BIOTYPE | SIFT | PolyPhen | Tumor Sample Barcode | Tissue | Histology | Sex | Age | Stage | Therapy Types | Drugs | Outcome |
| APTX | SNV | Missense_Mutation | rs149867156 | c.883N>A | p.Glu295Lys | p.E295K | Q7Z2E3 | protein_coding | tolerated(0.48) | benign(0) | TCGA-AN-A046-01 | Breast | breast invasive carcinoma | Female | >=65 | I/II | Unknown | Unknown | SD |
| APTX | SNV | Missense_Mutation | c.103A>T | p.Ile35Phe | p.I35F | Q7Z2E3 | protein_coding | deleterious(0) | probably_damaging(0.999) | TCGA-AN-A0FZ-01 | Breast | breast invasive carcinoma | Female | <65 | III/IV | Unknown | Unknown | SD | |
| APTX | SNV | Missense_Mutation | c.649N>A | p.Ala217Thr | p.A217T | Q7Z2E3 | protein_coding | tolerated(1) | benign(0) | TCGA-AQ-A04J-01 | Breast | breast invasive carcinoma | Female | <65 | I/II | Chemotherapy | cytoxan | SD | |
| APTX | SNV | Missense_Mutation | c.473N>G | p.Pro158Arg | p.P158R | Q7Z2E3 | protein_coding | tolerated(0.51) | benign(0.021) | TCGA-BH-A0AV-01 | Breast | breast invasive carcinoma | Female | <65 | I/II | Chemotherapy | taxotere | CR | |
| APTX | SNV | Missense_Mutation | c.470N>G | p.Ala157Gly | p.A157G | Q7Z2E3 | protein_coding | tolerated(0.26) | benign(0.001) | TCGA-BH-A0E2-01 | Breast | breast invasive carcinoma | Female | <65 | III/IV | Chemotherapy | doxorubicin | SD | |
| APTX | SNV | Missense_Mutation | novel | c.461N>A | p.Gly154Glu | p.G154E | Q7Z2E3 | protein_coding | tolerated(0.44) | benign(0) | TCGA-2W-A8YY-01 | Cervix | cervical & endocervical cancer | Female | <65 | I/II | Chemotherapy | cisplatin | CR |
| APTX | SNV | Missense_Mutation | c.991N>G | p.Gln331Glu | p.Q331E | Q7Z2E3 | protein_coding | tolerated(0.22) | benign(0.053) | TCGA-IR-A3LH-01 | Cervix | cervical & endocervical cancer | Female | <65 | I/II | Chemotherapy | cisplatin | CR | |
| APTX | SNV | Missense_Mutation | novel | c.533N>A | p.Pro178His | p.P178H | Q7Z2E3 | protein_coding | deleterious(0) | probably_damaging(0.971) | TCGA-AZ-4315-01 | Colorectum | colon adenocarcinoma | Male | <65 | I/II | Unknown | Unknown | SD |
| APTX | SNV | Missense_Mutation | novel | c.176N>C | p.Lys59Thr | p.K59T | Q7Z2E3 | protein_coding | deleterious(0) | possibly_damaging(0.838) | TCGA-AZ-4315-01 | Colorectum | colon adenocarcinoma | Male | <65 | I/II | Unknown | Unknown | SD |
| APTX | SNV | Missense_Mutation | rs746257545 | c.8G>A | p.Arg3Gln | p.R3Q | Q7Z2E3 | protein_coding | tolerated(0.23) | benign(0.006) | TCGA-AZ-6598-01 | Colorectum | colon adenocarcinoma | Female | >=65 | I/II | Unknown | Unknown | SD |
| Page: 1 2 3 |
Top |
Related drugs of malignant transformation related genes |
| Identification of chemicals and drugs interact with genes involved in malignant transfromation |
| (DGIdb 4.0) |
| Entrez ID | Symbol | Category | Interaction Types | Drug Claim Name | Drug Name | PMIDs |
| Page: 1 |

Copyright 2023-Present -The University of Texas Health Science Center at Houston |