
|
|||||
|
 | |
| |
| |
| |
| |
| |
|
Gene: APRT |
Gene summary for APRT |
| Gene information | Species | Human | Gene symbol | APRT | Gene ID | 353 |
| Gene name | adenine phosphoribosyltransferase | |
| Gene Alias | AMP | |
| Cytomap | 16q24.3 | |
| Gene Type | protein-coding | GO ID | GO:0006139 | UniProtAcc | P07741 |
Top |
Malignant transformation analysis |
| Identification of the aberrant gene expression in precancerous and cancerous lesions by comparing the gene expression of stem-like cells in diseased tissues with normal stem cells |
| Entrez ID | Symbol | Replicates | Species | Organ | Tissue | Adj P-value | Log2FC | Malignancy |
| 353 | APRT | GSM4909286 | Human | Breast | IDC | 1.66e-05 | 2.08e-01 | 0.1081 |
| 353 | APRT | GSM4909288 | Human | Breast | IDC | 7.20e-09 | 7.16e-02 | 0.0988 |
| 353 | APRT | GSM4909291 | Human | Breast | IDC | 4.51e-05 | 2.59e-01 | 0.1753 |
| 353 | APRT | GSM4909294 | Human | Breast | IDC | 1.92e-26 | 4.04e-01 | 0.2022 |
| 353 | APRT | GSM4909296 | Human | Breast | IDC | 1.37e-28 | 2.64e-01 | 0.1524 |
| 353 | APRT | GSM4909297 | Human | Breast | IDC | 1.53e-32 | -4.88e-01 | 0.1517 |
| 353 | APRT | GSM4909304 | Human | Breast | IDC | 2.26e-27 | 5.38e-01 | 0.1636 |
| 353 | APRT | GSM4909309 | Human | Breast | IDC | 2.44e-04 | -2.68e-01 | 0.0483 |
| 353 | APRT | GSM4909311 | Human | Breast | IDC | 1.11e-49 | -5.29e-01 | 0.1534 |
| 353 | APRT | GSM4909312 | Human | Breast | IDC | 4.52e-22 | -3.35e-01 | 0.1552 |
| 353 | APRT | GSM4909313 | Human | Breast | IDC | 1.88e-05 | -2.95e-01 | 0.0391 |
| 353 | APRT | GSM4909315 | Human | Breast | IDC | 4.23e-02 | -2.91e-02 | 0.21 |
| 353 | APRT | GSM4909316 | Human | Breast | IDC | 5.81e-13 | 2.77e-01 | 0.21 |
| 353 | APRT | GSM4909318 | Human | Breast | IDC | 1.54e-06 | 3.24e-01 | 0.2031 |
| 353 | APRT | GSM4909319 | Human | Breast | IDC | 6.03e-67 | -3.96e-01 | 0.1563 |
| 353 | APRT | GSM4909320 | Human | Breast | IDC | 1.06e-16 | 1.17e-01 | 0.1575 |
| 353 | APRT | GSM4909321 | Human | Breast | IDC | 4.17e-29 | 4.59e-02 | 0.1559 |
| 353 | APRT | brca1 | Human | Breast | Precancer | 2.51e-26 | 5.29e-01 | -0.0338 |
| 353 | APRT | brca2 | Human | Breast | Precancer | 2.59e-04 | 2.82e-01 | -0.024 |
| 353 | APRT | M2 | Human | Breast | IDC | 3.45e-26 | 6.64e-01 | 0.21 |
| Page: 1 2 3 4 5 6 7 8 9 10 11 12 13 14 |
| Tissue | Expression Dynamics | Abbreviation |
| Breast | 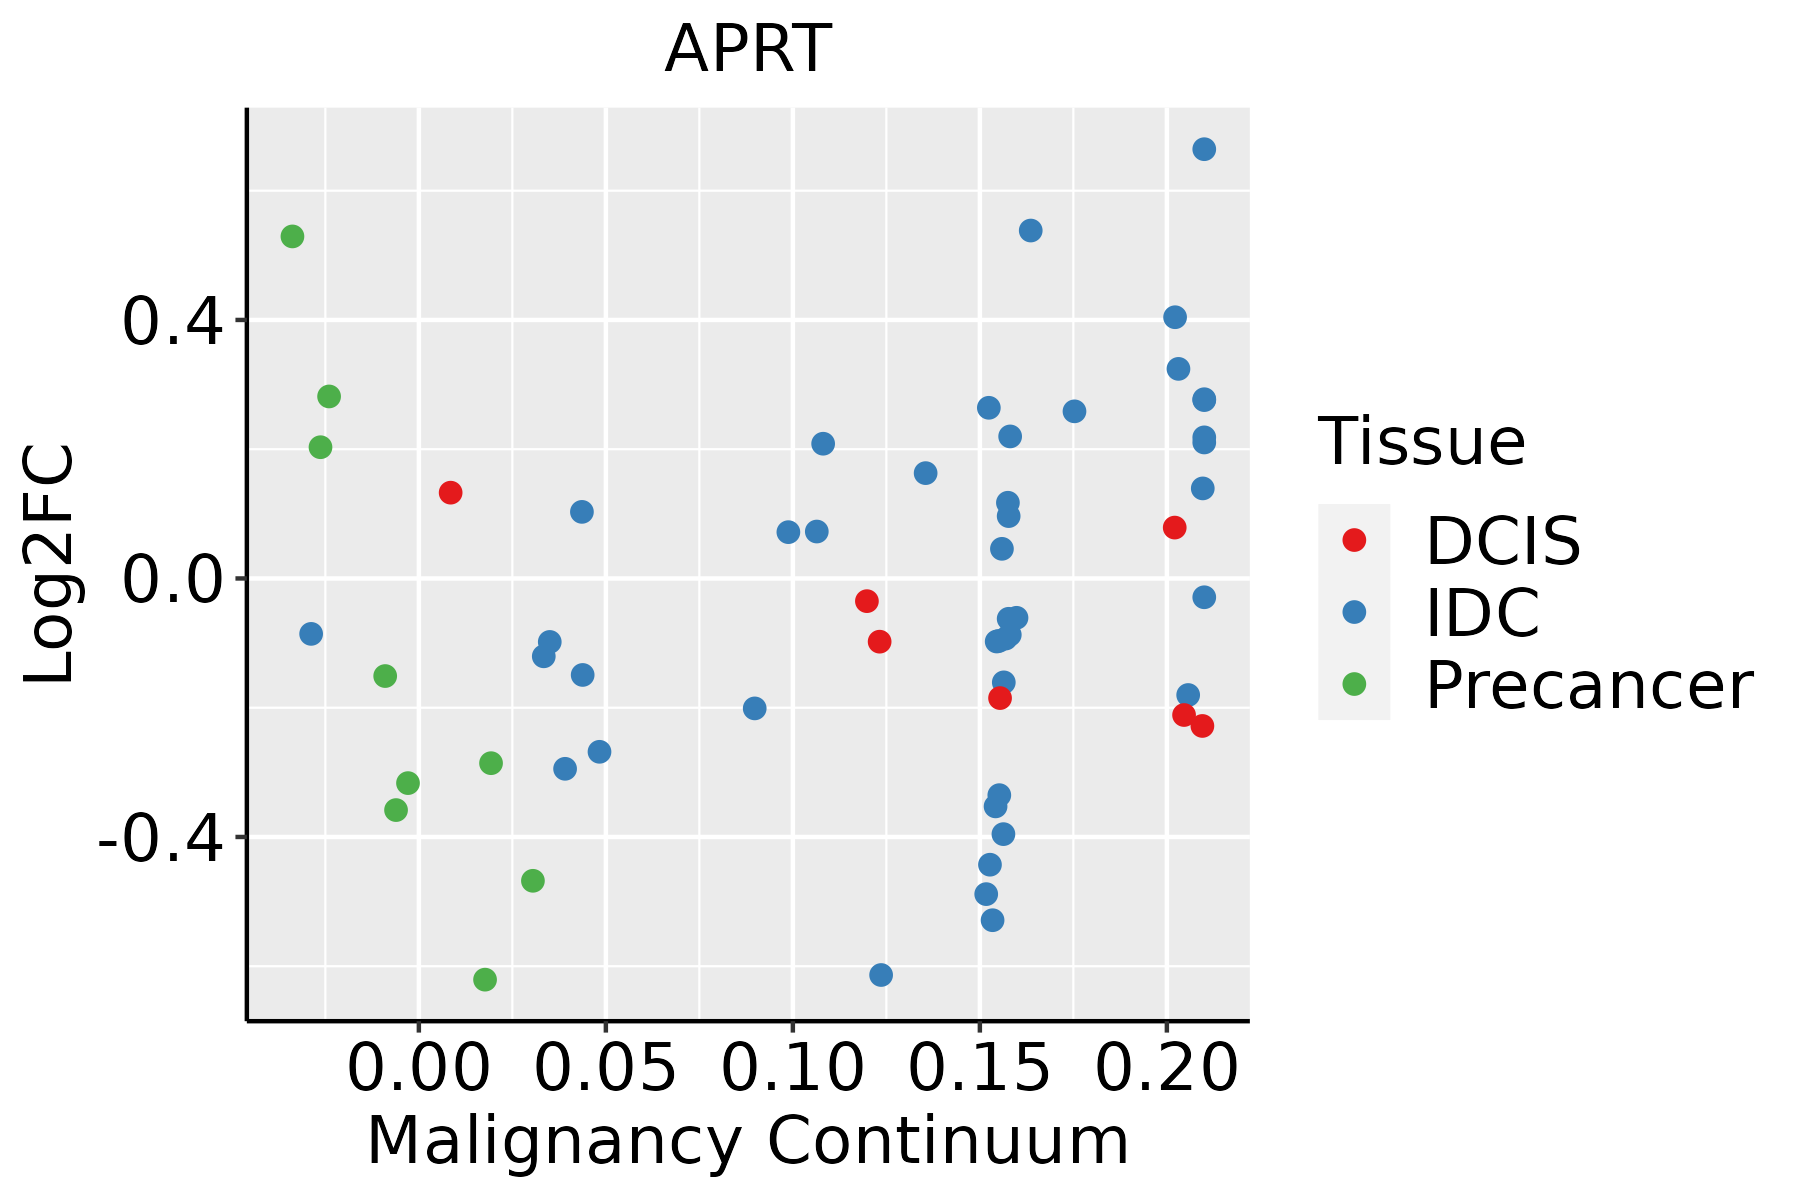 | IDC: Invasive ductal carcinoma |
| DCIS: Ductal carcinoma in situ | ||
| Precancer(BRCA1-mut): Precancerous lesion from BRCA1 mutation carriers | ||
| Cervix |  | CC: Cervix cancer |
| HSIL_HPV: HPV-infected high-grade squamous intraepithelial lesions | ||
| N_HPV: HPV-infected normal cervix | ||
| Colorectum (GSE201348) |  | FAP: Familial adenomatous polyposis |
| CRC: Colorectal cancer | ||
| Colorectum (HTA11) |  | AD: Adenomas |
| SER: Sessile serrated lesions | ||
| MSI-H: Microsatellite-high colorectal cancer | ||
| MSS: Microsatellite stable colorectal cancer | ||
| Endometrium |  | AEH: Atypical endometrial hyperplasia |
| EEC: Endometrioid Cancer | ||
| Esophagus |  | ESCC: Esophageal squamous cell carcinoma |
| HGIN: High-grade intraepithelial neoplasias | ||
| LGIN: Low-grade intraepithelial neoplasias | ||
| GC |  | CAG: Chronic atrophic gastritis |
| CAG with IM: Chronic atrophic gastritis with intestinal metaplasia | ||
| CSG: Chronic superficial gastritis | ||
| GC: Gastric cancer | ||
| SIM: Severe intestinal metaplasia | ||
| WIM: Wild intestinal metaplasia | ||
| Liver |  | HCC: Hepatocellular carcinoma |
| NAFLD: Non-alcoholic fatty liver disease | ||
| Oral Cavity | 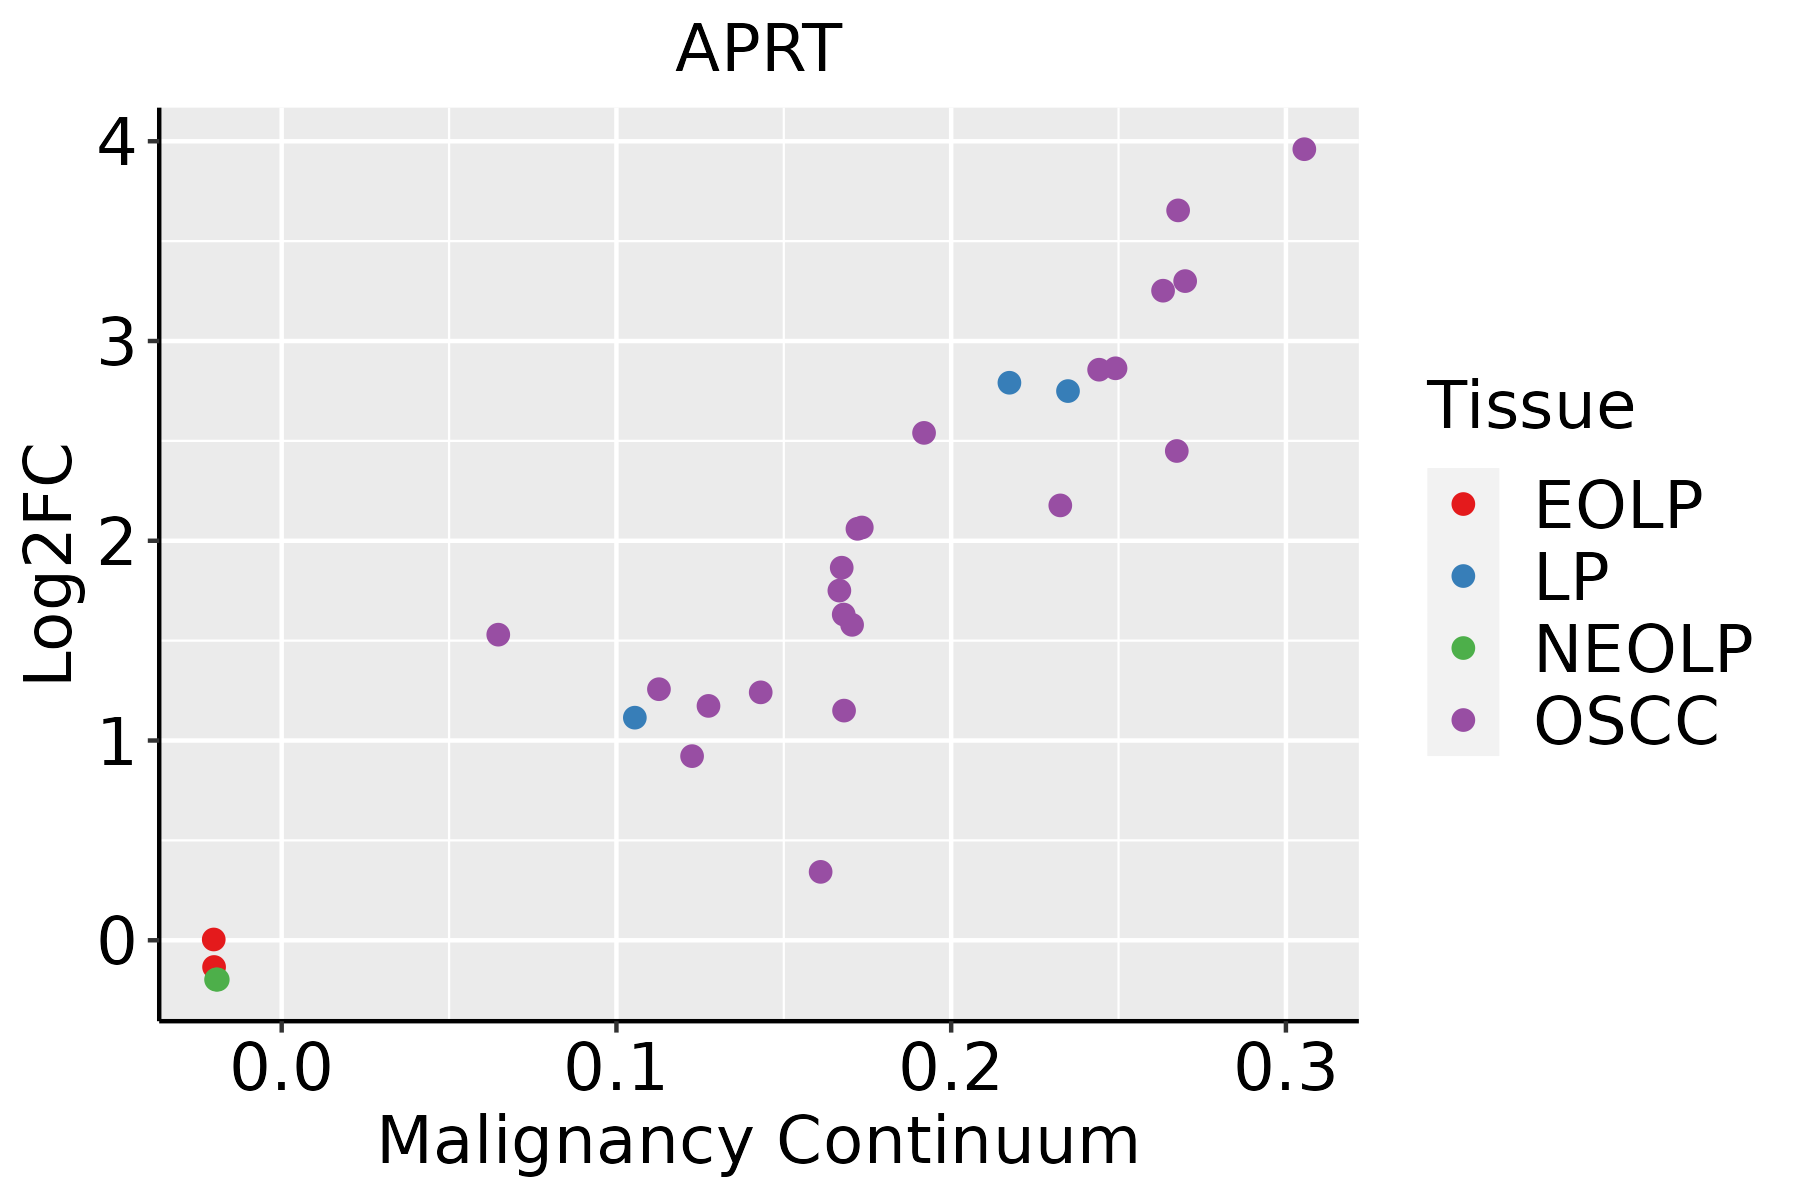 | EOLP: Erosive Oral lichen planus |
| LP: leukoplakia | ||
| NEOLP: Non-erosive oral lichen planus | ||
| OSCC: Oral squamous cell carcinoma | ||
| Prostate |  | BPH: Benign Prostatic Hyperplasia |
| Skin |  | AK: Actinic keratosis |
| cSCC: Cutaneous squamous cell carcinoma | ||
| SCCIS:squamous cell carcinoma in situ | ||
| Thyroid |  | ATC: Anaplastic thyroid cancer |
| HT: Hashimoto's thyroiditis | ||
| PTC: Papillary thyroid cancer |
| ∗log2FC in expression of this searched gene in stem-like cells from each diseased tissue sample relative to stem-like cells in normal samples in each tissue plotted against the malignancy continuum. Samples are colored based on if they are from different disease stage. |
Top |
Malignant transformation related pathway analysis |
| Find out the enriched GO biological processes and KEGG pathways involved in transition from healthy to precancer to cancer |
| Tissue | Disease Stage | Enriched GO biological Processes |
| Colorectum | AD |  |
| Colorectum | SER |  |
| Colorectum | MSS |  |
| Colorectum | MSI-H |  |
| Colorectum | FAP |  |
| ∗Top 15 enriched GO BP terms are showed in the bar plot of each disease state in each tissue. Each row represents a significant GO biological process which is colored according to the -log10(p.adjust). |
| Page: 1 2 3 4 5 6 7 8 9 |
| GO ID | Tissue | Disease Stage | Description | Gene Ratio | Bg Ratio | pvalue | p.adjust | Count |
| GO:00196938 | Breast | Precancer | ribose phosphate metabolic process | 49/1080 | 396/18723 | 3.81e-07 | 1.78e-05 | 49 |
| GO:00091528 | Breast | Precancer | purine ribonucleotide biosynthetic process | 28/1080 | 169/18723 | 4.17e-07 | 1.89e-05 | 28 |
| GO:00463907 | Breast | Precancer | ribose phosphate biosynthetic process | 30/1080 | 190/18723 | 4.75e-07 | 2.11e-05 | 30 |
| GO:00092607 | Breast | Precancer | ribonucleotide biosynthetic process | 29/1080 | 182/18723 | 6.05e-07 | 2.55e-05 | 29 |
| GO:00091509 | Breast | Precancer | purine ribonucleotide metabolic process | 46/1080 | 368/18723 | 6.47e-07 | 2.71e-05 | 46 |
| GO:00091179 | Breast | Precancer | nucleotide metabolic process | 56/1080 | 489/18723 | 7.40e-07 | 3.00e-05 | 56 |
| GO:00092598 | Breast | Precancer | ribonucleotide metabolic process | 47/1080 | 385/18723 | 9.69e-07 | 3.84e-05 | 47 |
| GO:00067539 | Breast | Precancer | nucleoside phosphate metabolic process | 56/1080 | 497/18723 | 1.24e-06 | 4.70e-05 | 56 |
| GO:00061639 | Breast | Precancer | purine nucleotide metabolic process | 47/1080 | 396/18723 | 2.14e-06 | 7.50e-05 | 47 |
| GO:00061647 | Breast | Precancer | purine nucleotide biosynthetic process | 28/1080 | 191/18723 | 5.04e-06 | 1.52e-04 | 28 |
| GO:00487329 | Breast | Precancer | gland development | 49/1080 | 436/18723 | 6.11e-06 | 1.73e-04 | 49 |
| GO:00725219 | Breast | Precancer | purine-containing compound metabolic process | 47/1080 | 416/18723 | 8.19e-06 | 2.20e-04 | 47 |
| GO:00725227 | Breast | Precancer | purine-containing compound biosynthetic process | 28/1080 | 200/18723 | 1.23e-05 | 3.17e-04 | 28 |
| GO:00091655 | Breast | Precancer | nucleotide biosynthetic process | 32/1080 | 254/18723 | 2.72e-05 | 6.21e-04 | 32 |
| GO:19012935 | Breast | Precancer | nucleoside phosphate biosynthetic process | 32/1080 | 256/18723 | 3.18e-05 | 6.97e-04 | 32 |
| GO:00508789 | Breast | Precancer | regulation of body fluid levels | 40/1080 | 379/18723 | 1.68e-04 | 2.77e-03 | 40 |
| GO:00308796 | Breast | Precancer | mammary gland development | 16/1080 | 137/18723 | 5.59e-03 | 4.07e-02 | 16 |
| GO:000915214 | Breast | IDC | purine ribonucleotide biosynthetic process | 34/1434 | 169/18723 | 1.63e-07 | 8.92e-06 | 34 |
| GO:004639013 | Breast | IDC | ribose phosphate biosynthetic process | 36/1434 | 190/18723 | 3.40e-07 | 1.73e-05 | 36 |
| GO:000926013 | Breast | IDC | ribonucleotide biosynthetic process | 35/1434 | 182/18723 | 3.40e-07 | 1.73e-05 | 35 |
| Page: 1 2 3 4 5 6 7 8 9 10 11 12 13 14 15 16 17 18 19 20 21 22 23 24 25 26 27 28 29 30 31 32 33 |
| Pathway ID | Tissue | Disease Stage | Description | Gene Ratio | Bg Ratio | pvalue | p.adjust | qvalue | Count |
| hsa012325 | Esophagus | ESCC | Nucleotide metabolism | 59/4205 | 85/8465 | 1.67e-04 | 6.58e-04 | 3.37e-04 | 59 |
| hsa0123212 | Esophagus | ESCC | Nucleotide metabolism | 59/4205 | 85/8465 | 1.67e-04 | 6.58e-04 | 3.37e-04 | 59 |
| hsa012322 | Liver | HCC | Nucleotide metabolism | 59/4020 | 85/8465 | 3.30e-05 | 1.88e-04 | 1.04e-04 | 59 |
| hsa012323 | Liver | HCC | Nucleotide metabolism | 59/4020 | 85/8465 | 3.30e-05 | 1.88e-04 | 1.04e-04 | 59 |
| hsa012324 | Oral cavity | OSCC | Nucleotide metabolism | 54/3704 | 85/8465 | 1.78e-04 | 5.95e-04 | 3.03e-04 | 54 |
| hsa0123211 | Oral cavity | OSCC | Nucleotide metabolism | 54/3704 | 85/8465 | 1.78e-04 | 5.95e-04 | 3.03e-04 | 54 |
| hsa0123221 | Oral cavity | LP | Nucleotide metabolism | 42/2418 | 85/8465 | 3.62e-05 | 2.36e-04 | 1.52e-04 | 42 |
| hsa0123231 | Oral cavity | LP | Nucleotide metabolism | 42/2418 | 85/8465 | 3.62e-05 | 2.36e-04 | 1.52e-04 | 42 |
| Page: 1 |
Top |
Cell-cell communication analysis |
| Identification of potential cell-cell interactions between two cell types and their ligand-receptor pairs for different disease states |
| Ligand | Receptor | LRpair | Pathway | Tissue | Disease Stage |
| Page: 1 |
Top |
Single-cell gene regulatory network inference analysis |
| Find out the significant the regulons (TFs) and the target genes of each regulon across cell types for different disease states |
| TF | Cell Type | Tissue | Disease Stage | Target Gene | RSS | Regulon Activity |
| ∗The dot plots of a searched regulon are shown for all cell subpopulations in each disease state of each tissue based on the regulon specific score inferred using pySCENIC and by calculating the average expression. |
| Page: 1 |
Top |
Somatic mutation of malignant transformation related genes |
| Annotation of somatic variants for genes involved in malignant transformation |
| Hugo Symbol | Variant Class | Variant Classification | dbSNP RS | HGVSc | HGVSp | HGVSp Short | SWISSPROT | BIOTYPE | SIFT | PolyPhen | Tumor Sample Barcode | Tissue | Histology | Sex | Age | Stage | Therapy Types | Drugs | Outcome |
| APRT | SNV | Missense_Mutation | novel | c.277C>T | p.Pro93Ser | p.P93S | P07741 | protein_coding | deleterious(0) | probably_damaging(1) | TCGA-2W-A8YY-01 | Cervix | cervical & endocervical cancer | Female | <65 | I/II | Chemotherapy | cisplatin | CR |
| APRT | SNV | Missense_Mutation | c.496N>A | p.Glu166Lys | p.E166K | P07741 | protein_coding | tolerated(0.19) | benign(0.049) | TCGA-JX-A3Q0-01 | Cervix | cervical & endocervical cancer | Female | <65 | III/IV | Unknown | Unknown | SD | |
| APRT | SNV | Missense_Mutation | rs752166198 | c.265N>T | p.Arg89Trp | p.R89W | P07741 | protein_coding | deleterious(0) | possibly_damaging(0.831) | TCGA-A5-A1OF-01 | Endometrium | uterine corpus endometrioid carcinoma | Female | <65 | I/II | Unknown | Unknown | SD |
| APRT | SNV | Missense_Mutation | c.524N>A | p.Ser175Tyr | p.S175Y | P07741 | protein_coding | deleterious(0) | probably_damaging(0.99) | TCGA-AX-A2HC-01 | Endometrium | uterine corpus endometrioid carcinoma | Female | <65 | III/IV | Chemotherapy | paclitaxel | PD | |
| APRT | SNV | Missense_Mutation | novel | c.296C>T | p.Ala99Val | p.A99V | P07741 | protein_coding | tolerated(1) | benign(0.001) | TCGA-DI-A1BU-01 | Endometrium | uterine corpus endometrioid carcinoma | Female | <65 | I/II | Chemotherapy | paclitaxel | SD |
| APRT | SNV | Missense_Mutation | novel | c.443N>T | p.Ala148Val | p.A148V | P07741 | protein_coding | tolerated(0.08) | probably_damaging(0.985) | TCGA-EO-A22U-01 | Endometrium | uterine corpus endometrioid carcinoma | Female | >=65 | I/II | Unknown | Unknown | SD |
| APRT | SNV | Missense_Mutation | novel | c.112N>C | p.Ser38Pro | p.S38P | P07741 | protein_coding | deleterious(0.02) | possibly_damaging(0.794) | TCGA-EY-A5W2-01 | Endometrium | uterine corpus endometrioid carcinoma | Female | >=65 | I/II | Unknown | Unknown | SD |
| APRT | SNV | Missense_Mutation | c.363G>C | p.Gln121His | p.Q121H | P07741 | protein_coding | deleterious(0.01) | probably_damaging(0.916) | TCGA-69-7979-01 | Lung | lung adenocarcinoma | Female | >=65 | I/II | Unknown | Unknown | SD | |
| APRT | SNV | Missense_Mutation | c.363N>C | p.Gln121His | p.Q121H | P07741 | protein_coding | deleterious(0.01) | probably_damaging(0.916) | TCGA-73-4658-01 | Lung | lung adenocarcinoma | Female | >=65 | I/II | Unknown | Unknown | SD | |
| APRT | SNV | Missense_Mutation | rs117335001 | c.260N>A | p.Arg87Gln | p.R87Q | P07741 | protein_coding | deleterious(0) | probably_damaging(1) | TCGA-68-8250-01 | Lung | lung squamous cell carcinoma | Male | >=65 | I/II | Unknown | Unknown | SD |
| Page: 1 2 |
Top |
Related drugs of malignant transformation related genes |
| Identification of chemicals and drugs interact with genes involved in malignant transfromation |
| (DGIdb 4.0) |
| Entrez ID | Symbol | Category | Interaction Types | Drug Claim Name | Drug Name | PMIDs |
| 353 | APRT | ENZYME, DRUGGABLE GENOME | TPA | ALTEPLASE | 6933001 | |
| 353 | APRT | ENZYME, DRUGGABLE GENOME | HYDROGEN PEROXIDE | 10213488 |
| Page: 1 |

Copyright 2023-Present -The University of Texas Health Science Center at Houston |