
|
|||||
|
 | |
| |
| |
| |
| |
| |
|
Gene: APPL2 |
Gene summary for APPL2 |
| Gene information | Species | Human | Gene symbol | APPL2 | Gene ID | 55198 |
| Gene name | adaptor protein, phosphotyrosine interacting with PH domain and leucine zipper 2 | |
| Gene Alias | DIP13B | |
| Cytomap | 12q23.3 | |
| Gene Type | protein-coding | GO ID | GO:0000082 | UniProtAcc | Q8NEU8 |
Top |
Malignant transformation analysis |
| Identification of the aberrant gene expression in precancerous and cancerous lesions by comparing the gene expression of stem-like cells in diseased tissues with normal stem cells |
| Entrez ID | Symbol | Replicates | Species | Organ | Tissue | Adj P-value | Log2FC | Malignancy |
| 55198 | APPL2 | HSIL_HPV_2 | Human | Cervix | HSIL_HPV | 3.17e-02 | 1.39e-01 | 0.0208 |
| 55198 | APPL2 | CCI_2 | Human | Cervix | CC | 4.69e-10 | 1.02e+00 | 0.5249 |
| 55198 | APPL2 | CCI_3 | Human | Cervix | CC | 8.97e-09 | 6.33e-01 | 0.516 |
| 55198 | APPL2 | HTA11_2487_2000001011 | Human | Colorectum | SER | 1.14e-04 | 4.83e-01 | -0.1808 |
| 55198 | APPL2 | HTA11_347_2000001011 | Human | Colorectum | AD | 4.09e-11 | 5.67e-01 | -0.1954 |
| 55198 | APPL2 | HTA11_411_2000001011 | Human | Colorectum | SER | 1.39e-02 | 6.05e-01 | -0.2602 |
| 55198 | APPL2 | A015-C-203 | Human | Colorectum | FAP | 9.65e-09 | -4.29e-02 | -0.1294 |
| 55198 | APPL2 | A002-C-201 | Human | Colorectum | FAP | 6.15e-03 | -7.82e-02 | 0.0324 |
| 55198 | APPL2 | A001-C-108 | Human | Colorectum | FAP | 5.31e-07 | 2.27e-01 | -0.0272 |
| 55198 | APPL2 | A002-C-205 | Human | Colorectum | FAP | 4.15e-07 | -7.71e-02 | -0.1236 |
| 55198 | APPL2 | A015-C-006 | Human | Colorectum | FAP | 4.04e-05 | 3.32e-02 | -0.0994 |
| 55198 | APPL2 | A002-C-114 | Human | Colorectum | FAP | 1.19e-05 | 7.07e-03 | -0.1561 |
| 55198 | APPL2 | A015-C-104 | Human | Colorectum | FAP | 1.61e-10 | -1.06e-01 | -0.1899 |
| 55198 | APPL2 | A001-C-014 | Human | Colorectum | FAP | 9.69e-04 | 7.94e-02 | 0.0135 |
| 55198 | APPL2 | A002-C-016 | Human | Colorectum | FAP | 6.44e-04 | -7.56e-02 | 0.0521 |
| 55198 | APPL2 | A001-C-203 | Human | Colorectum | FAP | 1.05e-03 | 1.92e-01 | -0.0481 |
| 55198 | APPL2 | A002-C-116 | Human | Colorectum | FAP | 2.30e-11 | -1.30e-01 | -0.0452 |
| 55198 | APPL2 | A014-C-008 | Human | Colorectum | FAP | 3.31e-04 | 1.29e-01 | -0.191 |
| 55198 | APPL2 | A018-E-020 | Human | Colorectum | FAP | 1.22e-05 | -2.68e-02 | -0.2034 |
| 55198 | APPL2 | F034 | Human | Colorectum | FAP | 6.92e-07 | 1.02e-01 | -0.0665 |
| Page: 1 2 3 4 5 |
| Tissue | Expression Dynamics | Abbreviation |
| Cervix | 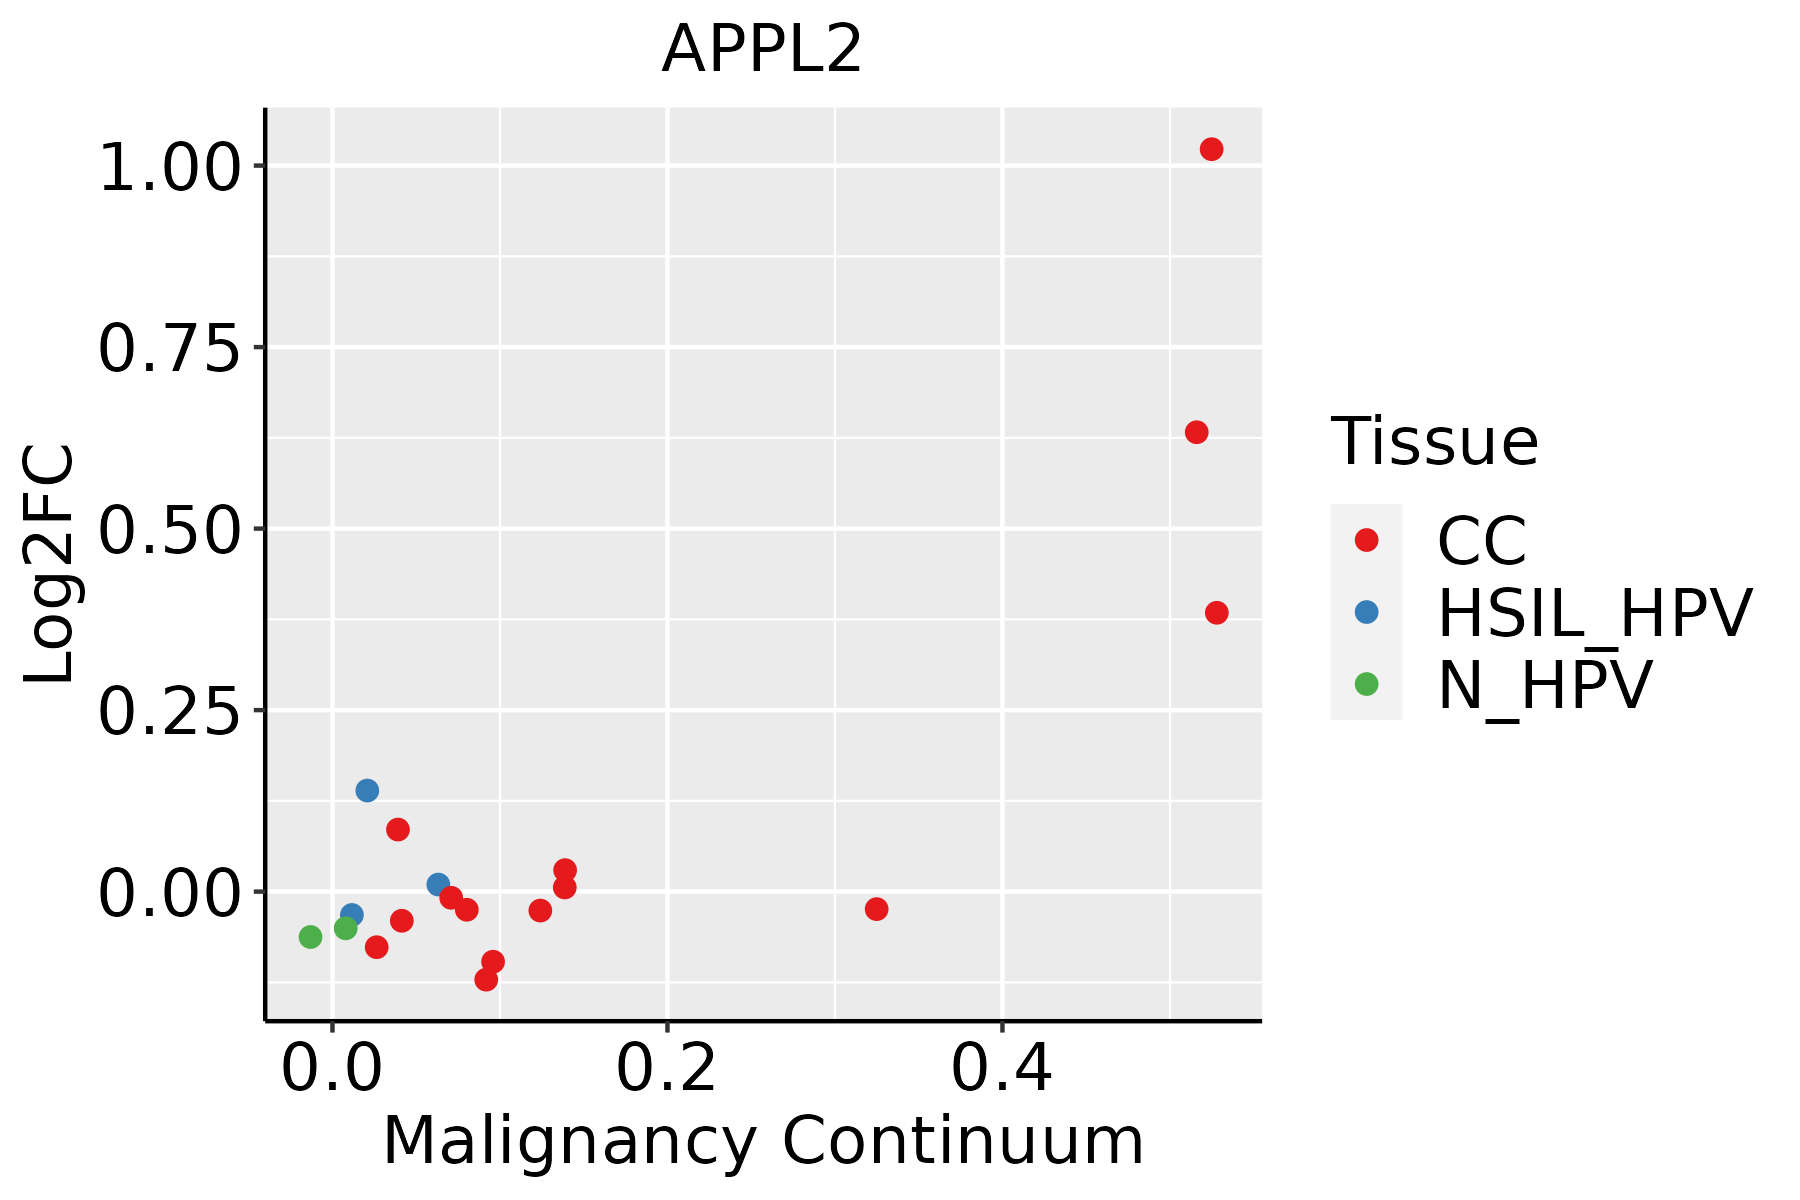 | CC: Cervix cancer |
| HSIL_HPV: HPV-infected high-grade squamous intraepithelial lesions | ||
| N_HPV: HPV-infected normal cervix | ||
| Colorectum (GSE201348) |  | FAP: Familial adenomatous polyposis |
| CRC: Colorectal cancer | ||
| Colorectum (HTA11) |  | AD: Adenomas |
| SER: Sessile serrated lesions | ||
| MSI-H: Microsatellite-high colorectal cancer | ||
| MSS: Microsatellite stable colorectal cancer | ||
| Esophagus | 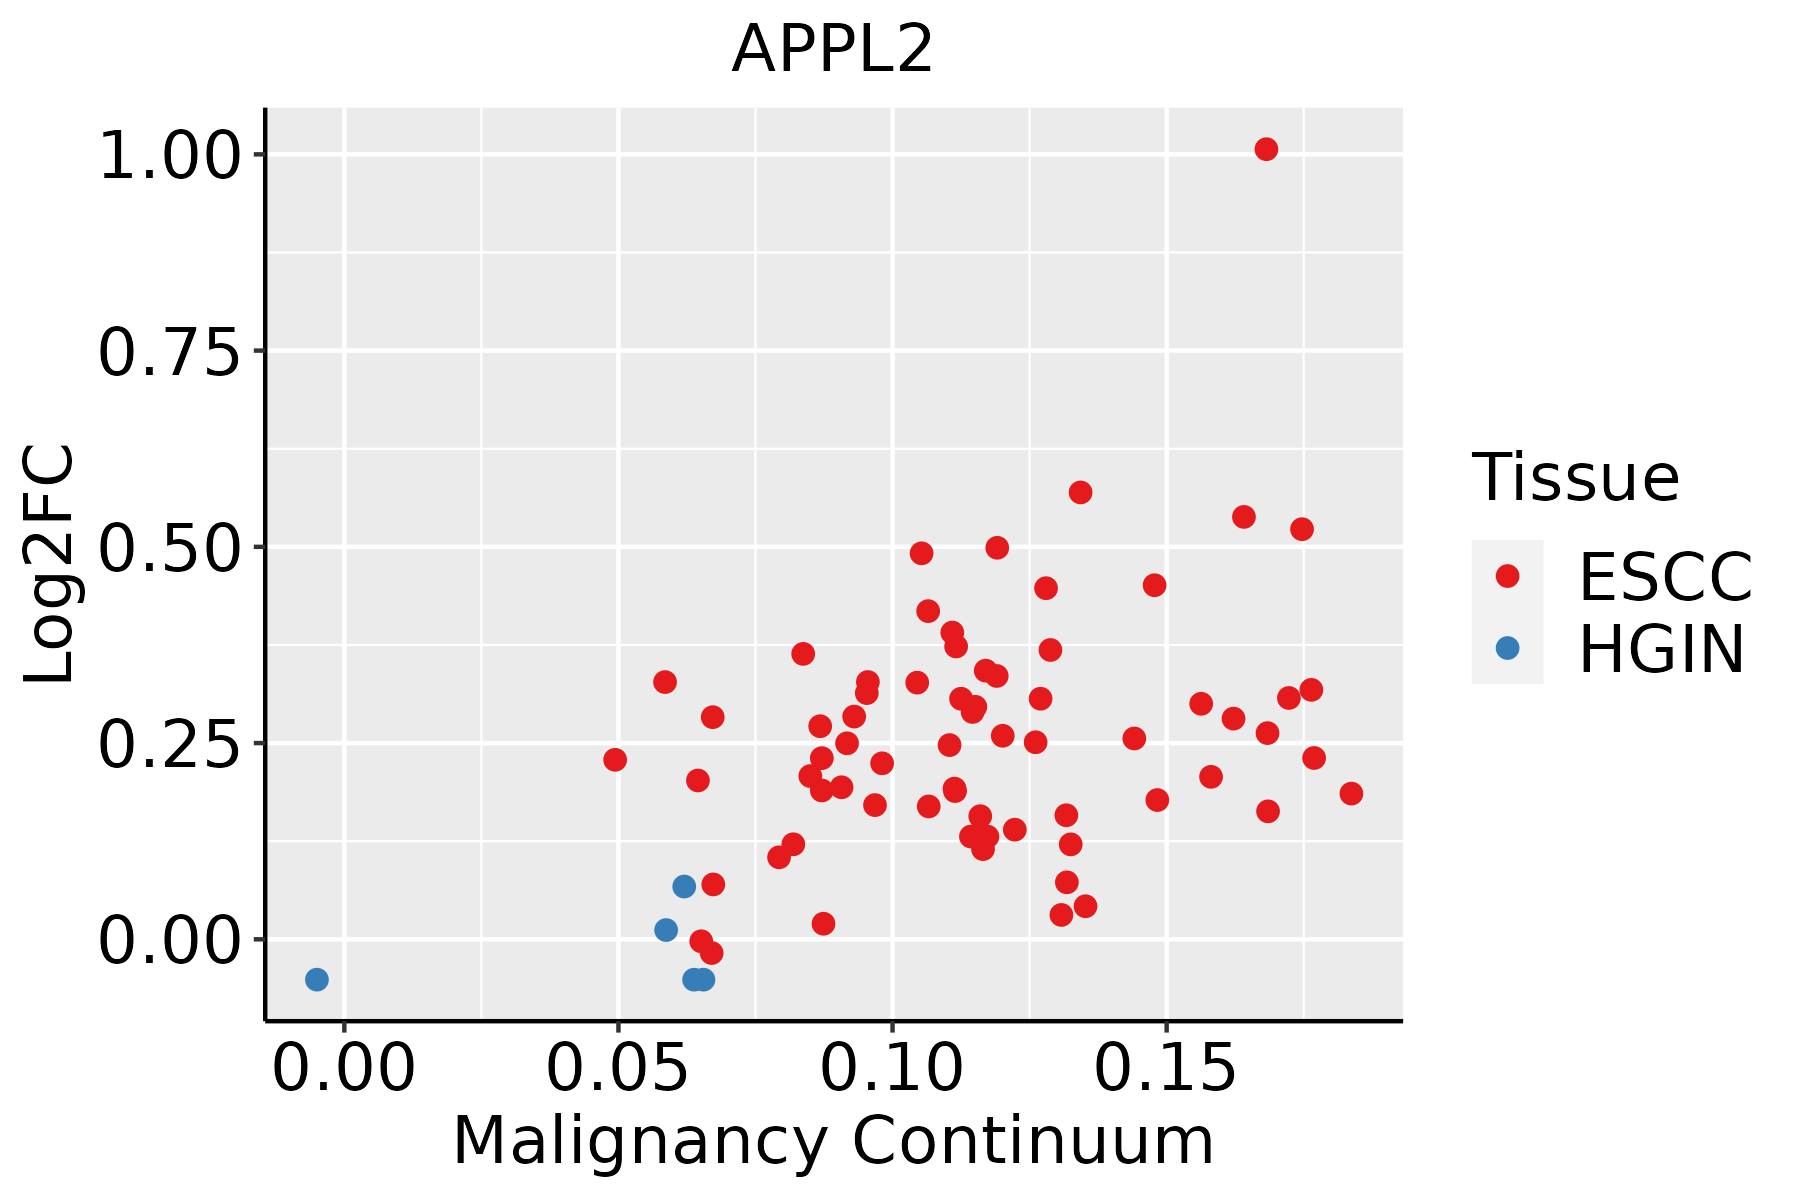 | ESCC: Esophageal squamous cell carcinoma |
| HGIN: High-grade intraepithelial neoplasias | ||
| LGIN: Low-grade intraepithelial neoplasias | ||
| Liver | 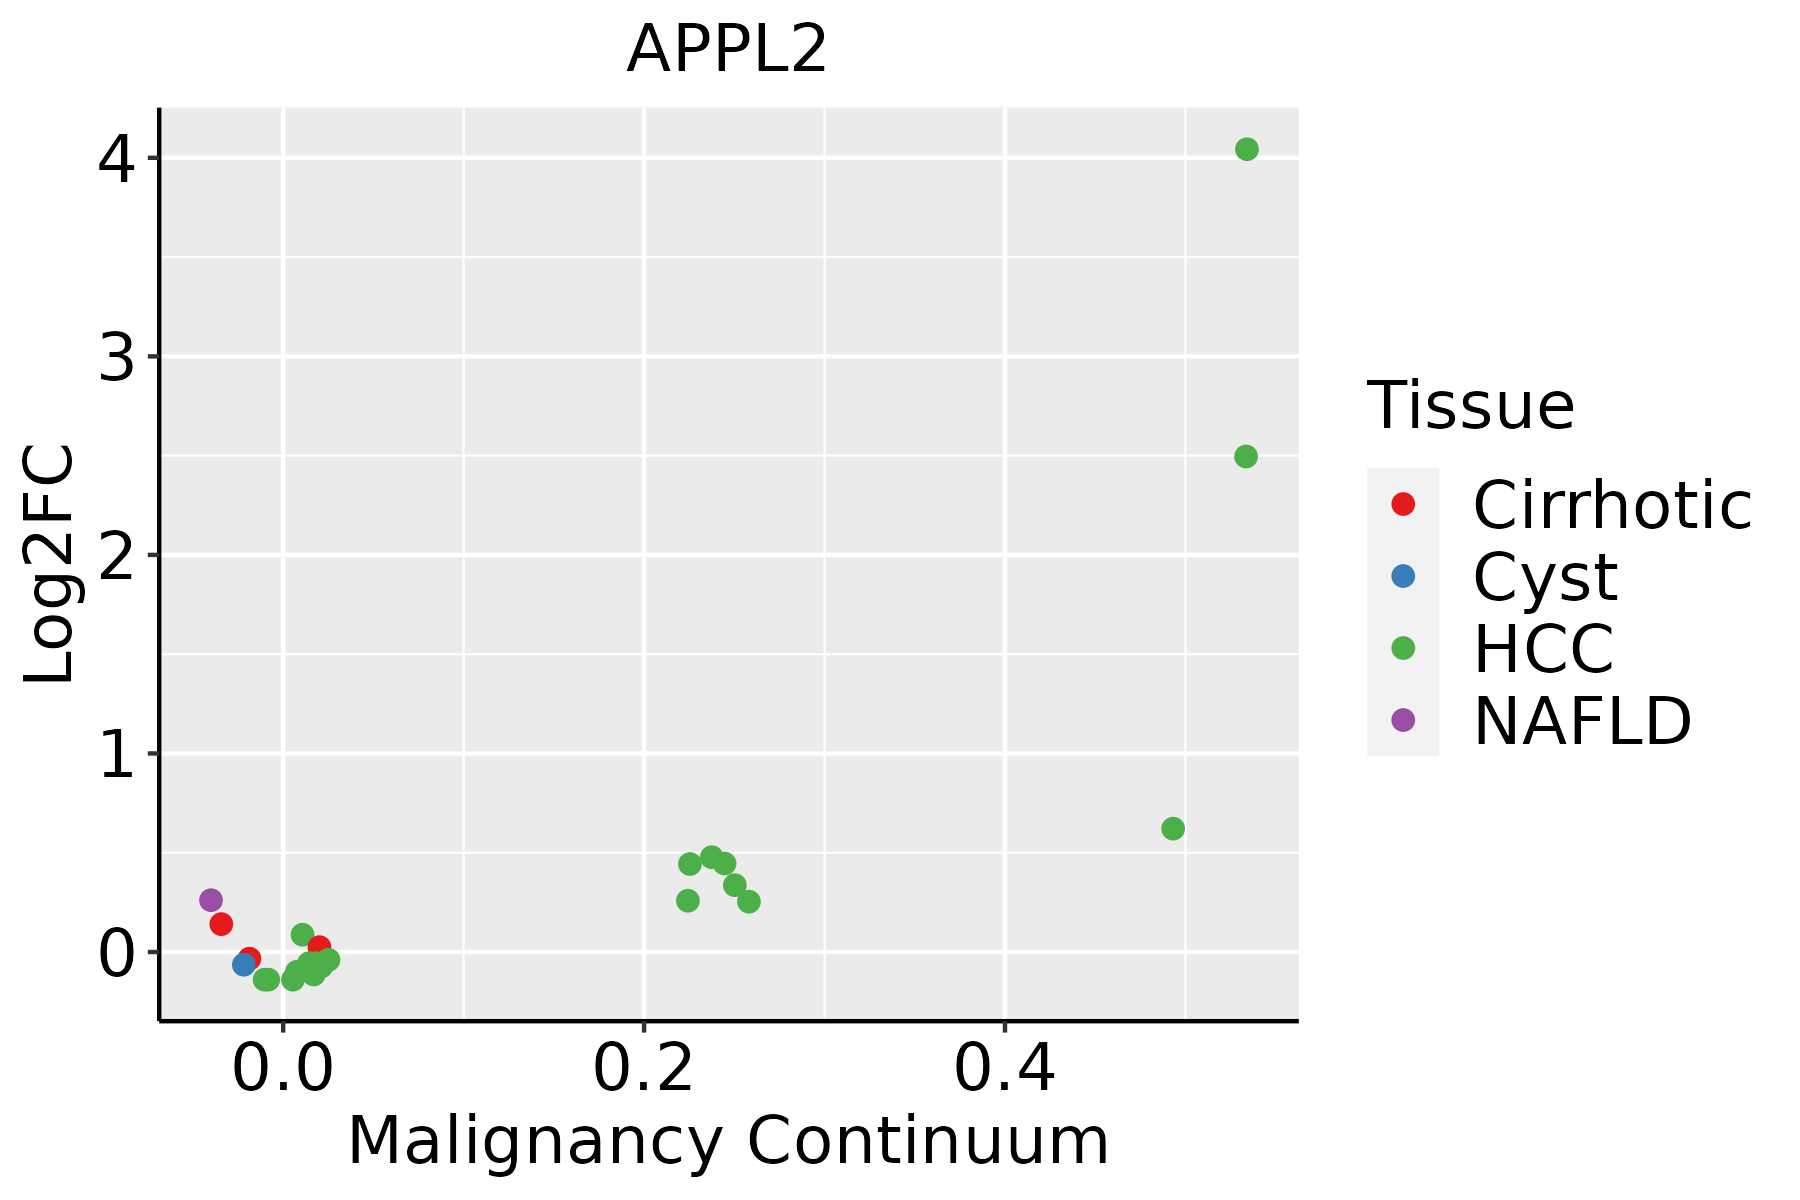 | HCC: Hepatocellular carcinoma |
| NAFLD: Non-alcoholic fatty liver disease |
| ∗log2FC in expression of this searched gene in stem-like cells from each diseased tissue sample relative to stem-like cells in normal samples in each tissue plotted against the malignancy continuum. Samples are colored based on if they are from different disease stage. |
Top |
Malignant transformation related pathway analysis |
| Find out the enriched GO biological processes and KEGG pathways involved in transition from healthy to precancer to cancer |
| Tissue | Disease Stage | Enriched GO biological Processes |
| Colorectum | AD |  |
| Colorectum | SER |  |
| Colorectum | MSS |  |
| Colorectum | MSI-H |  |
| Colorectum | FAP |  |
| ∗Top 15 enriched GO BP terms are showed in the bar plot of each disease state in each tissue. Each row represents a significant GO biological process which is colored according to the -log10(p.adjust). |
| Page: 1 2 3 4 5 6 7 8 9 |
| GO ID | Tissue | Disease Stage | Description | Gene Ratio | Bg Ratio | pvalue | p.adjust | Count |
| GO:00016679 | Cervix | CC | ameboidal-type cell migration | 110/2311 | 475/18723 | 2.66e-11 | 6.36e-09 | 110 |
| GO:00725949 | Cervix | CC | establishment of protein localization to organelle | 99/2311 | 422/18723 | 1.23e-10 | 2.11e-08 | 99 |
| GO:00069139 | Cervix | CC | nucleocytoplasmic transport | 71/2311 | 301/18723 | 4.04e-08 | 2.54e-06 | 71 |
| GO:00511699 | Cervix | CC | nuclear transport | 71/2311 | 301/18723 | 4.04e-08 | 2.54e-06 | 71 |
| GO:00345048 | Cervix | CC | protein localization to nucleus | 68/2311 | 290/18723 | 9.91e-08 | 5.25e-06 | 68 |
| GO:00027644 | Cervix | CC | immune response-regulating signaling pathway | 97/2311 | 468/18723 | 1.49e-07 | 7.07e-06 | 97 |
| GO:00447725 | Cervix | CC | mitotic cell cycle phase transition | 89/2311 | 424/18723 | 2.70e-07 | 1.12e-05 | 89 |
| GO:00380933 | Cervix | CC | Fc receptor signaling pathway | 19/2311 | 50/18723 | 3.42e-06 | 9.17e-05 | 19 |
| GO:003166710 | Cervix | CC | response to nutrient levels | 92/2311 | 474/18723 | 5.80e-06 | 1.42e-04 | 92 |
| GO:20000453 | Cervix | CC | regulation of G1/S transition of mitotic cell cycle | 37/2311 | 142/18723 | 6.33e-06 | 1.53e-04 | 37 |
| GO:00170388 | Cervix | CC | protein import | 48/2311 | 206/18723 | 8.62e-06 | 1.98e-04 | 48 |
| GO:00000824 | Cervix | CC | G1/S transition of mitotic cell cycle | 49/2311 | 214/18723 | 1.16e-05 | 2.48e-04 | 49 |
| GO:19028062 | Cervix | CC | regulation of cell cycle G1/S phase transition | 41/2311 | 168/18723 | 1.18e-05 | 2.51e-04 | 41 |
| GO:00073466 | Cervix | CC | regulation of mitotic cell cycle | 88/2311 | 457/18723 | 1.26e-05 | 2.60e-04 | 88 |
| GO:19019903 | Cervix | CC | regulation of mitotic cell cycle phase transition | 63/2311 | 299/18723 | 1.27e-05 | 2.60e-04 | 63 |
| GO:00448434 | Cervix | CC | cell cycle G1/S phase transition | 53/2311 | 241/18723 | 1.76e-05 | 3.32e-04 | 53 |
| GO:00028315 | Cervix | CC | regulation of response to biotic stimulus | 67/2311 | 327/18723 | 1.79e-05 | 3.36e-04 | 67 |
| GO:19016538 | Cervix | CC | cellular response to peptide | 72/2311 | 359/18723 | 1.89e-05 | 3.48e-04 | 72 |
| GO:00301008 | Cervix | CC | regulation of endocytosis | 47/2311 | 211/18723 | 3.65e-05 | 5.82e-04 | 47 |
| GO:00511707 | Cervix | CC | import into nucleus | 38/2311 | 159/18723 | 3.98e-05 | 6.18e-04 | 38 |
| Page: 1 2 3 4 5 6 7 8 9 10 11 12 13 14 15 16 17 18 19 |
| Pathway ID | Tissue | Disease Stage | Description | Gene Ratio | Bg Ratio | pvalue | p.adjust | qvalue | Count |
| Page: 1 |
Top |
Cell-cell communication analysis |
| Identification of potential cell-cell interactions between two cell types and their ligand-receptor pairs for different disease states |
| Ligand | Receptor | LRpair | Pathway | Tissue | Disease Stage |
| Page: 1 |
Top |
Single-cell gene regulatory network inference analysis |
| Find out the significant the regulons (TFs) and the target genes of each regulon across cell types for different disease states |
| TF | Cell Type | Tissue | Disease Stage | Target Gene | RSS | Regulon Activity |
| ∗The dot plots of a searched regulon are shown for all cell subpopulations in each disease state of each tissue based on the regulon specific score inferred using pySCENIC and by calculating the average expression. |
| Page: 1 |
Top |
Somatic mutation of malignant transformation related genes |
| Annotation of somatic variants for genes involved in malignant transformation |
| Hugo Symbol | Variant Class | Variant Classification | dbSNP RS | HGVSc | HGVSp | HGVSp Short | SWISSPROT | BIOTYPE | SIFT | PolyPhen | Tumor Sample Barcode | Tissue | Histology | Sex | Age | Stage | Therapy Types | Drugs | Outcome |
| APPL2 | SNV | Missense_Mutation | rs141732009 | c.502N>A | p.Glu168Lys | p.E168K | Q8NEU8 | protein_coding | deleterious(0.01) | benign(0.225) | TCGA-AC-A23H-01 | Breast | breast invasive carcinoma | Female | >=65 | I/II | Unknown | Unknown | PD |
| APPL2 | SNV | Missense_Mutation | c.1737G>C | p.Lys579Asn | p.K579N | Q8NEU8 | protein_coding | tolerated(0.28) | benign(0.274) | TCGA-AN-A0XP-01 | Breast | breast invasive carcinoma | Female | >=65 | III/IV | Unknown | Unknown | SD | |
| APPL2 | SNV | Missense_Mutation | rs768320904 | c.331A>G | p.Met111Val | p.M111V | Q8NEU8 | protein_coding | tolerated(0.07) | probably_damaging(0.988) | TCGA-AR-A24O-01 | Breast | breast invasive carcinoma | Female | <65 | III/IV | Chemotherapy | cytoxan | PD |
| APPL2 | SNV | Missense_Mutation | c.1191N>G | p.Asn397Lys | p.N397K | Q8NEU8 | protein_coding | deleterious(0.05) | possibly_damaging(0.773) | TCGA-AR-A24R-01 | Breast | breast invasive carcinoma | Female | <65 | III/IV | Chemotherapy | cytoxan | SD | |
| APPL2 | insertion | Nonsense_Mutation | novel | c.1940_1941insCCCCTGAACTTTTTTTTTCTTGCTTAGACTTTTTTGG | p.Leu648ProfsTer2 | p.L648Pfs*2 | Q8NEU8 | protein_coding | TCGA-A8-A09C-01 | Breast | breast invasive carcinoma | Female | >=65 | I/II | Unknown | Unknown | SD | ||
| APPL2 | insertion | Frame_Shift_Ins | novel | c.210_211insA | p.Gln71ThrfsTer9 | p.Q71Tfs*9 | Q8NEU8 | protein_coding | TCGA-LL-A5YL-01 | Breast | breast invasive carcinoma | Female | <65 | I/II | Chemotherapy | adriamycin | SD | ||
| APPL2 | SNV | Missense_Mutation | c.440N>C | p.Asp147Ala | p.D147A | Q8NEU8 | protein_coding | deleterious(0) | benign(0.418) | TCGA-DR-A0ZM-01 | Cervix | cervical & endocervical cancer | Female | <65 | III/IV | Unspecific | Cisplatin | SD | |
| APPL2 | SNV | Missense_Mutation | rs367929771 | c.1996G>A | p.Ala666Thr | p.A666T | Q8NEU8 | protein_coding | tolerated_low_confidence(0.38) | benign(0.005) | TCGA-AA-A029-01 | Colorectum | colon adenocarcinoma | Male | >=65 | I/II | Unknown | Unknown | SD |
| APPL2 | SNV | Missense_Mutation | c.1432A>G | p.Asn478Asp | p.N478D | Q8NEU8 | protein_coding | deleterious(0.05) | probably_damaging(0.997) | TCGA-AZ-6598-01 | Colorectum | colon adenocarcinoma | Female | >=65 | I/II | Unknown | Unknown | SD | |
| APPL2 | SNV | Missense_Mutation | rs772596522 | c.797N>G | p.Ser266Cys | p.S266C | Q8NEU8 | protein_coding | tolerated(0.17) | possibly_damaging(0.745) | TCGA-DM-A285-01 | Colorectum | colon adenocarcinoma | Female | >=65 | III/IV | Unknown | Unknown | SD |
| Page: 1 2 3 4 5 6 |
Top |
Related drugs of malignant transformation related genes |
| Identification of chemicals and drugs interact with genes involved in malignant transfromation |
| (DGIdb 4.0) |
| Entrez ID | Symbol | Category | Interaction Types | Drug Claim Name | Drug Name | PMIDs |
| Page: 1 |

Copyright 2023-Present -The University of Texas Health Science Center at Houston |