
|
|||||
|
 | |
| |
| |
| |
| |
| |
|
Gene: APPBP2 |
Gene summary for APPBP2 |
| Gene information | Species | Human | Gene symbol | APPBP2 | Gene ID | 10513 |
| Gene name | amyloid beta precursor protein binding protein 2 | |
| Gene Alias | APP-BP2 | |
| Cytomap | 17q23.2 | |
| Gene Type | protein-coding | GO ID | GO:0006464 | UniProtAcc | Q92624 |
Top |
Malignant transformation analysis |
| Identification of the aberrant gene expression in precancerous and cancerous lesions by comparing the gene expression of stem-like cells in diseased tissues with normal stem cells |
| Entrez ID | Symbol | Replicates | Species | Organ | Tissue | Adj P-value | Log2FC | Malignancy |
| 10513 | APPBP2 | CCI_2 | Human | Cervix | CC | 3.37e-02 | 4.99e-01 | 0.5249 |
| 10513 | APPBP2 | CCI_3 | Human | Cervix | CC | 6.52e-06 | 5.50e-01 | 0.516 |
| 10513 | APPBP2 | LZE4T | Human | Esophagus | ESCC | 1.08e-09 | 3.42e-01 | 0.0811 |
| 10513 | APPBP2 | LZE5T | Human | Esophagus | ESCC | 2.83e-04 | 3.51e-01 | 0.0514 |
| 10513 | APPBP2 | LZE7T | Human | Esophagus | ESCC | 1.17e-03 | 2.02e-01 | 0.0667 |
| 10513 | APPBP2 | LZE24T | Human | Esophagus | ESCC | 1.49e-14 | 3.62e-01 | 0.0596 |
| 10513 | APPBP2 | LZE21T | Human | Esophagus | ESCC | 6.83e-07 | 2.12e-01 | 0.0655 |
| 10513 | APPBP2 | LZE6T | Human | Esophagus | ESCC | 3.06e-05 | 2.61e-01 | 0.0845 |
| 10513 | APPBP2 | P1T-E | Human | Esophagus | ESCC | 1.13e-06 | 3.51e-01 | 0.0875 |
| 10513 | APPBP2 | P2T-E | Human | Esophagus | ESCC | 2.15e-22 | 5.11e-01 | 0.1177 |
| 10513 | APPBP2 | P4T-E | Human | Esophagus | ESCC | 2.59e-11 | 2.02e-01 | 0.1323 |
| 10513 | APPBP2 | P5T-E | Human | Esophagus | ESCC | 4.36e-08 | 7.21e-02 | 0.1327 |
| 10513 | APPBP2 | P8T-E | Human | Esophagus | ESCC | 3.25e-18 | 4.05e-01 | 0.0889 |
| 10513 | APPBP2 | P9T-E | Human | Esophagus | ESCC | 1.29e-07 | 1.82e-01 | 0.1131 |
| 10513 | APPBP2 | P10T-E | Human | Esophagus | ESCC | 1.07e-23 | 4.35e-01 | 0.116 |
| 10513 | APPBP2 | P11T-E | Human | Esophagus | ESCC | 1.63e-12 | 4.14e-01 | 0.1426 |
| 10513 | APPBP2 | P12T-E | Human | Esophagus | ESCC | 1.24e-24 | 5.08e-01 | 0.1122 |
| 10513 | APPBP2 | P15T-E | Human | Esophagus | ESCC | 1.57e-28 | 4.53e-01 | 0.1149 |
| 10513 | APPBP2 | P16T-E | Human | Esophagus | ESCC | 2.39e-25 | 4.14e-01 | 0.1153 |
| 10513 | APPBP2 | P20T-E | Human | Esophagus | ESCC | 1.15e-16 | 3.37e-01 | 0.1124 |
| Page: 1 2 3 4 5 |
| Tissue | Expression Dynamics | Abbreviation |
| Cervix |  | CC: Cervix cancer |
| HSIL_HPV: HPV-infected high-grade squamous intraepithelial lesions | ||
| N_HPV: HPV-infected normal cervix | ||
| Esophagus |  | ESCC: Esophageal squamous cell carcinoma |
| HGIN: High-grade intraepithelial neoplasias | ||
| LGIN: Low-grade intraepithelial neoplasias | ||
| Lung | 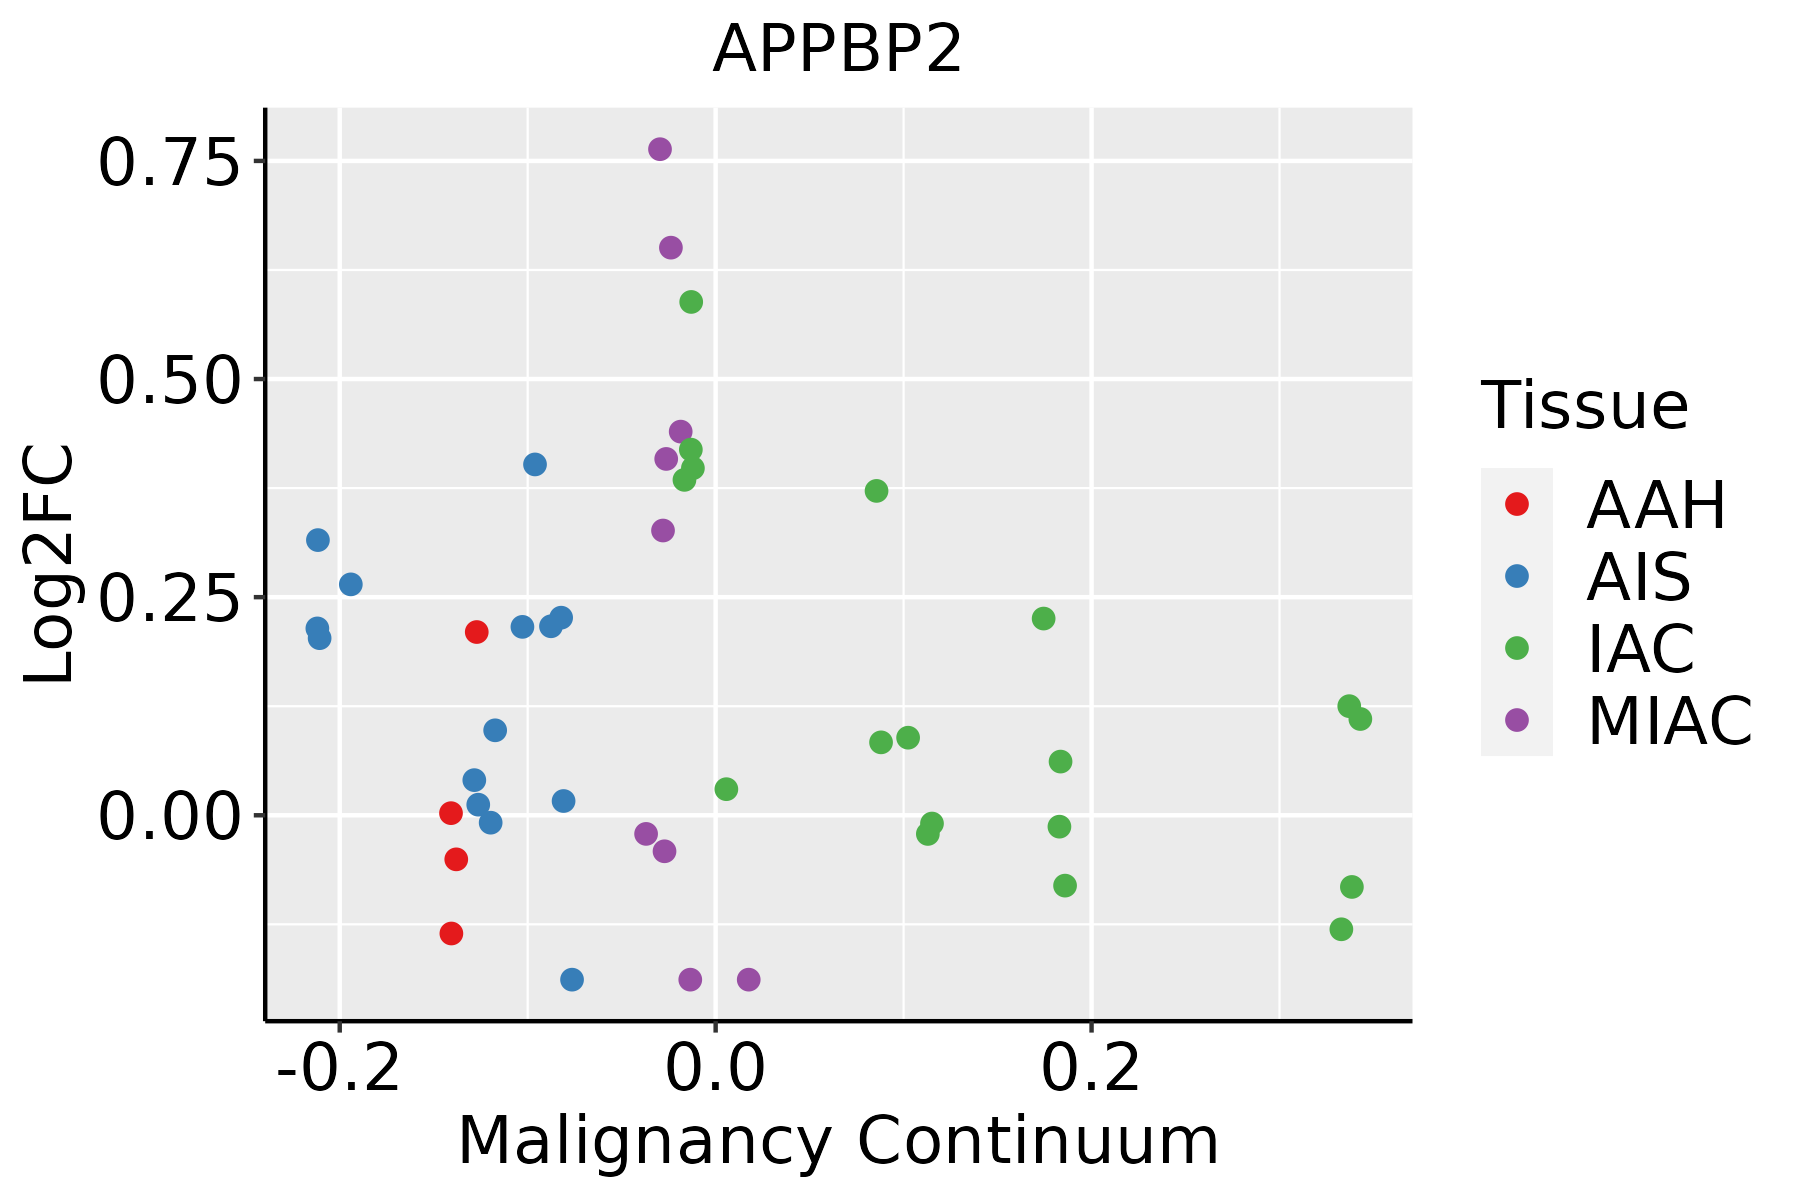 | AAH: Atypical adenomatous hyperplasia |
| AIS: Adenocarcinoma in situ | ||
| IAC: Invasive lung adenocarcinoma | ||
| MIA: Minimally invasive adenocarcinoma | ||
| Thyroid |  | ATC: Anaplastic thyroid cancer |
| HT: Hashimoto's thyroiditis | ||
| PTC: Papillary thyroid cancer |
| ∗log2FC in expression of this searched gene in stem-like cells from each diseased tissue sample relative to stem-like cells in normal samples in each tissue plotted against the malignancy continuum. Samples are colored based on if they are from different disease stage. |
Top |
Malignant transformation related pathway analysis |
| Find out the enriched GO biological processes and KEGG pathways involved in transition from healthy to precancer to cancer |
| Tissue | Disease Stage | Enriched GO biological Processes |
| Colorectum | AD |  |
| Colorectum | SER |  |
| Colorectum | MSS |  |
| Colorectum | MSI-H |  |
| Colorectum | FAP |  |
| ∗Top 15 enriched GO BP terms are showed in the bar plot of each disease state in each tissue. Each row represents a significant GO biological process which is colored according to the -log10(p.adjust). |
| Page: 1 2 3 4 5 6 7 8 9 |
| GO ID | Tissue | Disease Stage | Description | Gene Ratio | Bg Ratio | pvalue | p.adjust | Count |
| GO:001049810 | Cervix | CC | proteasomal protein catabolic process | 111/2311 | 490/18723 | 8.98e-11 | 1.58e-08 | 111 |
| GO:004316110 | Cervix | CC | proteasome-mediated ubiquitin-dependent protein catabolic process | 91/2311 | 412/18723 | 1.65e-08 | 1.25e-06 | 91 |
| GO:0010498111 | Esophagus | ESCC | proteasomal protein catabolic process | 369/8552 | 490/18723 | 1.13e-41 | 1.80e-38 | 369 |
| GO:0043161111 | Esophagus | ESCC | proteasome-mediated ubiquitin-dependent protein catabolic process | 312/8552 | 412/18723 | 3.53e-36 | 4.48e-33 | 312 |
| GO:00104988 | Lung | IAC | proteasomal protein catabolic process | 90/2061 | 490/18723 | 6.69e-07 | 3.89e-05 | 90 |
| GO:00431618 | Lung | IAC | proteasome-mediated ubiquitin-dependent protein catabolic process | 78/2061 | 412/18723 | 1.10e-06 | 6.02e-05 | 78 |
| GO:004316113 | Lung | AIS | proteasome-mediated ubiquitin-dependent protein catabolic process | 77/1849 | 412/18723 | 2.74e-08 | 3.47e-06 | 77 |
| GO:001049813 | Lung | AIS | proteasomal protein catabolic process | 87/1849 | 490/18723 | 4.15e-08 | 5.03e-06 | 87 |
| GO:004316123 | Lung | MIAC | proteasome-mediated ubiquitin-dependent protein catabolic process | 37/967 | 412/18723 | 7.87e-04 | 1.76e-02 | 37 |
| GO:001049823 | Lung | MIAC | proteasomal protein catabolic process | 40/967 | 490/18723 | 2.92e-03 | 3.99e-02 | 40 |
| GO:0010498113 | Thyroid | PTC | proteasomal protein catabolic process | 297/5968 | 490/18723 | 4.58e-40 | 9.63e-37 | 297 |
| GO:0043161113 | Thyroid | PTC | proteasome-mediated ubiquitin-dependent protein catabolic process | 254/5968 | 412/18723 | 3.91e-36 | 4.54e-33 | 254 |
| GO:001049832 | Thyroid | ATC | proteasomal protein catabolic process | 309/6293 | 490/18723 | 1.78e-41 | 1.13e-37 | 309 |
| GO:0043161210 | Thyroid | ATC | proteasome-mediated ubiquitin-dependent protein catabolic process | 265/6293 | 412/18723 | 7.09e-38 | 1.49e-34 | 265 |
| Page: 1 |
| Pathway ID | Tissue | Disease Stage | Description | Gene Ratio | Bg Ratio | pvalue | p.adjust | qvalue | Count |
| Page: 1 |
Top |
Cell-cell communication analysis |
| Identification of potential cell-cell interactions between two cell types and their ligand-receptor pairs for different disease states |
| Ligand | Receptor | LRpair | Pathway | Tissue | Disease Stage |
| Page: 1 |
Top |
Single-cell gene regulatory network inference analysis |
| Find out the significant the regulons (TFs) and the target genes of each regulon across cell types for different disease states |
| TF | Cell Type | Tissue | Disease Stage | Target Gene | RSS | Regulon Activity |
| ∗The dot plots of a searched regulon are shown for all cell subpopulations in each disease state of each tissue based on the regulon specific score inferred using pySCENIC and by calculating the average expression. |
| Page: 1 |
Top |
Somatic mutation of malignant transformation related genes |
| Annotation of somatic variants for genes involved in malignant transformation |
| Hugo Symbol | Variant Class | Variant Classification | dbSNP RS | HGVSc | HGVSp | HGVSp Short | SWISSPROT | BIOTYPE | SIFT | PolyPhen | Tumor Sample Barcode | Tissue | Histology | Sex | Age | Stage | Therapy Types | Drugs | Outcome |
| APPBP2 | SNV | Missense_Mutation | c.1490N>T | p.Arg497Leu | p.R497L | Q92624 | protein_coding | tolerated(0.08) | benign(0.074) | TCGA-AN-A0AM-01 | Breast | breast invasive carcinoma | Female | <65 | I/II | Unknown | Unknown | SD | |
| APPBP2 | SNV | Missense_Mutation | c.1010C>T | p.Ala337Val | p.A337V | Q92624 | protein_coding | deleterious(0.04) | possibly_damaging(0.878) | TCGA-AO-A124-01 | Breast | breast invasive carcinoma | Female | <65 | I/II | Chemotherapy | doxorubicin | SD | |
| APPBP2 | SNV | Missense_Mutation | c.1548N>A | p.Asp516Glu | p.D516E | Q92624 | protein_coding | deleterious(0) | possibly_damaging(0.846) | TCGA-D8-A27F-01 | Breast | breast invasive carcinoma | Female | <65 | I/II | Chemotherapy | adriamycin+cyclophosphamide | SD | |
| APPBP2 | SNV | Missense_Mutation | rs779603277 | c.1741N>A | p.Glu581Lys | p.E581K | Q92624 | protein_coding | deleterious_low_confidence(0.02) | benign(0.018) | TCGA-EA-A44S-01 | Cervix | cervical & endocervical cancer | Female | <65 | III/IV | Chemotherapy | carboplatin | SD |
| APPBP2 | SNV | Missense_Mutation | novel | c.729N>C | p.Lys243Asn | p.K243N | Q92624 | protein_coding | deleterious(0.01) | possibly_damaging(0.775) | TCGA-A6-5665-01 | Colorectum | colon adenocarcinoma | Female | >=65 | I/II | Unknown | Unknown | PD |
| APPBP2 | SNV | Missense_Mutation | novel | c.1267G>A | p.Glu423Lys | p.E423K | Q92624 | protein_coding | deleterious(0.01) | possibly_damaging(0.893) | TCGA-AA-3710-01 | Colorectum | colon adenocarcinoma | Female | >=65 | I/II | Unknown | Unknown | SD |
| APPBP2 | SNV | Missense_Mutation | novel | c.1596N>T | p.Lys532Asn | p.K532N | Q92624 | protein_coding | tolerated(0.12) | possibly_damaging(0.838) | TCGA-AA-A02W-01 | Colorectum | colon adenocarcinoma | Female | >=65 | I/II | Unknown | Unknown | PD |
| APPBP2 | SNV | Missense_Mutation | c.235N>T | p.Leu79Phe | p.L79F | Q92624 | protein_coding | deleterious(0.01) | possibly_damaging(0.879) | TCGA-AZ-4315-01 | Colorectum | colon adenocarcinoma | Male | <65 | I/II | Unknown | Unknown | SD | |
| APPBP2 | SNV | Missense_Mutation | c.778N>T | p.Arg260Cys | p.R260C | Q92624 | protein_coding | deleterious(0) | probably_damaging(0.919) | TCGA-CM-6171-01 | Colorectum | colon adenocarcinoma | Female | >=65 | I/II | Unknown | Unknown | SD | |
| APPBP2 | SNV | Missense_Mutation | c.1029N>A | p.His343Gln | p.H343Q | Q92624 | protein_coding | tolerated(0.14) | possibly_damaging(0.692) | TCGA-RU-A8FL-01 | Colorectum | colon adenocarcinoma | Male | <65 | III/IV | Chemotherapy | folfox | PD |
| Page: 1 2 3 4 5 6 |
Top |
Related drugs of malignant transformation related genes |
| Identification of chemicals and drugs interact with genes involved in malignant transfromation |
| (DGIdb 4.0) |
| Entrez ID | Symbol | Category | Interaction Types | Drug Claim Name | Drug Name | PMIDs |
| Page: 1 |

Copyright 2023-Present -The University of Texas Health Science Center at Houston |