| Tissue | Expression Dynamics | Abbreviation |
| Cervix | 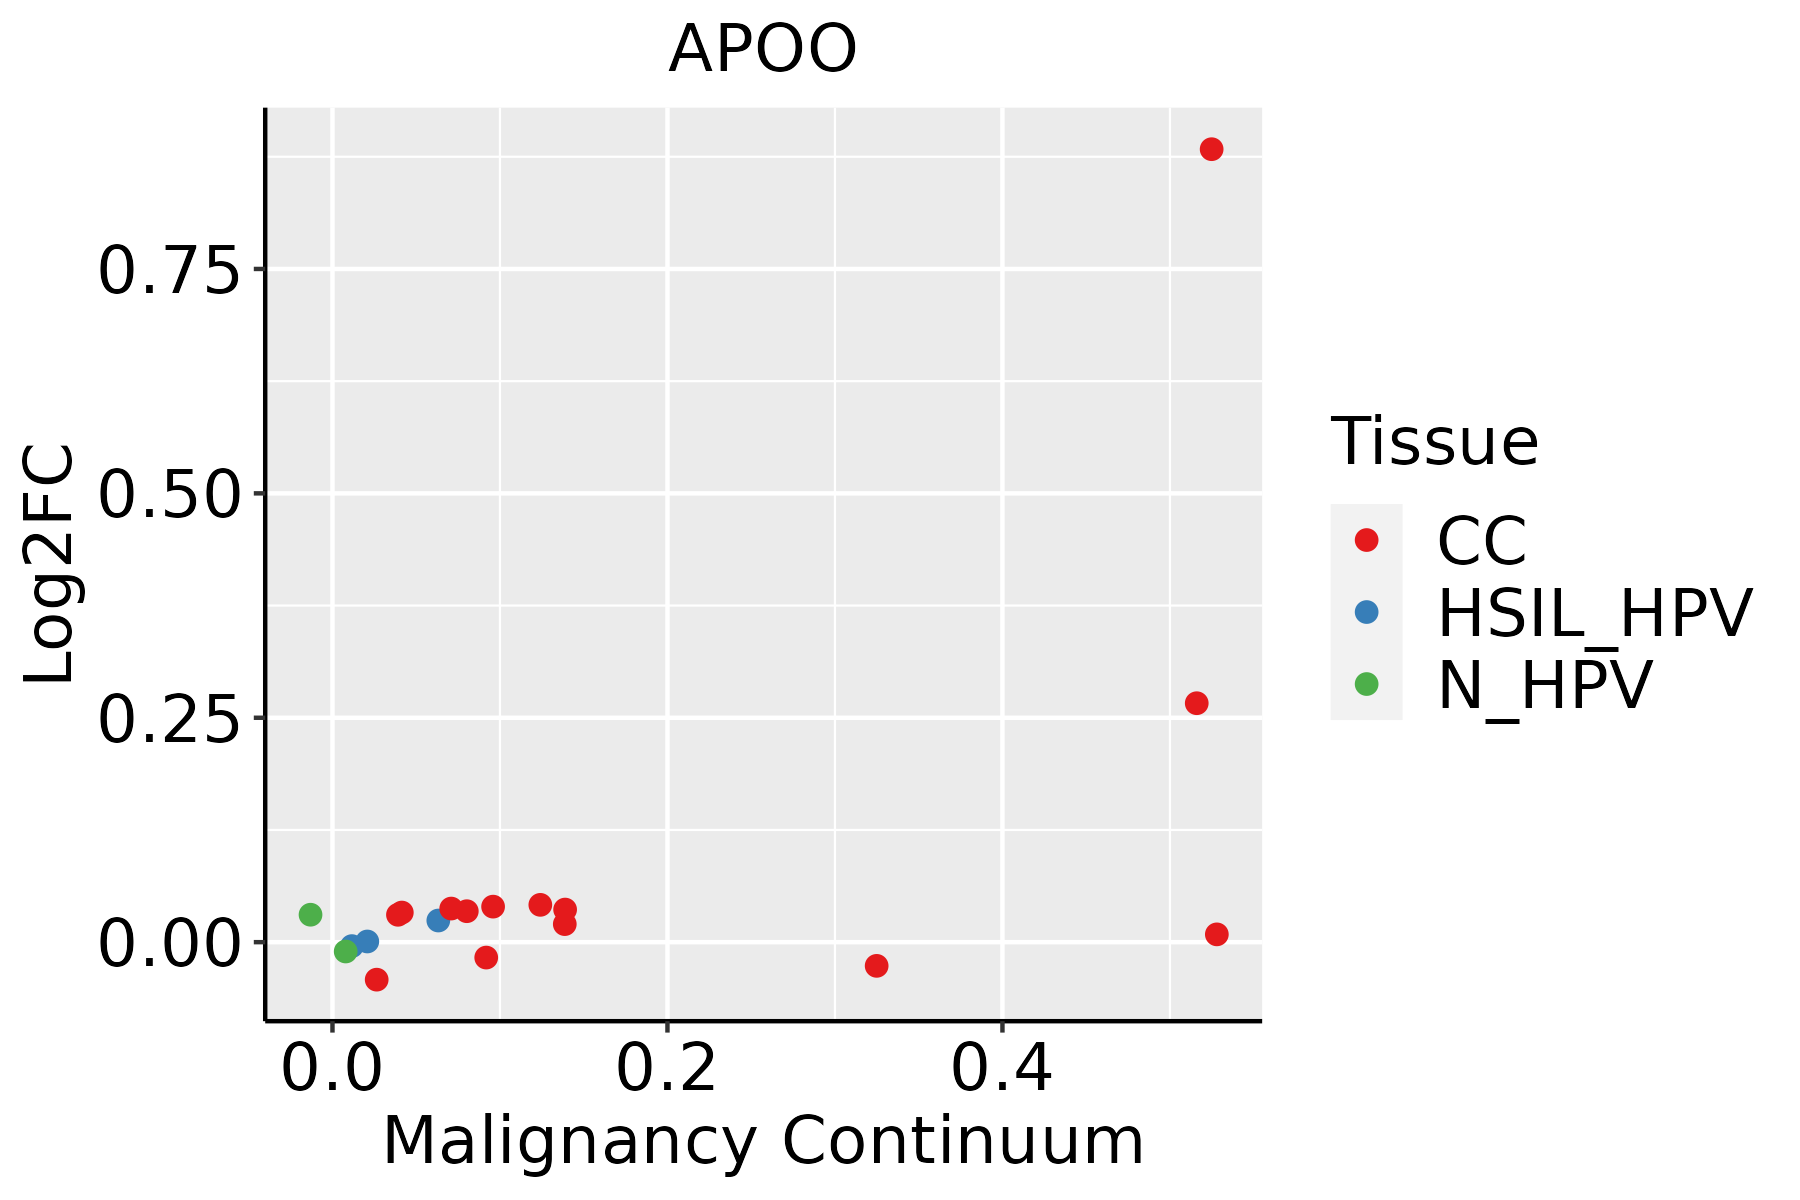 | CC: Cervix cancer |
| HSIL_HPV: HPV-infected high-grade squamous intraepithelial lesions |
| N_HPV: HPV-infected normal cervix |
| Colorectum (GSE201348) |  | FAP: Familial adenomatous polyposis |
| CRC: Colorectal cancer |
| Colorectum (HTA11) |  | AD: Adenomas |
| SER: Sessile serrated lesions |
| MSI-H: Microsatellite-high colorectal cancer |
| MSS: Microsatellite stable colorectal cancer |
| Esophagus |  | ESCC: Esophageal squamous cell carcinoma |
| HGIN: High-grade intraepithelial neoplasias |
| LGIN: Low-grade intraepithelial neoplasias |
| Liver | 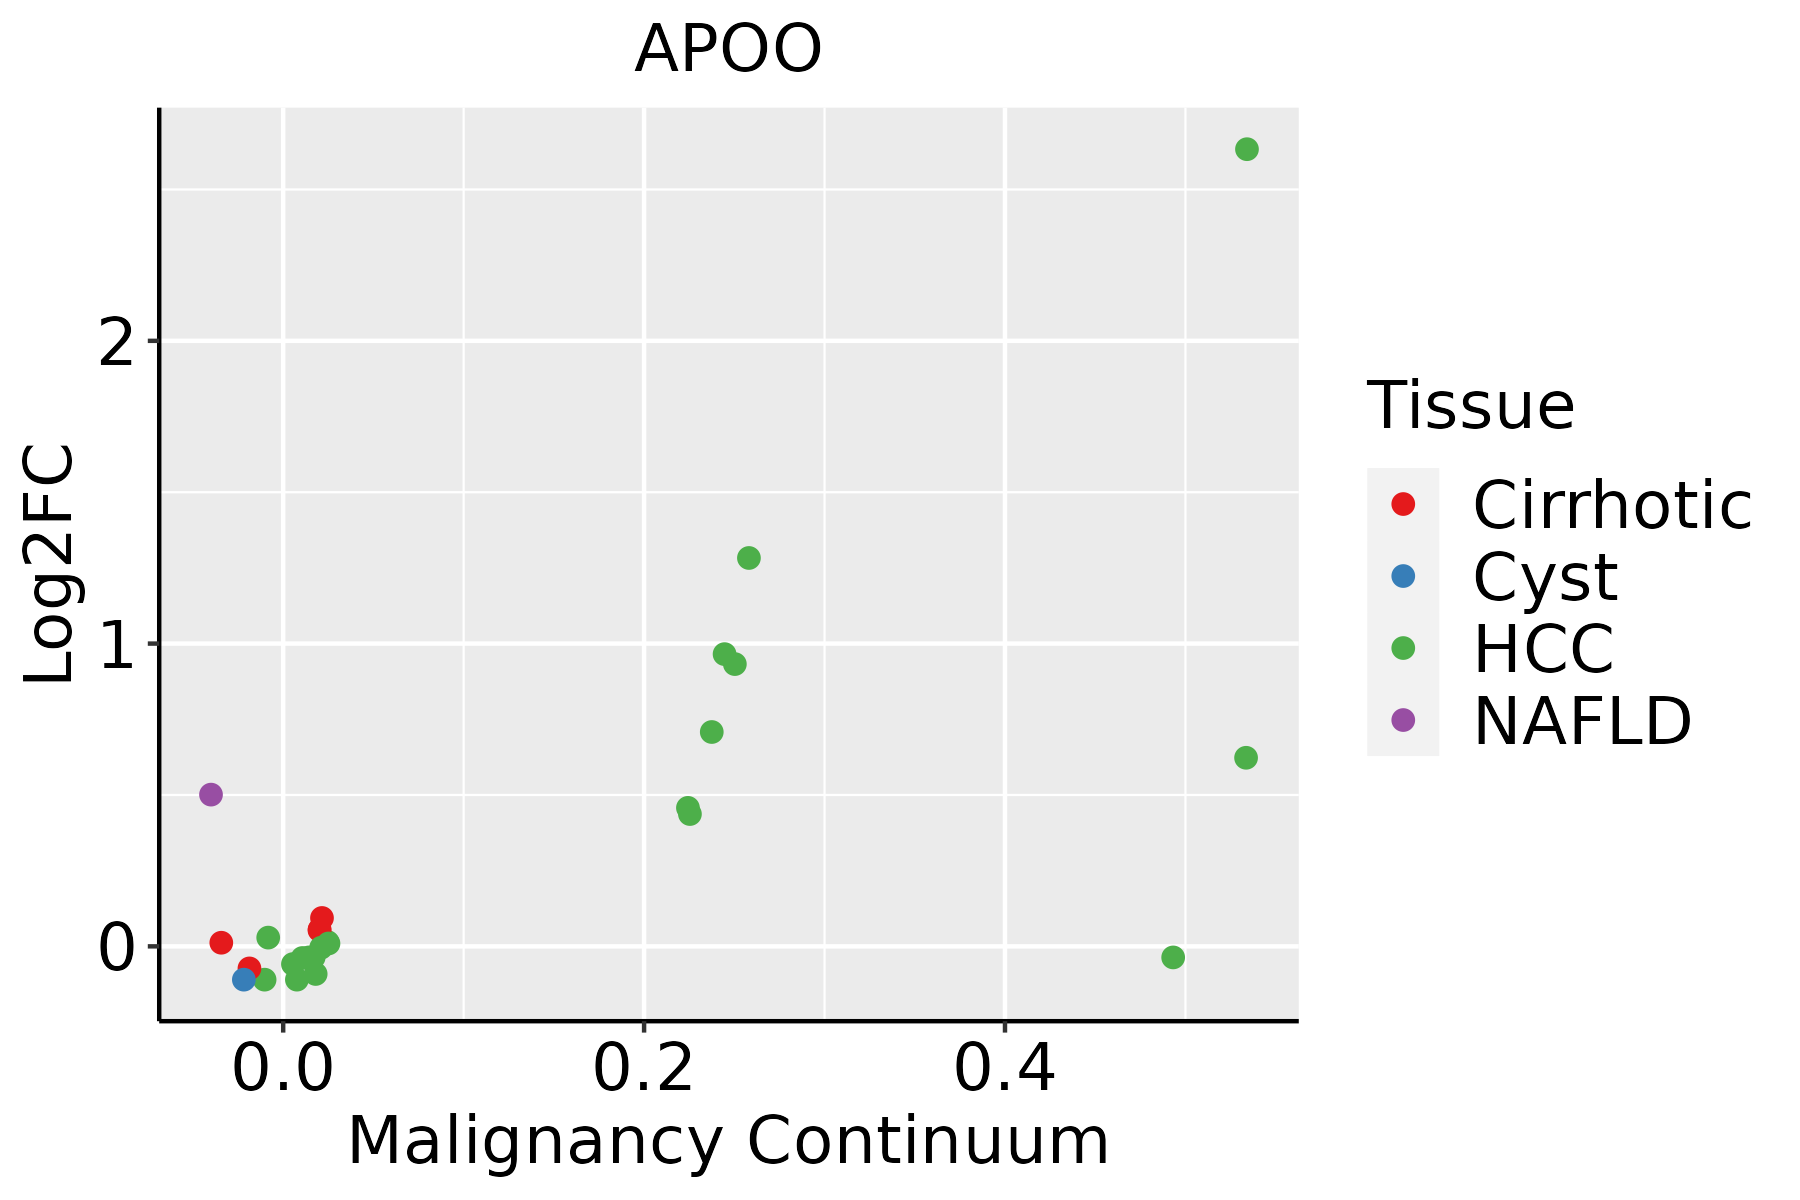 | HCC: Hepatocellular carcinoma |
| NAFLD: Non-alcoholic fatty liver disease |
| Oral Cavity |  | EOLP: Erosive Oral lichen planus |
| LP: leukoplakia |
| NEOLP: Non-erosive oral lichen planus |
| OSCC: Oral squamous cell carcinoma |
| GO ID | Tissue | Disease Stage | Description | Gene Ratio | Bg Ratio | pvalue | p.adjust | Count |
| GO:00070067 | Cervix | CC | mitochondrial membrane organization | 28/2311 | 116/18723 | 3.28e-04 | 3.47e-03 | 28 |
| GO:00070074 | Cervix | CC | inner mitochondrial membrane organization | 11/2311 | 38/18723 | 4.94e-03 | 2.95e-02 | 11 |
| GO:0007006 | Colorectum | AD | mitochondrial membrane organization | 48/3918 | 116/18723 | 4.53e-07 | 1.72e-05 | 48 |
| GO:0007007 | Colorectum | AD | inner mitochondrial membrane organization | 18/3918 | 38/18723 | 2.45e-04 | 3.09e-03 | 18 |
| GO:0010876 | Colorectum | AD | lipid localization | 120/3918 | 448/18723 | 1.59e-03 | 1.33e-02 | 120 |
| GO:0006869 | Colorectum | AD | lipid transport | 108/3918 | 398/18723 | 1.67e-03 | 1.39e-02 | 108 |
| GO:00070062 | Colorectum | MSS | mitochondrial membrane organization | 42/3467 | 116/18723 | 4.99e-06 | 1.38e-04 | 42 |
| GO:00070072 | Colorectum | MSS | inner mitochondrial membrane organization | 14/3467 | 38/18723 | 6.00e-03 | 4.03e-02 | 14 |
| GO:00108761 | Colorectum | MSS | lipid localization | 104/3467 | 448/18723 | 6.76e-03 | 4.38e-02 | 104 |
| GO:00068691 | Colorectum | FAP | lipid transport | 81/2622 | 398/18723 | 2.84e-04 | 3.76e-03 | 81 |
| GO:00108762 | Colorectum | FAP | lipid localization | 85/2622 | 448/18723 | 1.92e-03 | 1.63e-02 | 85 |
| GO:00068692 | Colorectum | CRC | lipid transport | 63/2078 | 398/18723 | 2.36e-03 | 2.26e-02 | 63 |
| GO:00108763 | Colorectum | CRC | lipid localization | 68/2078 | 448/18723 | 4.60e-03 | 3.58e-02 | 68 |
| GO:000700619 | Esophagus | ESCC | mitochondrial membrane organization | 93/8552 | 116/18723 | 2.16e-14 | 1.11e-12 | 93 |
| GO:000700713 | Esophagus | ESCC | inner mitochondrial membrane organization | 31/8552 | 38/18723 | 5.93e-06 | 6.10e-05 | 31 |
| GO:00424072 | Esophagus | ESCC | cristae formation | 13/8552 | 16/18723 | 4.05e-03 | 1.62e-02 | 13 |
| GO:00108765 | Liver | NAFLD | lipid localization | 79/1882 | 448/18723 | 4.75e-07 | 2.92e-05 | 79 |
| GO:00068694 | Liver | NAFLD | lipid transport | 71/1882 | 398/18723 | 1.16e-06 | 5.59e-05 | 71 |
| GO:000700612 | Liver | HCC | mitochondrial membrane organization | 80/7958 | 116/18723 | 7.09e-09 | 1.81e-07 | 80 |
| GO:000700711 | Liver | HCC | inner mitochondrial membrane organization | 28/7958 | 38/18723 | 9.60e-05 | 8.34e-04 | 28 |
| Hugo Symbol | Variant Class | Variant Classification | dbSNP RS | HGVSc | HGVSp | HGVSp Short | SWISSPROT | BIOTYPE | SIFT | PolyPhen | Tumor Sample Barcode | Tissue | Histology | Sex | Age | Stage | Therapy Types | Drugs | Outcome |
| APOO | SNV | Missense_Mutation | novel | c.412T>C | p.Tyr138His | p.Y138H | Q9BUR5 | protein_coding | deleterious(0) | probably_damaging(0.983) | TCGA-A8-A094-01 | Breast | breast invasive carcinoma | Female | >=65 | I/II | Unknown | Unknown | SD |
| APOO | SNV | Missense_Mutation | novel | c.382N>C | p.Ala128Pro | p.A128P | Q9BUR5 | protein_coding | deleterious(0.02) | probably_damaging(0.926) | TCGA-LL-A8F5-01 | Breast | breast invasive carcinoma | Female | <65 | I/II | Chemotherapy | cyclophosphamide | SD |
| APOO | SNV | Missense_Mutation | novel | c.480N>T | p.Gln160His | p.Q160H | Q9BUR5 | protein_coding | deleterious(0) | probably_damaging(0.93) | TCGA-A5-A0G2-01 | Endometrium | uterine corpus endometrioid carcinoma | Female | <65 | III/IV | Unknown | Unknown | SD |
| APOO | SNV | Missense_Mutation | rs373029808 | c.469G>A | p.Val157Met | p.V157M | Q9BUR5 | protein_coding | deleterious(0.02) | possibly_damaging(0.456) | TCGA-A5-A1OF-01 | Endometrium | uterine corpus endometrioid carcinoma | Female | <65 | I/II | Unknown | Unknown | SD |
| APOO | SNV | Missense_Mutation | novel | c.296N>T | p.Ser99Ile | p.S99I | Q9BUR5 | protein_coding | deleterious(0.04) | possibly_damaging(0.715) | TCGA-AP-A1DV-01 | Endometrium | uterine corpus endometrioid carcinoma | Female | <65 | I/II | Unknown | Unknown | SD |
| APOO | SNV | Missense_Mutation | novel | c.583C>T | p.Pro195Ser | p.P195S | Q9BUR5 | protein_coding | tolerated_low_confidence(0.09) | benign(0.001) | TCGA-DF-A2KN-01 | Endometrium | uterine corpus endometrioid carcinoma | Female | Unknown | I/II | Unknown | Unknown | SD |
| APOO | SNV | Missense_Mutation | rs369973145 | c.416N>T | p.Pro139Leu | p.P139L | Q9BUR5 | protein_coding | deleterious(0.01) | probably_damaging(0.972) | TCGA-DF-A2KU-01 | Endometrium | uterine corpus endometrioid carcinoma | Female | Unknown | I/II | Unknown | Unknown | SD |
| APOO | SNV | Missense_Mutation | rs868511129 | c.149N>T | p.Ser50Leu | p.S50L | Q9BUR5 | protein_coding | tolerated(0.56) | possibly_damaging(0.634) | TCGA-E6-A1LX-01 | Endometrium | uterine corpus endometrioid carcinoma | Female | <65 | I/II | Unknown | Unknown | SD |
| APOO | SNV | Missense_Mutation | rs369973145 | c.416C>T | p.Pro139Leu | p.P139L | Q9BUR5 | protein_coding | deleterious(0.01) | probably_damaging(0.972) | TCGA-EO-A22U-01 | Endometrium | uterine corpus endometrioid carcinoma | Female | >=65 | I/II | Unknown | Unknown | SD |
| APOO | SNV | Missense_Mutation | novel | c.176A>G | p.Gln59Arg | p.Q59R | Q9BUR5 | protein_coding | tolerated(0.07) | possibly_damaging(0.502) | TCGA-52-7809-01 | Lung | lung squamous cell carcinoma | Male | >=65 | I/II | Unknown | Unknown | PD |


