
|
|||||
|
 | |
| |
| |
| |
| |
| |
|
Gene: APOM |
Gene summary for APOM |
| Gene information | Species | Human | Gene symbol | APOM | Gene ID | 55937 |
| Gene name | apolipoprotein M | |
| Gene Alias | G3a | |
| Cytomap | 6p21.33 | |
| Gene Type | protein-coding | GO ID | GO:0006807 | UniProtAcc | A0A1U9X793 |
Top |
Malignant transformation analysis |
| Identification of the aberrant gene expression in precancerous and cancerous lesions by comparing the gene expression of stem-like cells in diseased tissues with normal stem cells |
| Entrez ID | Symbol | Replicates | Species | Organ | Tissue | Adj P-value | Log2FC | Malignancy |
| 55937 | APOM | HCC1_Meng | Human | Liver | HCC | 1.24e-119 | 1.64e+00 | 0.0246 |
| 55937 | APOM | HCC2_Meng | Human | Liver | HCC | 1.67e-03 | -1.08e-01 | 0.0107 |
| 55937 | APOM | cirrhotic2 | Human | Liver | Cirrhotic | 8.53e-03 | 6.49e-03 | 0.0201 |
| 55937 | APOM | HCC1 | Human | Liver | HCC | 3.99e-13 | 3.49e+00 | 0.5336 |
| 55937 | APOM | HCC2 | Human | Liver | HCC | 9.69e-24 | 3.48e+00 | 0.5341 |
| 55937 | APOM | Pt13.a | Human | Liver | HCC | 6.49e-50 | 8.36e-01 | 0.021 |
| 55937 | APOM | Pt13.b | Human | Liver | HCC | 9.14e-56 | 5.76e-01 | 0.0251 |
| 55937 | APOM | Pt13.c | Human | Liver | HCC | 3.48e-02 | 4.74e-01 | 0.0076 |
| 55937 | APOM | Pt14.a | Human | Liver | HCC | 7.16e-03 | 1.48e-01 | 0.0169 |
| 55937 | APOM | Pt14.b | Human | Liver | HCC | 1.02e-05 | 3.59e-01 | 0.018 |
| 55937 | APOM | Pt14.d | Human | Liver | HCC | 3.31e-04 | 1.58e-01 | 0.0143 |
| 55937 | APOM | S014 | Human | Liver | HCC | 1.20e-26 | 2.27e+00 | 0.2254 |
| 55937 | APOM | S015 | Human | Liver | HCC | 4.49e-44 | 3.39e+00 | 0.2375 |
| 55937 | APOM | S016 | Human | Liver | HCC | 3.52e-26 | 2.73e+00 | 0.2243 |
| 55937 | APOM | S028 | Human | Liver | HCC | 3.95e-22 | 1.22e+00 | 0.2503 |
| 55937 | APOM | S029 | Human | Liver | HCC | 7.12e-24 | 1.65e+00 | 0.2581 |
| Page: 1 |
| Tissue | Expression Dynamics | Abbreviation |
| Liver | 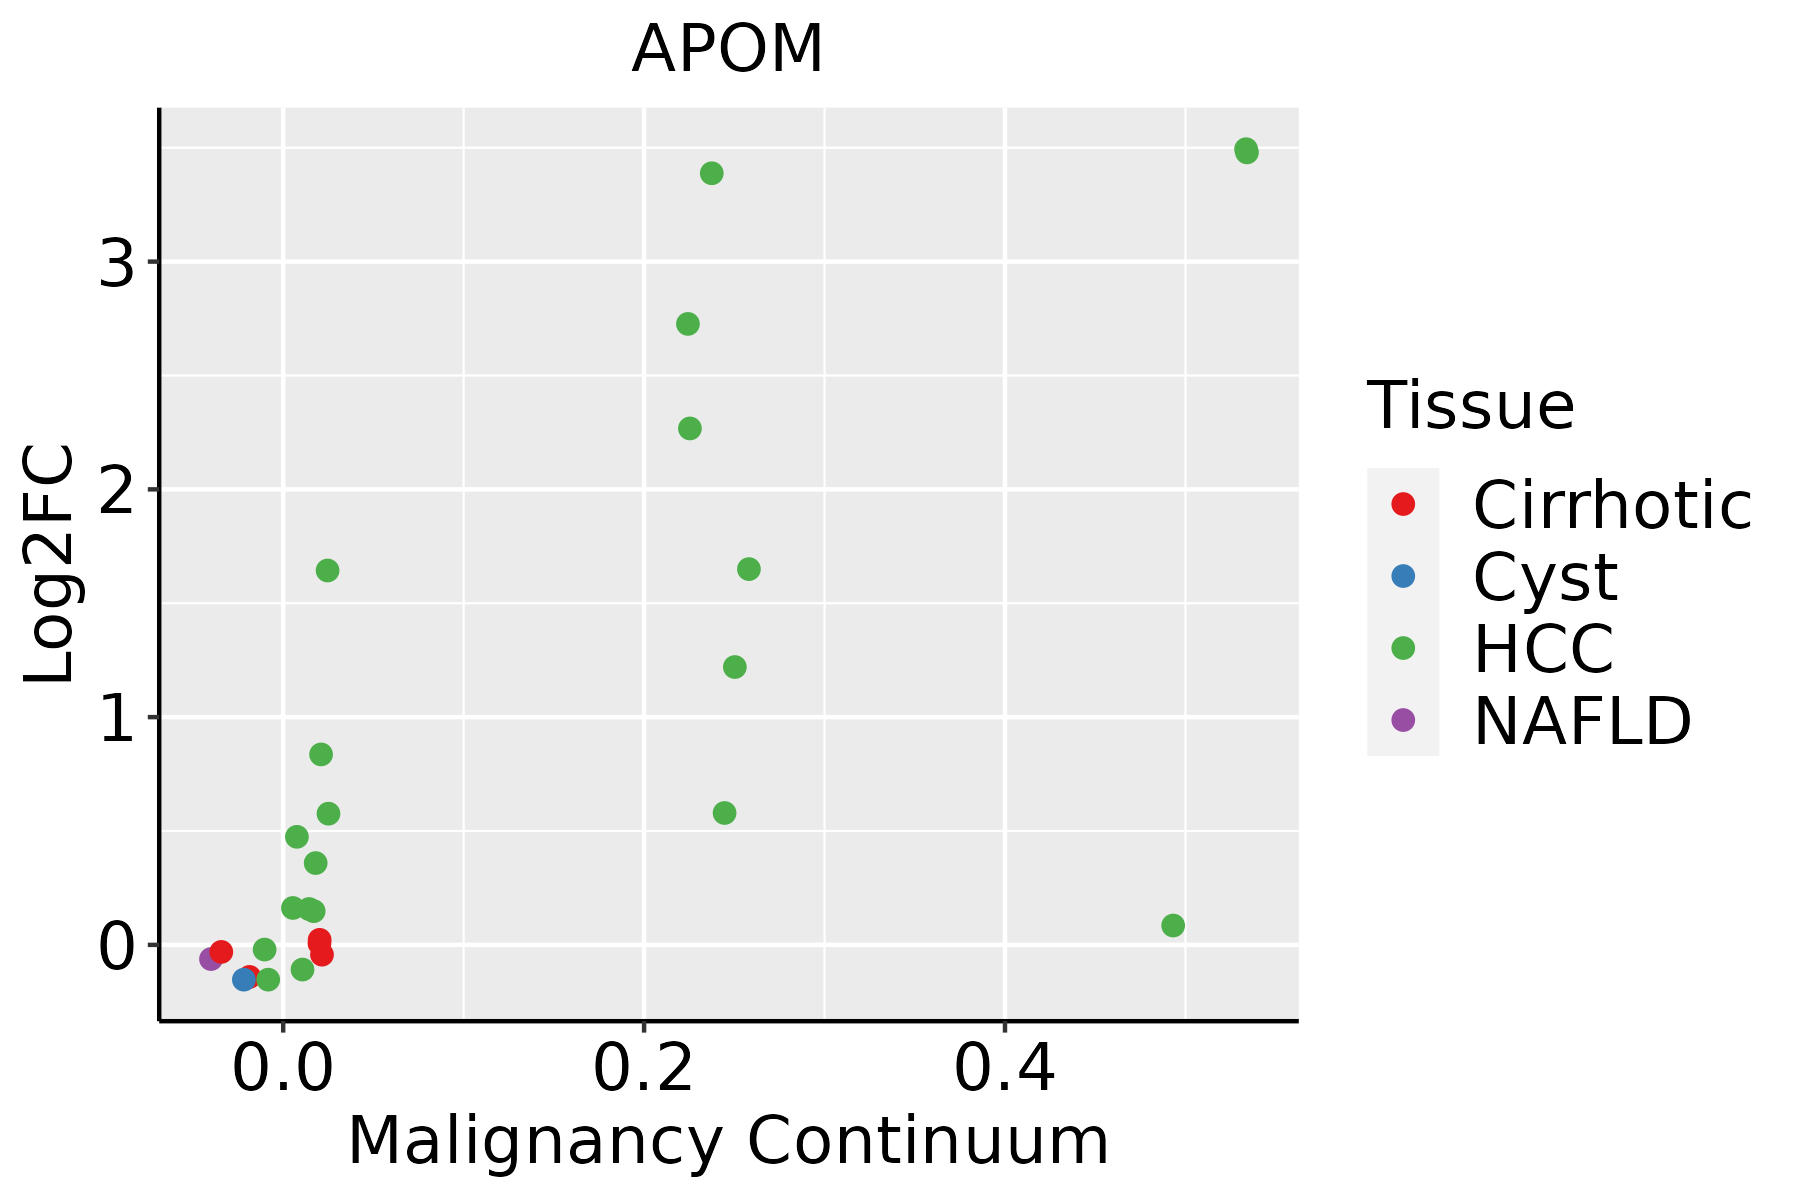 | HCC: Hepatocellular carcinoma |
| NAFLD: Non-alcoholic fatty liver disease |
| ∗log2FC in expression of this searched gene in stem-like cells from each diseased tissue sample relative to stem-like cells in normal samples in each tissue plotted against the malignancy continuum. Samples are colored based on if they are from different disease stage. |
Top |
Malignant transformation related pathway analysis |
| Find out the enriched GO biological processes and KEGG pathways involved in transition from healthy to precancer to cancer |
| Tissue | Disease Stage | Enriched GO biological Processes |
| Colorectum | AD |  |
| Colorectum | SER |  |
| Colorectum | MSS |  |
| Colorectum | MSI-H |  |
| Colorectum | FAP |  |
| ∗Top 15 enriched GO BP terms are showed in the bar plot of each disease state in each tissue. Each row represents a significant GO biological process which is colored according to the -log10(p.adjust). |
| Page: 1 2 3 4 5 6 7 8 9 |
| GO ID | Tissue | Disease Stage | Description | Gene Ratio | Bg Ratio | pvalue | p.adjust | Count |
| GO:005508811 | Liver | Cirrhotic | lipid homeostasis | 74/4634 | 167/18723 | 2.46e-08 | 8.51e-07 | 74 |
| GO:000963612 | Liver | Cirrhotic | response to toxic substance | 104/4634 | 262/18723 | 5.63e-08 | 1.74e-06 | 104 |
| GO:000974312 | Liver | Cirrhotic | response to carbohydrate | 101/4634 | 253/18723 | 6.24e-08 | 1.92e-06 | 101 |
| GO:003428412 | Liver | Cirrhotic | response to monosaccharide | 90/4634 | 225/18723 | 2.87e-07 | 7.01e-06 | 90 |
| GO:004263211 | Liver | Cirrhotic | cholesterol homeostasis | 46/4634 | 96/18723 | 7.15e-07 | 1.52e-05 | 46 |
| GO:005509211 | Liver | Cirrhotic | sterol homeostasis | 46/4634 | 97/18723 | 1.04e-06 | 2.13e-05 | 46 |
| GO:000974612 | Liver | Cirrhotic | response to hexose | 86/4634 | 219/18723 | 1.30e-06 | 2.59e-05 | 86 |
| GO:00097497 | Liver | Cirrhotic | response to glucose | 82/4634 | 212/18723 | 4.54e-06 | 7.51e-05 | 82 |
| GO:00987547 | Liver | Cirrhotic | detoxification | 60/4634 | 152/18723 | 4.09e-05 | 4.86e-04 | 60 |
| GO:001087611 | Liver | Cirrhotic | lipid localization | 147/4634 | 448/18723 | 6.24e-05 | 7.12e-04 | 147 |
| GO:00972377 | Liver | Cirrhotic | cellular response to toxic substance | 50/4634 | 124/18723 | 9.20e-05 | 9.79e-04 | 50 |
| GO:19907487 | Liver | Cirrhotic | cellular detoxification | 47/4634 | 116/18723 | 1.28e-04 | 1.26e-03 | 47 |
| GO:0042157 | Liver | Cirrhotic | lipoprotein metabolic process | 53/4634 | 135/18723 | 1.32e-04 | 1.29e-03 | 53 |
| GO:000686911 | Liver | Cirrhotic | lipid transport | 128/4634 | 398/18723 | 4.54e-04 | 3.69e-03 | 128 |
| GO:00343681 | Liver | Cirrhotic | protein-lipid complex remodeling | 16/4634 | 30/18723 | 7.20e-04 | 5.36e-03 | 16 |
| GO:00343691 | Liver | Cirrhotic | plasma lipoprotein particle remodeling | 16/4634 | 30/18723 | 7.20e-04 | 5.36e-03 | 16 |
| GO:00333441 | Liver | Cirrhotic | cholesterol efflux | 29/4634 | 69/18723 | 1.20e-03 | 8.12e-03 | 29 |
| GO:001591811 | Liver | Cirrhotic | sterol transport | 48/4634 | 130/18723 | 1.32e-03 | 8.83e-03 | 48 |
| GO:003030111 | Liver | Cirrhotic | cholesterol transport | 44/4634 | 117/18723 | 1.34e-03 | 8.98e-03 | 44 |
| GO:00343671 | Liver | Cirrhotic | protein-containing complex remodeling | 16/4634 | 32/18723 | 1.77e-03 | 1.13e-02 | 16 |
| Page: 1 2 3 |
| Pathway ID | Tissue | Disease Stage | Description | Gene Ratio | Bg Ratio | pvalue | p.adjust | qvalue | Count |
| Page: 1 |
Top |
Cell-cell communication analysis |
| Identification of potential cell-cell interactions between two cell types and their ligand-receptor pairs for different disease states |
| Ligand | Receptor | LRpair | Pathway | Tissue | Disease Stage |
| Page: 1 |
Top |
Single-cell gene regulatory network inference analysis |
| Find out the significant the regulons (TFs) and the target genes of each regulon across cell types for different disease states |
| TF | Cell Type | Tissue | Disease Stage | Target Gene | RSS | Regulon Activity |
| ∗The dot plots of a searched regulon are shown for all cell subpopulations in each disease state of each tissue based on the regulon specific score inferred using pySCENIC and by calculating the average expression. |
| Page: 1 |
Top |
Somatic mutation of malignant transformation related genes |
| Annotation of somatic variants for genes involved in malignant transformation |
| Hugo Symbol | Variant Class | Variant Classification | dbSNP RS | HGVSc | HGVSp | HGVSp Short | SWISSPROT | BIOTYPE | SIFT | PolyPhen | Tumor Sample Barcode | Tissue | Histology | Sex | Age | Stage | Therapy Types | Drugs | Outcome |
| APOM | insertion | In_Frame_Ins | novel | c.411_412insACGAGGTTGAGGCAGGAGAAT | p.Thr137_Gly138insThrArgLeuArgGlnGluAsn | p.T137_G138insTRLRQEN | O95445 | protein_coding | TCGA-AN-A03X-01 | Breast | breast invasive carcinoma | Female | >=65 | I/II | Unknown | Unknown | SD | ||
| APOM | SNV | Missense_Mutation | rs548136627 | c.100N>A | p.Val34Met | p.V34M | O95445 | protein_coding | tolerated(0.23) | benign(0.003) | TCGA-WS-AB45-01 | Colorectum | colon adenocarcinoma | Female | <65 | I/II | Unknown | Unknown | SD |
| APOM | SNV | Missense_Mutation | novel | c.563N>G | p.Asn188Ser | p.N188S | O95445 | protein_coding | tolerated_low_confidence(0.67) | benign(0) | TCGA-AG-A002-01 | Colorectum | rectum adenocarcinoma | Male | <65 | I/II | Unknown | Unknown | SD |
| APOM | SNV | Missense_Mutation | novel | c.274N>T | p.Asp92Tyr | p.D92Y | O95445 | protein_coding | deleterious(0) | possibly_damaging(0.487) | TCGA-A5-A0G2-01 | Endometrium | uterine corpus endometrioid carcinoma | Female | <65 | III/IV | Unknown | Unknown | SD |
| APOM | SNV | Missense_Mutation | rs753977558 | c.427C>T | p.Arg143Cys | p.R143C | O95445 | protein_coding | deleterious(0) | probably_damaging(0.999) | TCGA-AP-A1DV-01 | Endometrium | uterine corpus endometrioid carcinoma | Female | <65 | I/II | Unknown | Unknown | SD |
| APOM | SNV | Missense_Mutation | novel | c.203N>G | p.Asn68Ser | p.N68S | O95445 | protein_coding | tolerated(0.14) | probably_damaging(0.99) | TCGA-AX-A2HD-01 | Endometrium | uterine corpus endometrioid carcinoma | Female | >=65 | III/IV | Unknown | Unknown | SD |
| APOM | SNV | Missense_Mutation | rs529627933 | c.253C>T | p.Arg85Cys | p.R85C | O95445 | protein_coding | deleterious(0.01) | possibly_damaging(0.731) | TCGA-B5-A3FA-01 | Endometrium | uterine corpus endometrioid carcinoma | Female | >=65 | I/II | Unknown | Unknown | SD |
| APOM | SNV | Missense_Mutation | novel | c.445N>T | p.Arg149Cys | p.R149C | O95445 | protein_coding | deleterious(0) | probably_damaging(0.997) | TCGA-EO-A3AV-01 | Endometrium | uterine corpus endometrioid carcinoma | Female | <65 | III/IV | Chemotherapy | carboplatin | CR |
| APOM | SNV | Missense_Mutation | novel | c.179T>C | p.Leu60Ser | p.L60S | O95445 | protein_coding | deleterious(0) | probably_damaging(1) | TCGA-FI-A2D5-01 | Endometrium | uterine corpus endometrioid carcinoma | Female | <65 | III/IV | Chemotherapy | carboplatinum | PD |
| APOM | SNV | Missense_Mutation | c.83A>C | p.Gln28Pro | p.Q28P | O95445 | protein_coding | tolerated(0.43) | benign(0) | TCGA-DD-A119-01 | Liver | liver hepatocellular carcinoma | Male | <65 | III/IV | Unknown | Unknown | SD |
| Page: 1 2 |
Top |
Related drugs of malignant transformation related genes |
| Identification of chemicals and drugs interact with genes involved in malignant transfromation |
| (DGIdb 4.0) |
| Entrez ID | Symbol | Category | Interaction Types | Drug Claim Name | Drug Name | PMIDs |
| Page: 1 |

Copyright 2023-Present -The University of Texas Health Science Center at Houston |