
|
|||||
|
 | |
| |
| |
| |
| |
| |
|
Gene: APOL6 |
Gene summary for APOL6 |
| Gene information | Species | Human | Gene symbol | APOL6 | Gene ID | 80830 |
| Gene name | apolipoprotein L6 | |
| Gene Alias | APOL-VI | |
| Cytomap | 22q12.3 | |
| Gene Type | protein-coding | GO ID | GO:0006807 | UniProtAcc | B3KTP4 |
Top |
Malignant transformation analysis |
| Identification of the aberrant gene expression in precancerous and cancerous lesions by comparing the gene expression of stem-like cells in diseased tissues with normal stem cells |
| Entrez ID | Symbol | Replicates | Species | Organ | Tissue | Adj P-value | Log2FC | Malignancy |
| 80830 | APOL6 | GSM4909281 | Human | Breast | IDC | 2.83e-24 | 6.20e-01 | 0.21 |
| 80830 | APOL6 | GSM4909286 | Human | Breast | IDC | 7.43e-04 | -1.10e-01 | 0.1081 |
| 80830 | APOL6 | GSM4909311 | Human | Breast | IDC | 4.24e-03 | -9.91e-02 | 0.1534 |
| 80830 | APOL6 | GSM4909319 | Human | Breast | IDC | 7.50e-07 | -9.02e-02 | 0.1563 |
| 80830 | APOL6 | GSM4909321 | Human | Breast | IDC | 2.50e-02 | -1.01e-01 | 0.1559 |
| 80830 | APOL6 | P1 | Human | Breast | IDC | 3.96e-04 | 2.20e-01 | 0.1527 |
| 80830 | APOL6 | P2 | Human | Breast | IDC | 1.89e-08 | 5.34e-01 | 0.21 |
| 80830 | APOL6 | DCIS2 | Human | Breast | DCIS | 1.26e-23 | 1.27e-01 | 0.0085 |
| 80830 | APOL6 | HTA11_2487_2000001011 | Human | Colorectum | SER | 6.76e-05 | 3.68e-01 | -0.1808 |
| 80830 | APOL6 | HTA11_78_2000001011 | Human | Colorectum | AD | 5.69e-05 | 3.78e-01 | -0.1088 |
| 80830 | APOL6 | HTA11_347_2000001011 | Human | Colorectum | AD | 2.99e-11 | 4.20e-01 | -0.1954 |
| 80830 | APOL6 | HTA11_2112_2000001011 | Human | Colorectum | SER | 3.17e-05 | 6.37e-01 | -0.2196 |
| 80830 | APOL6 | HTA11_696_2000001011 | Human | Colorectum | AD | 5.41e-06 | 2.34e-01 | -0.1464 |
| 80830 | APOL6 | HTA11_1391_2000001011 | Human | Colorectum | AD | 4.82e-09 | 4.41e-01 | -0.059 |
| 80830 | APOL6 | HTA11_99999970781_79442 | Human | Colorectum | MSS | 1.33e-21 | 6.39e-01 | 0.294 |
| 80830 | APOL6 | HTA11_99999965062_69753 | Human | Colorectum | MSI-H | 6.90e-05 | 1.06e+00 | 0.3487 |
| 80830 | APOL6 | LZE4T | Human | Esophagus | ESCC | 6.47e-07 | 1.80e-01 | 0.0811 |
| 80830 | APOL6 | LZE5T | Human | Esophagus | ESCC | 8.04e-05 | 3.08e-01 | 0.0514 |
| 80830 | APOL6 | LZE8T | Human | Esophagus | ESCC | 1.62e-12 | 1.84e-01 | 0.067 |
| 80830 | APOL6 | LZE20T | Human | Esophagus | ESCC | 1.77e-04 | 1.27e-01 | 0.0662 |
| Page: 1 2 3 4 5 6 7 |
| Tissue | Expression Dynamics | Abbreviation |
| Breast | 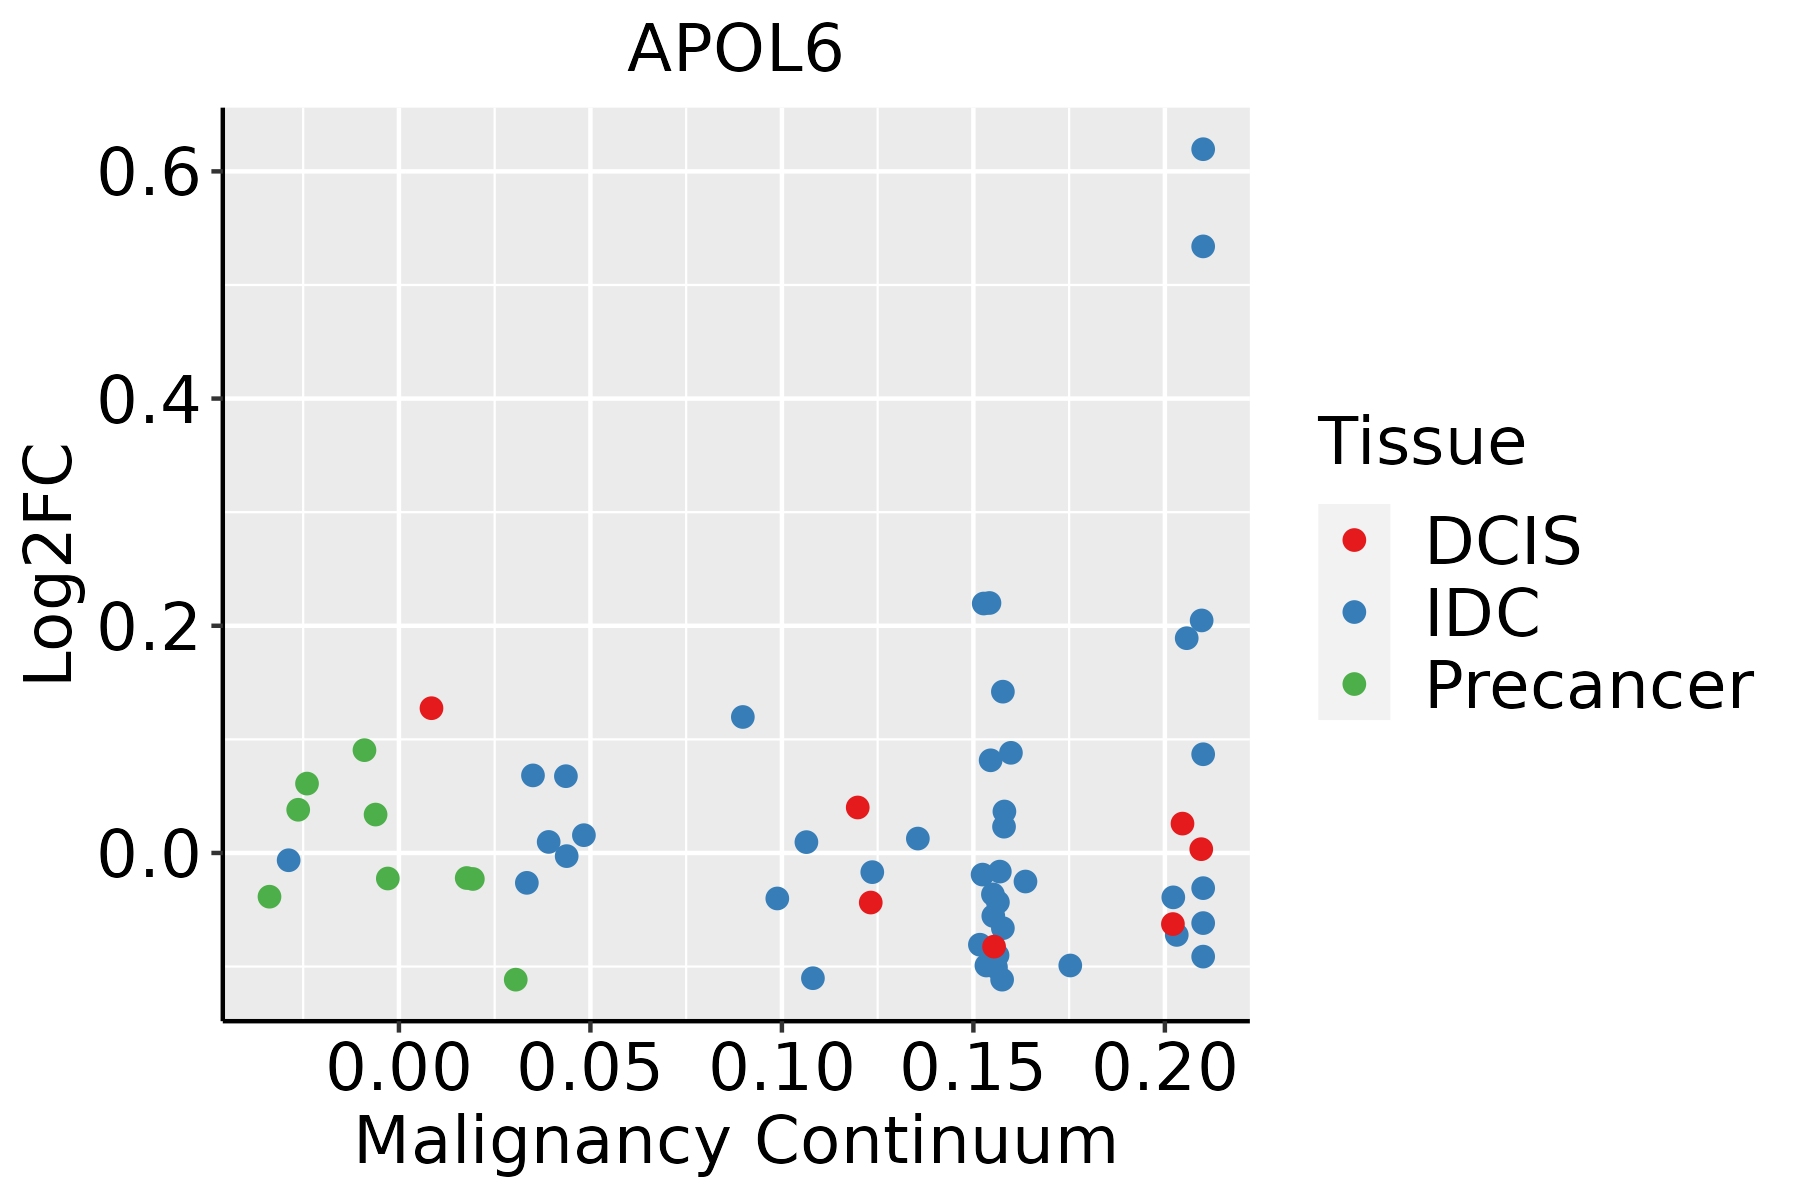 | IDC: Invasive ductal carcinoma |
| DCIS: Ductal carcinoma in situ | ||
| Precancer(BRCA1-mut): Precancerous lesion from BRCA1 mutation carriers | ||
| Colorectum (GSE201348) | 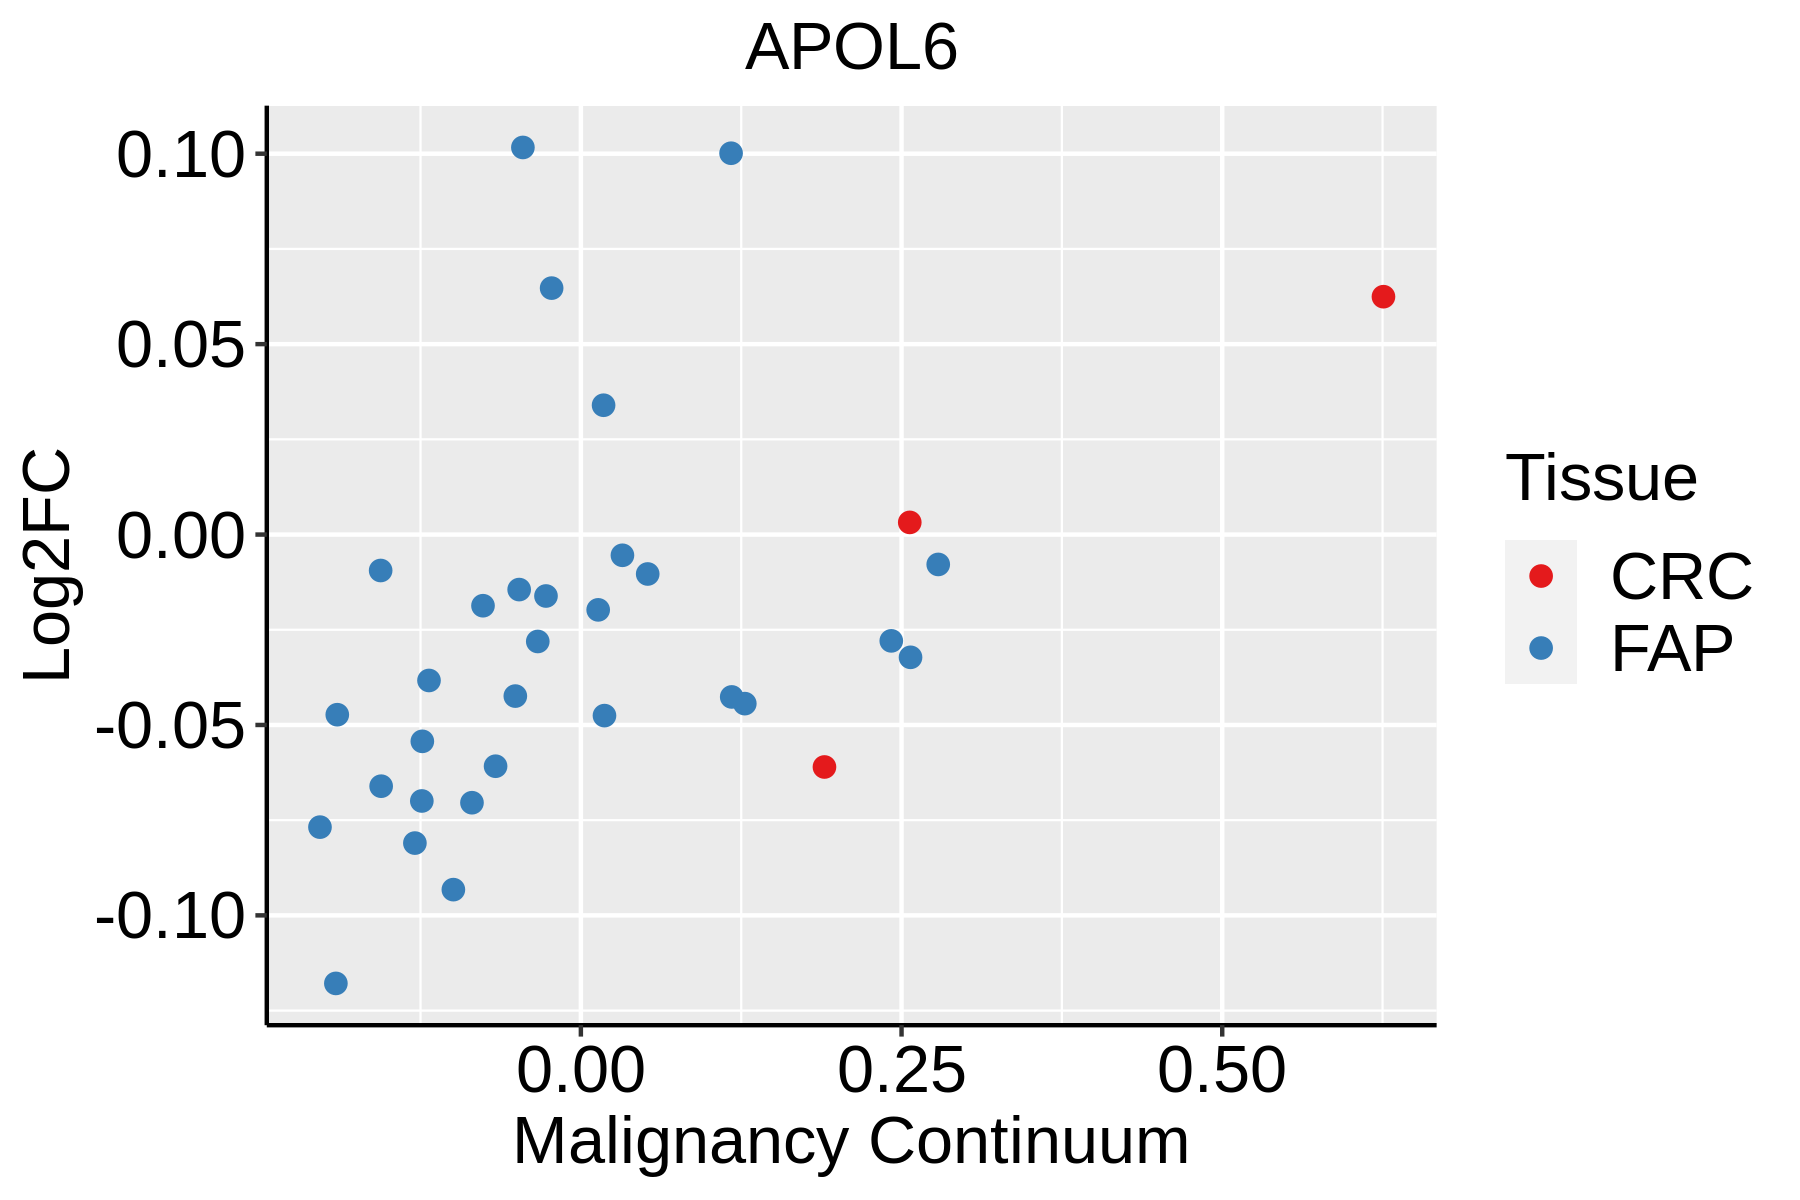 | FAP: Familial adenomatous polyposis |
| CRC: Colorectal cancer | ||
| Colorectum (HTA11) |  | AD: Adenomas |
| SER: Sessile serrated lesions | ||
| MSI-H: Microsatellite-high colorectal cancer | ||
| MSS: Microsatellite stable colorectal cancer | ||
| Esophagus | 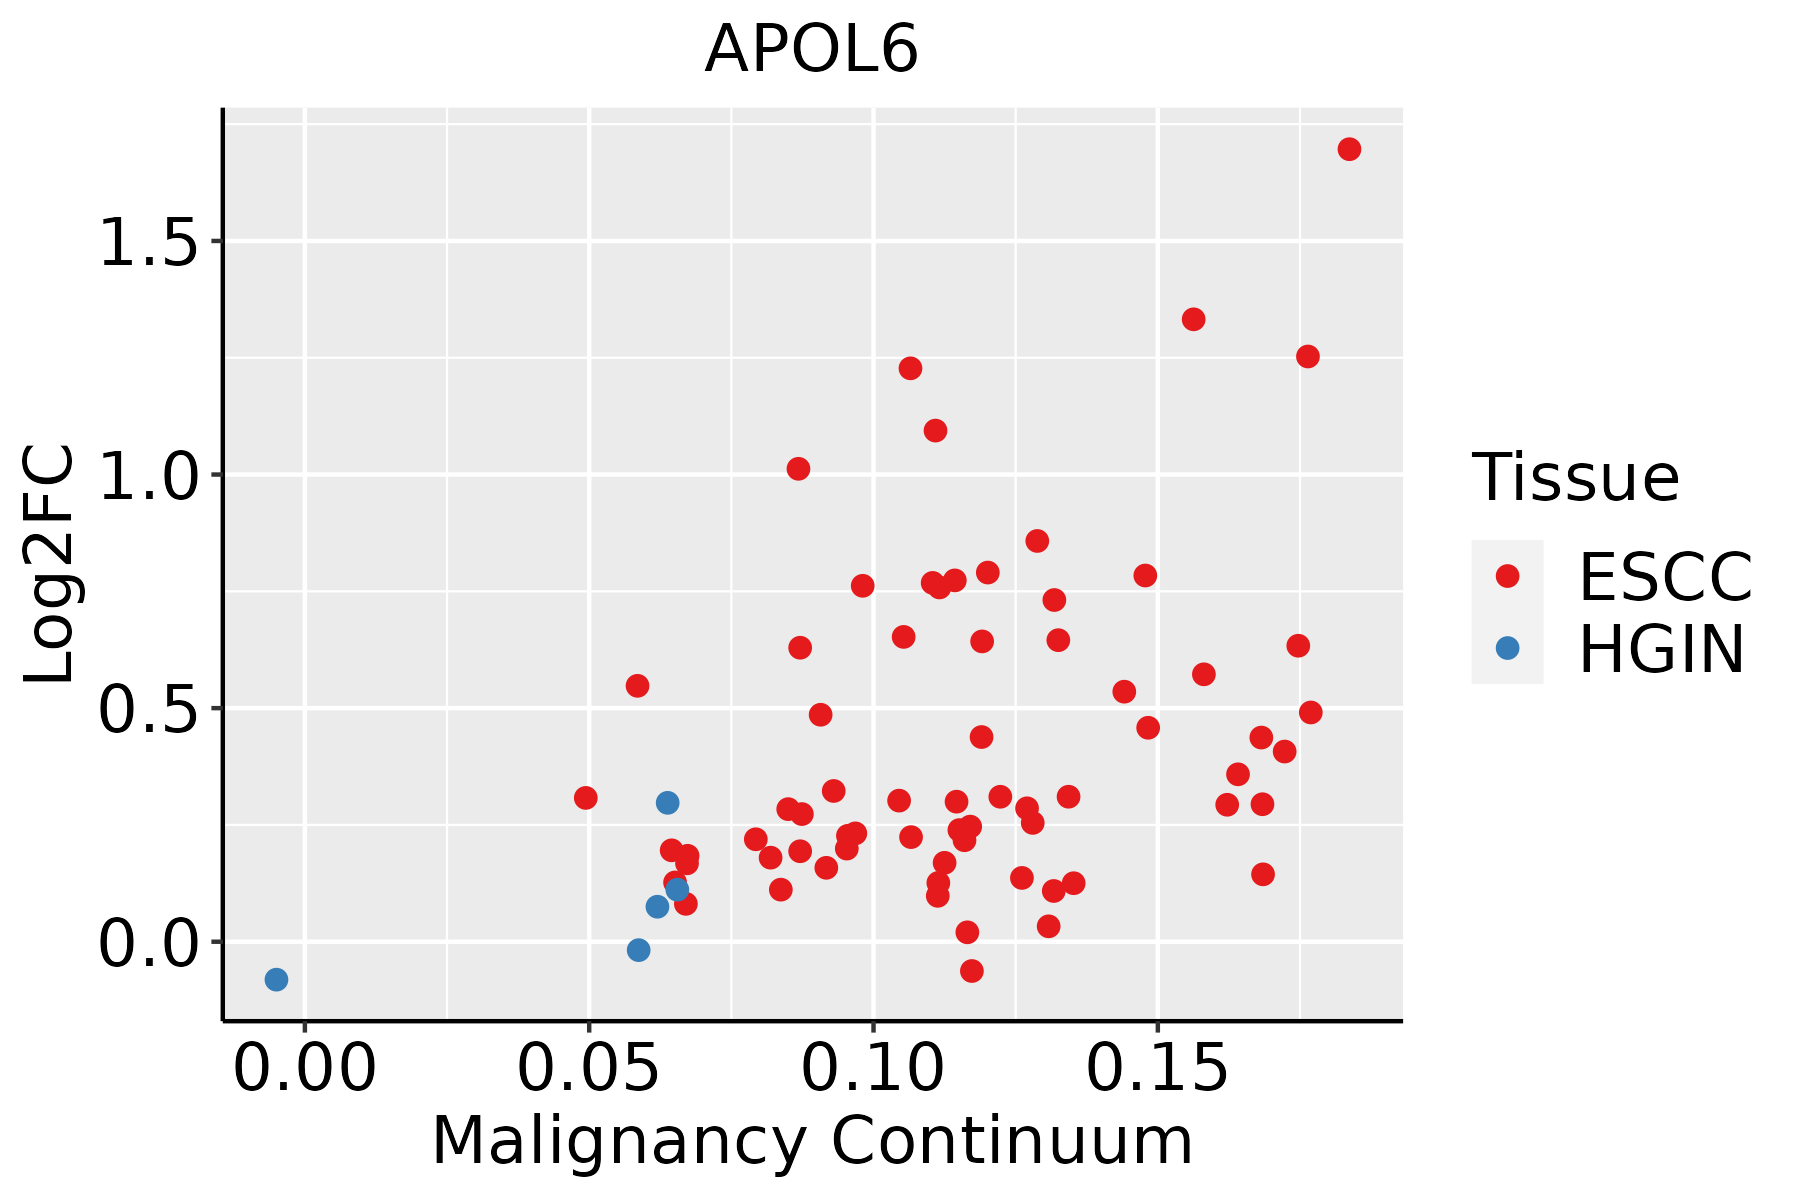 | ESCC: Esophageal squamous cell carcinoma |
| HGIN: High-grade intraepithelial neoplasias | ||
| LGIN: Low-grade intraepithelial neoplasias | ||
| Liver |  | HCC: Hepatocellular carcinoma |
| NAFLD: Non-alcoholic fatty liver disease | ||
| Oral Cavity |  | EOLP: Erosive Oral lichen planus |
| LP: leukoplakia | ||
| NEOLP: Non-erosive oral lichen planus | ||
| OSCC: Oral squamous cell carcinoma | ||
| Prostate | 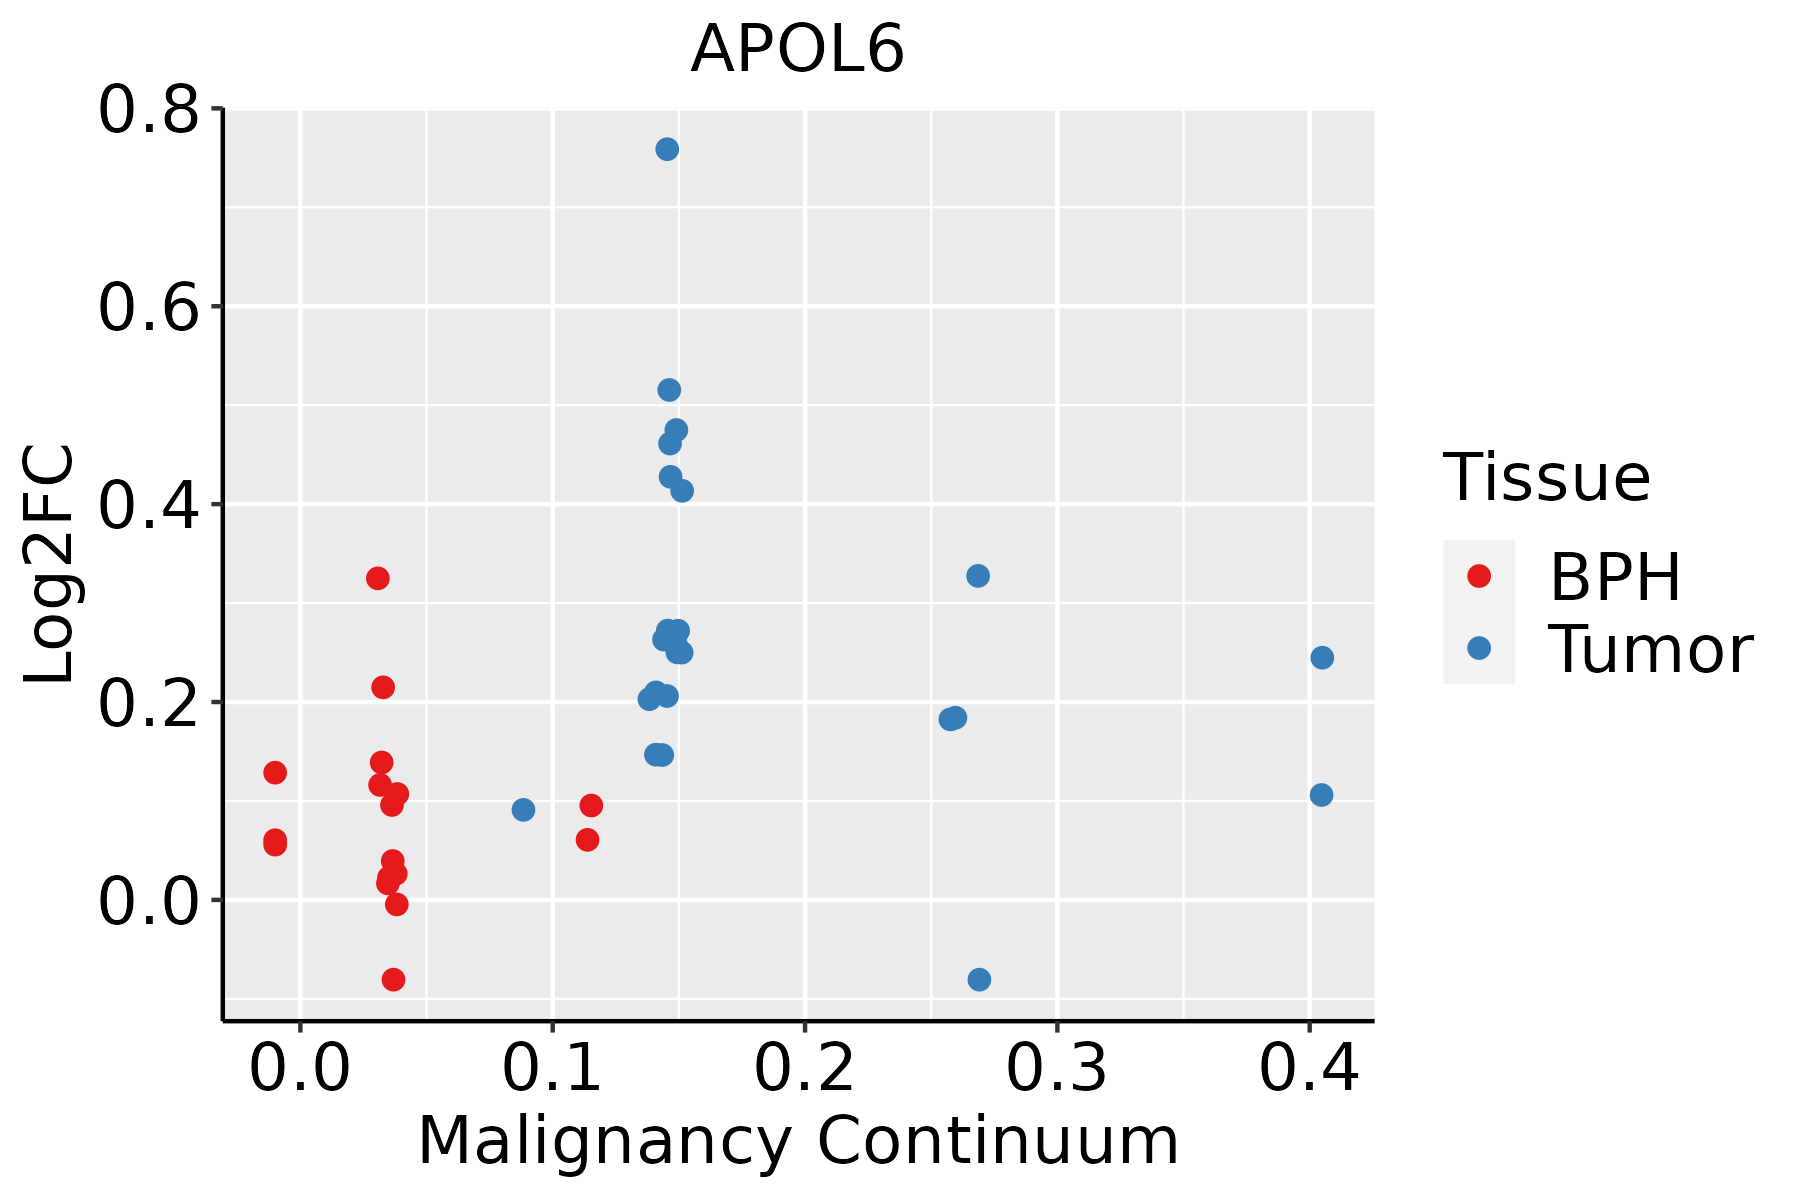 | BPH: Benign Prostatic Hyperplasia |
| Skin |  | AK: Actinic keratosis |
| cSCC: Cutaneous squamous cell carcinoma | ||
| SCCIS:squamous cell carcinoma in situ | ||
| Thyroid |  | ATC: Anaplastic thyroid cancer |
| HT: Hashimoto's thyroiditis | ||
| PTC: Papillary thyroid cancer |
| ∗log2FC in expression of this searched gene in stem-like cells from each diseased tissue sample relative to stem-like cells in normal samples in each tissue plotted against the malignancy continuum. Samples are colored based on if they are from different disease stage. |
Top |
Malignant transformation related pathway analysis |
| Find out the enriched GO biological processes and KEGG pathways involved in transition from healthy to precancer to cancer |
| Tissue | Disease Stage | Enriched GO biological Processes |
| Colorectum | AD |  |
| Colorectum | SER |  |
| Colorectum | MSS |  |
| Colorectum | MSI-H |  |
| Colorectum | FAP |  |
| ∗Top 15 enriched GO BP terms are showed in the bar plot of each disease state in each tissue. Each row represents a significant GO biological process which is colored according to the -log10(p.adjust). |
| Page: 1 2 3 4 5 6 7 8 9 |
| GO ID | Tissue | Disease Stage | Description | Gene Ratio | Bg Ratio | pvalue | p.adjust | Count |
| GO:0010876 | Colorectum | AD | lipid localization | 120/3918 | 448/18723 | 1.59e-03 | 1.33e-02 | 120 |
| GO:0006869 | Colorectum | AD | lipid transport | 108/3918 | 398/18723 | 1.67e-03 | 1.39e-02 | 108 |
| GO:00108761 | Colorectum | MSS | lipid localization | 104/3467 | 448/18723 | 6.76e-03 | 4.38e-02 | 104 |
| GO:00421573 | Esophagus | ESCC | lipoprotein metabolic process | 86/8552 | 135/18723 | 1.78e-05 | 1.57e-04 | 86 |
| GO:00108765 | Liver | NAFLD | lipid localization | 79/1882 | 448/18723 | 4.75e-07 | 2.92e-05 | 79 |
| GO:00068694 | Liver | NAFLD | lipid transport | 71/1882 | 398/18723 | 1.16e-06 | 5.59e-05 | 71 |
| GO:001087611 | Liver | Cirrhotic | lipid localization | 147/4634 | 448/18723 | 6.24e-05 | 7.12e-04 | 147 |
| GO:0042157 | Liver | Cirrhotic | lipoprotein metabolic process | 53/4634 | 135/18723 | 1.32e-04 | 1.29e-03 | 53 |
| GO:000686911 | Liver | Cirrhotic | lipid transport | 128/4634 | 398/18723 | 4.54e-04 | 3.69e-03 | 128 |
| GO:00421571 | Liver | HCC | lipoprotein metabolic process | 86/7958 | 135/18723 | 5.21e-07 | 8.38e-06 | 86 |
| GO:001087621 | Liver | HCC | lipid localization | 228/7958 | 448/18723 | 1.80e-04 | 1.41e-03 | 228 |
| GO:000686921 | Liver | HCC | lipid transport | 198/7958 | 398/18723 | 1.92e-03 | 9.78e-03 | 198 |
| GO:00421572 | Oral cavity | OSCC | lipoprotein metabolic process | 77/7305 | 135/18723 | 1.61e-05 | 1.60e-04 | 77 |
| Page: 1 |
| Pathway ID | Tissue | Disease Stage | Description | Gene Ratio | Bg Ratio | pvalue | p.adjust | qvalue | Count |
| Page: 1 |
Top |
Cell-cell communication analysis |
| Identification of potential cell-cell interactions between two cell types and their ligand-receptor pairs for different disease states |
| Ligand | Receptor | LRpair | Pathway | Tissue | Disease Stage |
| Page: 1 |
Top |
Single-cell gene regulatory network inference analysis |
| Find out the significant the regulons (TFs) and the target genes of each regulon across cell types for different disease states |
| TF | Cell Type | Tissue | Disease Stage | Target Gene | RSS | Regulon Activity |
| ∗The dot plots of a searched regulon are shown for all cell subpopulations in each disease state of each tissue based on the regulon specific score inferred using pySCENIC and by calculating the average expression. |
| Page: 1 |
Top |
Somatic mutation of malignant transformation related genes |
| Annotation of somatic variants for genes involved in malignant transformation |
| Hugo Symbol | Variant Class | Variant Classification | dbSNP RS | HGVSc | HGVSp | HGVSp Short | SWISSPROT | BIOTYPE | SIFT | PolyPhen | Tumor Sample Barcode | Tissue | Histology | Sex | Age | Stage | Therapy Types | Drugs | Outcome |
| APOL6 | SNV | Missense_Mutation | c.248C>G | p.Ser83Cys | p.S83C | Q9BWW8 | protein_coding | tolerated(0.05) | possibly_damaging(0.578) | TCGA-E2-A1IN-01 | Breast | breast invasive carcinoma | Female | <65 | I/II | Hormone Therapy | arimidex | SD | |
| APOL6 | SNV | Missense_Mutation | rs780403475 | c.934N>A | p.Glu312Lys | p.E312K | Q9BWW8 | protein_coding | tolerated(0.18) | benign(0.031) | TCGA-AA-3510-01 | Colorectum | colon adenocarcinoma | Male | >=65 | I/II | Unknown | Unknown | SD |
| APOL6 | SNV | Missense_Mutation | novel | c.216N>T | p.Lys72Asn | p.K72N | Q9BWW8 | protein_coding | deleterious(0.01) | probably_damaging(0.976) | TCGA-AZ-4315-01 | Colorectum | colon adenocarcinoma | Male | <65 | I/II | Unknown | Unknown | SD |
| APOL6 | SNV | Missense_Mutation | c.385N>G | p.Thr129Ala | p.T129A | Q9BWW8 | protein_coding | tolerated(0.1) | benign(0.022) | TCGA-QG-A5Z2-01 | Colorectum | colon adenocarcinoma | Male | <65 | I/II | Unknown | Unknown | SD | |
| APOL6 | SNV | Missense_Mutation | rs775222843 | c.787G>A | p.Ala263Thr | p.A263T | Q9BWW8 | protein_coding | tolerated(0.38) | benign(0.026) | TCGA-DC-6681-01 | Colorectum | rectum adenocarcinoma | Female | >=65 | I/II | Chemotherapy | 5-fluorouracil | SD |
| APOL6 | SNV | Missense_Mutation | novel | c.882G>T | p.Gln294His | p.Q294H | Q9BWW8 | protein_coding | deleterious(0.04) | possibly_damaging(0.628) | TCGA-AJ-A3EK-01 | Endometrium | uterine corpus endometrioid carcinoma | Female | <65 | I/II | Chemotherapy | carboplatin | CR |
| APOL6 | SNV | Missense_Mutation | rs780403475 | c.934G>A | p.Glu312Lys | p.E312K | Q9BWW8 | protein_coding | tolerated(0.18) | benign(0.031) | TCGA-AJ-A3EL-01 | Endometrium | uterine corpus endometrioid carcinoma | Female | <65 | I/II | Unknown | Unknown | SD |
| APOL6 | SNV | Missense_Mutation | rs371590566 | c.190G>A | p.Ala64Thr | p.A64T | Q9BWW8 | protein_coding | deleterious(0) | probably_damaging(1) | TCGA-AP-A0LM-01 | Endometrium | uterine corpus endometrioid carcinoma | Female | <65 | III/IV | Chemotherapy | cisplatin | SD |
| APOL6 | SNV | Missense_Mutation | novel | c.518A>C | p.Asn173Thr | p.N173T | Q9BWW8 | protein_coding | tolerated(0.23) | benign(0.297) | TCGA-AP-A0LM-01 | Endometrium | uterine corpus endometrioid carcinoma | Female | <65 | III/IV | Chemotherapy | cisplatin | SD |
| APOL6 | SNV | Missense_Mutation | novel | c.904N>T | p.Gly302Trp | p.G302W | Q9BWW8 | protein_coding | deleterious(0.01) | possibly_damaging(0.869) | TCGA-AX-A06F-01 | Endometrium | uterine corpus endometrioid carcinoma | Female | <65 | III/IV | Chemotherapy | carboplatin | SD |
| Page: 1 2 3 4 |
Top |
Related drugs of malignant transformation related genes |
| Identification of chemicals and drugs interact with genes involved in malignant transfromation |
| (DGIdb 4.0) |
| Entrez ID | Symbol | Category | Interaction Types | Drug Claim Name | Drug Name | PMIDs |
| Page: 1 |

Copyright 2023-Present -The University of Texas Health Science Center at Houston |