
|
|||||
|
 | |
| |
| |
| |
| |
| |
|
Gene: APOL3 |
Gene summary for APOL3 |
| Gene information | Species | Human | Gene symbol | APOL3 | Gene ID | 80833 |
| Gene name | apolipoprotein L3 | |
| Gene Alias | APOLIII | |
| Cytomap | 22q12.3 | |
| Gene Type | protein-coding | GO ID | GO:0006807 | UniProtAcc | A0A024R1G6 |
Top |
Malignant transformation analysis |
| Identification of the aberrant gene expression in precancerous and cancerous lesions by comparing the gene expression of stem-like cells in diseased tissues with normal stem cells |
| Entrez ID | Symbol | Replicates | Species | Organ | Tissue | Adj P-value | Log2FC | Malignancy |
| 80833 | APOL3 | LZE8T | Human | Esophagus | ESCC | 6.71e-04 | 1.69e-01 | 0.067 |
| 80833 | APOL3 | LZE6T | Human | Esophagus | ESCC | 1.62e-02 | 1.99e-01 | 0.0845 |
| 80833 | APOL3 | P2T-E | Human | Esophagus | ESCC | 4.03e-05 | 1.28e-01 | 0.1177 |
| 80833 | APOL3 | P8T-E | Human | Esophagus | ESCC | 2.05e-10 | 2.57e-01 | 0.0889 |
| 80833 | APOL3 | P9T-E | Human | Esophagus | ESCC | 8.38e-03 | 1.08e-01 | 0.1131 |
| 80833 | APOL3 | P11T-E | Human | Esophagus | ESCC | 3.66e-11 | 4.33e-01 | 0.1426 |
| 80833 | APOL3 | P17T-E | Human | Esophagus | ESCC | 1.49e-05 | 2.33e-01 | 0.1278 |
| 80833 | APOL3 | P20T-E | Human | Esophagus | ESCC | 8.24e-04 | 1.20e-01 | 0.1124 |
| 80833 | APOL3 | P21T-E | Human | Esophagus | ESCC | 1.43e-03 | 1.46e-01 | 0.1617 |
| 80833 | APOL3 | P22T-E | Human | Esophagus | ESCC | 6.21e-04 | 1.12e-01 | 0.1236 |
| 80833 | APOL3 | P23T-E | Human | Esophagus | ESCC | 6.93e-10 | 2.08e-01 | 0.108 |
| 80833 | APOL3 | P24T-E | Human | Esophagus | ESCC | 3.53e-15 | 3.38e-01 | 0.1287 |
| 80833 | APOL3 | P26T-E | Human | Esophagus | ESCC | 1.91e-03 | 7.21e-02 | 0.1276 |
| 80833 | APOL3 | P27T-E | Human | Esophagus | ESCC | 2.80e-05 | 8.72e-02 | 0.1055 |
| 80833 | APOL3 | P28T-E | Human | Esophagus | ESCC | 3.14e-02 | 3.06e-02 | 0.1149 |
| 80833 | APOL3 | P36T-E | Human | Esophagus | ESCC | 2.98e-06 | 1.97e-01 | 0.1187 |
| 80833 | APOL3 | P37T-E | Human | Esophagus | ESCC | 7.25e-13 | 2.41e-01 | 0.1371 |
| 80833 | APOL3 | P40T-E | Human | Esophagus | ESCC | 1.39e-13 | 3.86e-01 | 0.109 |
| 80833 | APOL3 | P47T-E | Human | Esophagus | ESCC | 1.12e-04 | 6.92e-02 | 0.1067 |
| 80833 | APOL3 | P48T-E | Human | Esophagus | ESCC | 1.40e-02 | 7.86e-02 | 0.0959 |
| Page: 1 2 3 |
| Tissue | Expression Dynamics | Abbreviation |
| Esophagus |  | ESCC: Esophageal squamous cell carcinoma |
| HGIN: High-grade intraepithelial neoplasias | ||
| LGIN: Low-grade intraepithelial neoplasias | ||
| Liver | 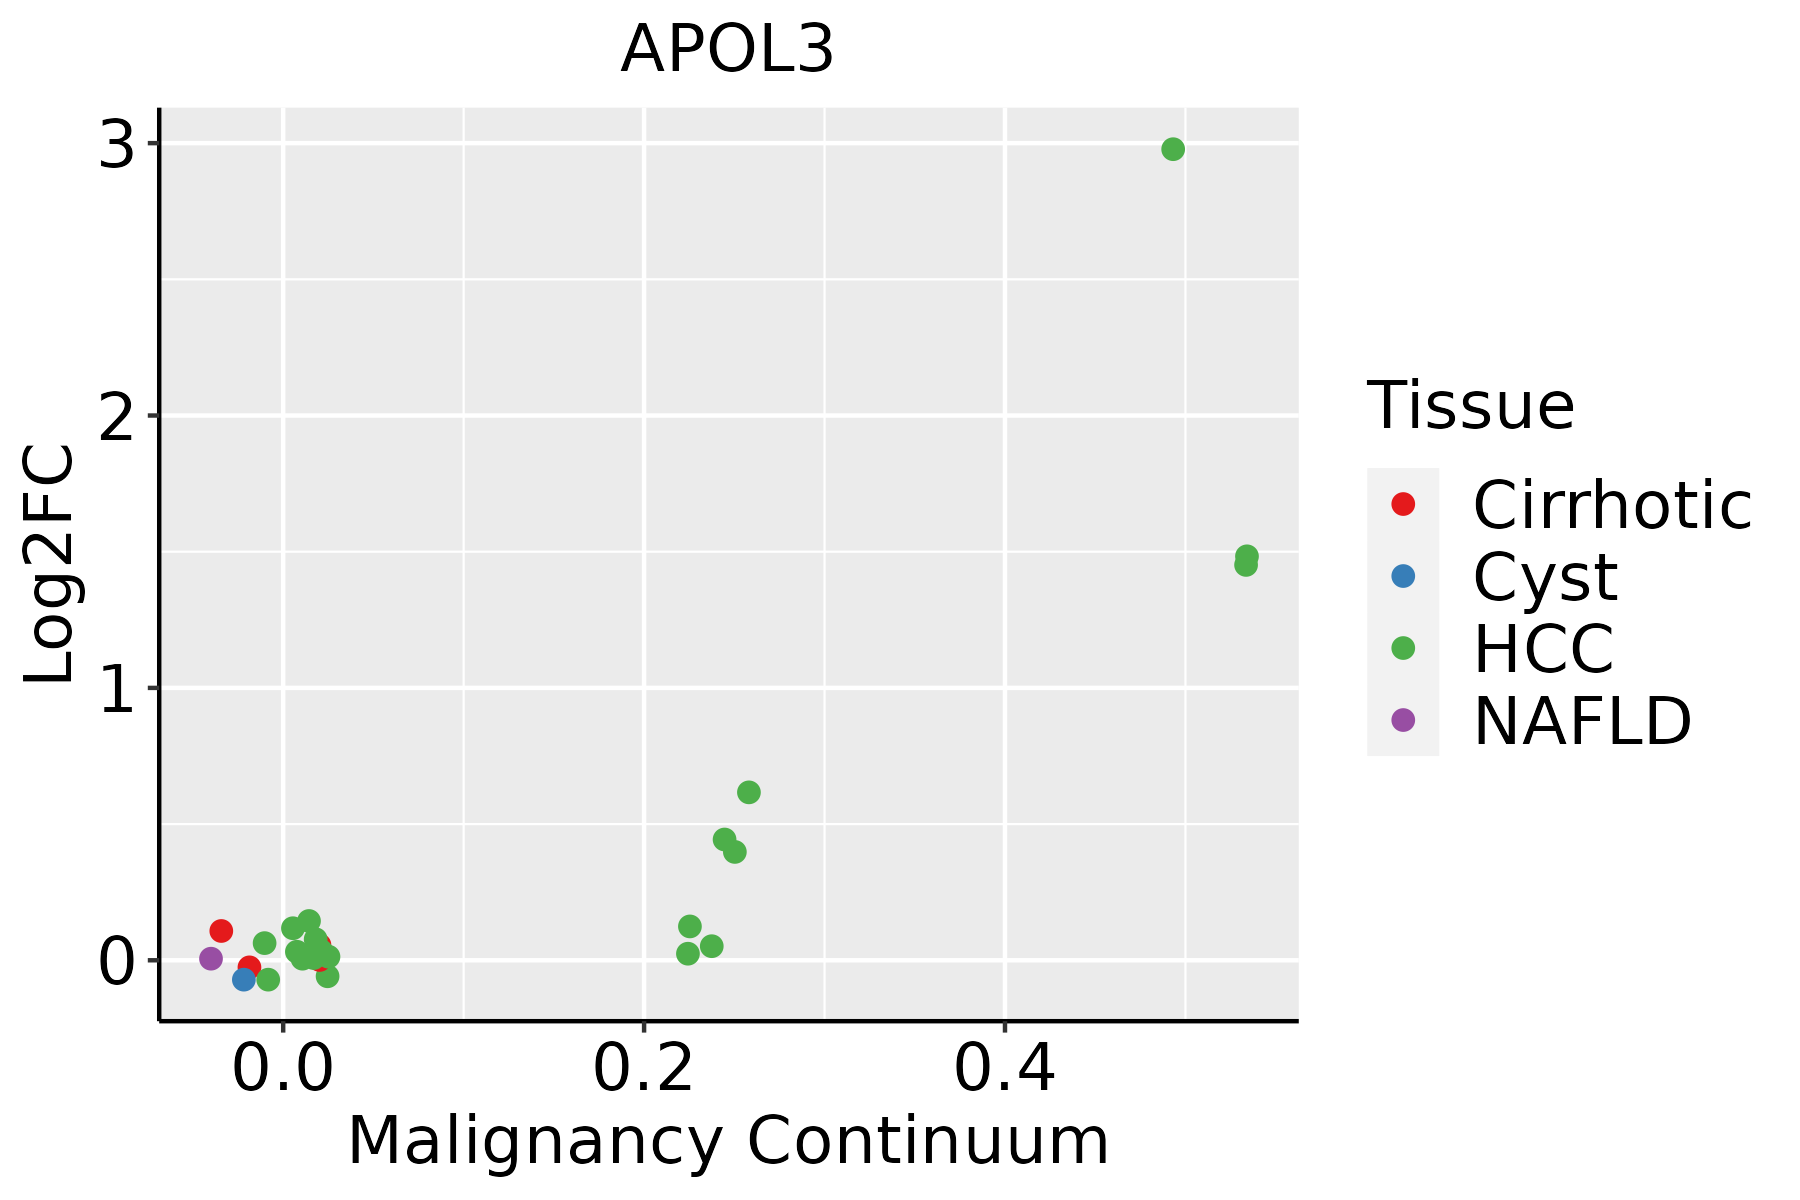 | HCC: Hepatocellular carcinoma |
| NAFLD: Non-alcoholic fatty liver disease | ||
| Oral Cavity |  | EOLP: Erosive Oral lichen planus |
| LP: leukoplakia | ||
| NEOLP: Non-erosive oral lichen planus | ||
| OSCC: Oral squamous cell carcinoma |
| ∗log2FC in expression of this searched gene in stem-like cells from each diseased tissue sample relative to stem-like cells in normal samples in each tissue plotted against the malignancy continuum. Samples are colored based on if they are from different disease stage. |
Top |
Malignant transformation related pathway analysis |
| Find out the enriched GO biological processes and KEGG pathways involved in transition from healthy to precancer to cancer |
| Tissue | Disease Stage | Enriched GO biological Processes |
| Colorectum | AD |  |
| Colorectum | SER |  |
| Colorectum | MSS |  |
| Colorectum | MSI-H |  |
| Colorectum | FAP |  |
| ∗Top 15 enriched GO BP terms are showed in the bar plot of each disease state in each tissue. Each row represents a significant GO biological process which is colored according to the -log10(p.adjust). |
| Page: 1 2 3 4 5 6 7 8 9 |
| GO ID | Tissue | Disease Stage | Description | Gene Ratio | Bg Ratio | pvalue | p.adjust | Count |
| GO:004312318 | Esophagus | ESCC | positive regulation of I-kappaB kinase/NF-kappaB signaling | 132/8552 | 186/18723 | 2.07e-12 | 8.58e-11 | 132 |
| GO:0043122110 | Esophagus | ESCC | regulation of I-kappaB kinase/NF-kappaB signaling | 167/8552 | 249/18723 | 6.11e-12 | 2.32e-10 | 167 |
| GO:000724919 | Esophagus | ESCC | I-kappaB kinase/NF-kappaB signaling | 183/8552 | 281/18723 | 3.02e-11 | 1.01e-09 | 183 |
| GO:00421573 | Esophagus | ESCC | lipoprotein metabolic process | 86/8552 | 135/18723 | 1.78e-05 | 1.57e-04 | 86 |
| GO:00421571 | Liver | HCC | lipoprotein metabolic process | 86/7958 | 135/18723 | 5.21e-07 | 8.38e-06 | 86 |
| GO:000724912 | Liver | HCC | I-kappaB kinase/NF-kappaB signaling | 156/7958 | 281/18723 | 6.66e-06 | 8.00e-05 | 156 |
| GO:004312312 | Liver | HCC | positive regulation of I-kappaB kinase/NF-kappaB signaling | 108/7958 | 186/18723 | 1.28e-05 | 1.43e-04 | 108 |
| GO:004312212 | Liver | HCC | regulation of I-kappaB kinase/NF-kappaB signaling | 138/7958 | 249/18723 | 2.47e-05 | 2.58e-04 | 138 |
| GO:001087621 | Liver | HCC | lipid localization | 228/7958 | 448/18723 | 1.80e-04 | 1.41e-03 | 228 |
| GO:000686921 | Liver | HCC | lipid transport | 198/7958 | 398/18723 | 1.92e-03 | 9.78e-03 | 198 |
| GO:004312218 | Oral cavity | OSCC | regulation of I-kappaB kinase/NF-kappaB signaling | 155/7305 | 249/18723 | 7.79e-14 | 4.14e-12 | 155 |
| GO:004312310 | Oral cavity | OSCC | positive regulation of I-kappaB kinase/NF-kappaB signaling | 122/7305 | 186/18723 | 1.68e-13 | 8.52e-12 | 122 |
| GO:000724910 | Oral cavity | OSCC | I-kappaB kinase/NF-kappaB signaling | 169/7305 | 281/18723 | 4.69e-13 | 2.25e-11 | 169 |
| GO:00421572 | Oral cavity | OSCC | lipoprotein metabolic process | 77/7305 | 135/18723 | 1.61e-05 | 1.60e-04 | 77 |
| GO:004312316 | Oral cavity | LP | positive regulation of I-kappaB kinase/NF-kappaB signaling | 88/4623 | 186/18723 | 1.58e-11 | 1.13e-09 | 88 |
| GO:004312219 | Oral cavity | LP | regulation of I-kappaB kinase/NF-kappaB signaling | 103/4623 | 249/18723 | 4.48e-09 | 1.90e-07 | 103 |
| GO:000724917 | Oral cavity | LP | I-kappaB kinase/NF-kappaB signaling | 110/4623 | 281/18723 | 4.94e-08 | 1.70e-06 | 110 |
| GO:004215711 | Oral cavity | LP | lipoprotein metabolic process | 57/4623 | 135/18723 | 5.59e-06 | 1.11e-04 | 57 |
| GO:004312231 | Oral cavity | NEOLP | regulation of I-kappaB kinase/NF-kappaB signaling | 58/2005 | 249/18723 | 7.81e-09 | 4.09e-07 | 58 |
| GO:000724931 | Oral cavity | NEOLP | I-kappaB kinase/NF-kappaB signaling | 62/2005 | 281/18723 | 2.16e-08 | 9.59e-07 | 62 |
| Page: 1 2 |
| Pathway ID | Tissue | Disease Stage | Description | Gene Ratio | Bg Ratio | pvalue | p.adjust | qvalue | Count |
| Page: 1 |
Top |
Cell-cell communication analysis |
| Identification of potential cell-cell interactions between two cell types and their ligand-receptor pairs for different disease states |
| Ligand | Receptor | LRpair | Pathway | Tissue | Disease Stage |
| Page: 1 |
Top |
Single-cell gene regulatory network inference analysis |
| Find out the significant the regulons (TFs) and the target genes of each regulon across cell types for different disease states |
| TF | Cell Type | Tissue | Disease Stage | Target Gene | RSS | Regulon Activity |
| ∗The dot plots of a searched regulon are shown for all cell subpopulations in each disease state of each tissue based on the regulon specific score inferred using pySCENIC and by calculating the average expression. |
| Page: 1 |
Top |
Somatic mutation of malignant transformation related genes |
| Annotation of somatic variants for genes involved in malignant transformation |
| Hugo Symbol | Variant Class | Variant Classification | dbSNP RS | HGVSc | HGVSp | HGVSp Short | SWISSPROT | BIOTYPE | SIFT | PolyPhen | Tumor Sample Barcode | Tissue | Histology | Sex | Age | Stage | Therapy Types | Drugs | Outcome |
| APOL3 | SNV | Missense_Mutation | rs141623013 | c.886C>T | p.Arg296Cys | p.R296C | O95236 | protein_coding | tolerated(0.08) | benign(0.068) | TCGA-AC-A8OP-01 | Breast | breast invasive carcinoma | Female | >=65 | I/II | Unknown | Unknown | SD |
| APOL3 | SNV | Missense_Mutation | c.310N>A | p.Glu104Lys | p.E104K | O95236 | protein_coding | tolerated(0.19) | benign(0.114) | TCGA-E9-A1RH-01 | Breast | breast invasive carcinoma | Female | <65 | I/II | Chemotherapy | 5-fluorouracil | SD | |
| APOL3 | insertion | Frame_Shift_Ins | novel | c.302_303insAGGG | p.Asn102GlyfsTer2 | p.N102Gfs*2 | O95236 | protein_coding | TCGA-AO-A0J4-01 | Breast | breast invasive carcinoma | Female | <65 | I/II | Chemotherapy | doxorubicin | SD | ||
| APOL3 | insertion | Frame_Shift_Ins | novel | c.301_302insGGGGAGAGGAAGCCCACAAGGG | p.Thr101ArgfsTer9 | p.T101Rfs*9 | O95236 | protein_coding | TCGA-AO-A0J4-01 | Breast | breast invasive carcinoma | Female | <65 | I/II | Chemotherapy | doxorubicin | SD | ||
| APOL3 | deletion | Frame_Shift_Del | novel | c.1190delA | p.Asn397IlefsTer38 | p.N397Ifs*38 | O95236 | protein_coding | TCGA-EW-A2FV-01 | Breast | breast invasive carcinoma | Female | <65 | III/IV | Chemotherapy | docetaxel | SD | ||
| APOL3 | SNV | Missense_Mutation | c.112N>G | p.Gln38Glu | p.Q38E | O95236 | protein_coding | benign(0.007) | TCGA-EK-A3GK-01 | Cervix | cervical & endocervical cancer | Female | <65 | I/II | Unknown | Unknown | SD | ||
| APOL3 | SNV | Missense_Mutation | c.545N>T | p.Arg182Ile | p.R182I | O95236 | protein_coding | deleterious(0) | probably_damaging(0.959) | TCGA-IR-A3LK-01 | Cervix | cervical & endocervical cancer | Female | >=65 | I/II | Chemotherapy | cisplatin | PD | |
| APOL3 | SNV | Missense_Mutation | rs753889786 | c.233N>A | p.Arg78His | p.R78H | O95236 | protein_coding | tolerated(0.12) | benign(0.135) | TCGA-AA-3510-01 | Colorectum | colon adenocarcinoma | Male | >=65 | I/II | Unknown | Unknown | SD |
| APOL3 | SNV | Missense_Mutation | rs773872410 | c.938N>A | p.Arg313Gln | p.R313Q | O95236 | protein_coding | tolerated(0.15) | benign(0) | TCGA-AA-3977-01 | Colorectum | colon adenocarcinoma | Male | >=65 | I/II | Unknown | Unknown | SD |
| APOL3 | SNV | Missense_Mutation | novel | c.77N>A | p.Thr26Asn | p.T26N | O95236 | protein_coding | benign(0.035) | TCGA-AA-A02W-01 | Colorectum | colon adenocarcinoma | Female | >=65 | I/II | Unknown | Unknown | PD |
| Page: 1 2 3 4 5 |
Top |
Related drugs of malignant transformation related genes |
| Identification of chemicals and drugs interact with genes involved in malignant transfromation |
| (DGIdb 4.0) |
| Entrez ID | Symbol | Category | Interaction Types | Drug Claim Name | Drug Name | PMIDs |
| Page: 1 |

Copyright 2023-Present -The University of Texas Health Science Center at Houston |