
|
|||||
|
 | |
| |
| |
| |
| |
| |
|
Gene: APOL2 |
Gene summary for APOL2 |
| Gene information | Species | Human | Gene symbol | APOL2 | Gene ID | 23780 |
| Gene name | apolipoprotein L2 | |
| Gene Alias | APOL-II | |
| Cytomap | 22q12.3 | |
| Gene Type | protein-coding | GO ID | GO:0000003 | UniProtAcc | A0A024R1M8 |
Top |
Malignant transformation analysis |
| Identification of the aberrant gene expression in precancerous and cancerous lesions by comparing the gene expression of stem-like cells in diseased tissues with normal stem cells |
| Entrez ID | Symbol | Replicates | Species | Organ | Tissue | Adj P-value | Log2FC | Malignancy |
| 23780 | APOL2 | LZE4T | Human | Esophagus | ESCC | 1.86e-03 | 1.41e-01 | 0.0811 |
| 23780 | APOL2 | LZE20T | Human | Esophagus | ESCC | 6.27e-07 | 2.50e-01 | 0.0662 |
| 23780 | APOL2 | LZE24T | Human | Esophagus | ESCC | 1.87e-08 | 3.52e-01 | 0.0596 |
| 23780 | APOL2 | P2T-E | Human | Esophagus | ESCC | 3.09e-11 | 9.16e-02 | 0.1177 |
| 23780 | APOL2 | P4T-E | Human | Esophagus | ESCC | 1.45e-02 | 1.08e-01 | 0.1323 |
| 23780 | APOL2 | P9T-E | Human | Esophagus | ESCC | 5.06e-09 | 2.69e-01 | 0.1131 |
| 23780 | APOL2 | P11T-E | Human | Esophagus | ESCC | 1.47e-20 | 7.16e-01 | 0.1426 |
| 23780 | APOL2 | P12T-E | Human | Esophagus | ESCC | 1.26e-02 | 5.99e-02 | 0.1122 |
| 23780 | APOL2 | P15T-E | Human | Esophagus | ESCC | 5.44e-04 | 1.48e-01 | 0.1149 |
| 23780 | APOL2 | P17T-E | Human | Esophagus | ESCC | 1.23e-05 | 3.66e-01 | 0.1278 |
| 23780 | APOL2 | P19T-E | Human | Esophagus | ESCC | 1.28e-04 | 3.24e-01 | 0.1662 |
| 23780 | APOL2 | P20T-E | Human | Esophagus | ESCC | 5.70e-03 | 1.38e-01 | 0.1124 |
| 23780 | APOL2 | P21T-E | Human | Esophagus | ESCC | 7.54e-12 | 2.35e-01 | 0.1617 |
| 23780 | APOL2 | P22T-E | Human | Esophagus | ESCC | 9.23e-05 | 1.06e-01 | 0.1236 |
| 23780 | APOL2 | P23T-E | Human | Esophagus | ESCC | 5.28e-06 | 1.64e-01 | 0.108 |
| 23780 | APOL2 | P24T-E | Human | Esophagus | ESCC | 2.55e-06 | 2.05e-01 | 0.1287 |
| 23780 | APOL2 | P26T-E | Human | Esophagus | ESCC | 2.91e-02 | 1.23e-01 | 0.1276 |
| 23780 | APOL2 | P28T-E | Human | Esophagus | ESCC | 5.86e-06 | 2.39e-01 | 0.1149 |
| 23780 | APOL2 | P30T-E | Human | Esophagus | ESCC | 8.14e-05 | 2.72e-01 | 0.137 |
| 23780 | APOL2 | P31T-E | Human | Esophagus | ESCC | 4.47e-03 | 7.06e-02 | 0.1251 |
| Page: 1 2 3 4 5 |
| Tissue | Expression Dynamics | Abbreviation |
| Esophagus | 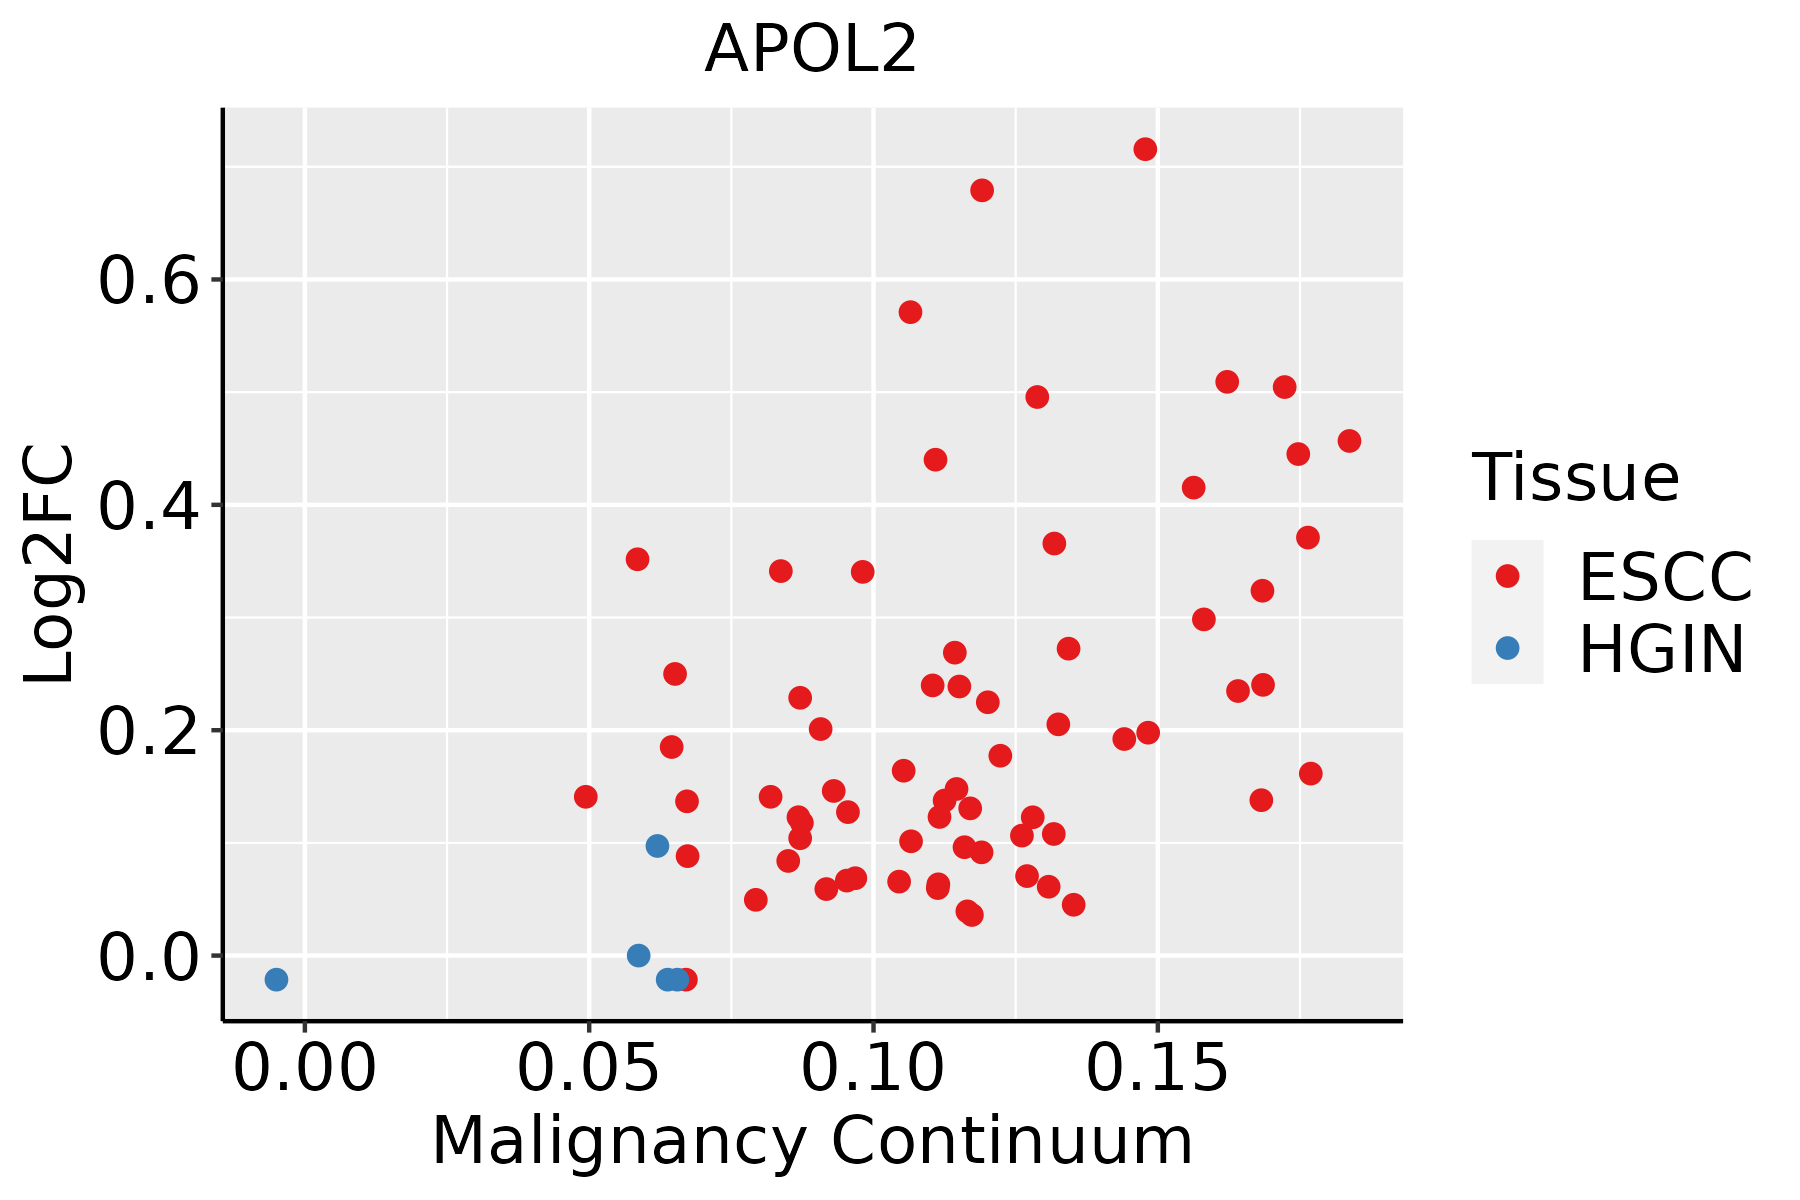 | ESCC: Esophageal squamous cell carcinoma |
| HGIN: High-grade intraepithelial neoplasias | ||
| LGIN: Low-grade intraepithelial neoplasias | ||
| Liver |  | HCC: Hepatocellular carcinoma |
| NAFLD: Non-alcoholic fatty liver disease | ||
| Oral Cavity | 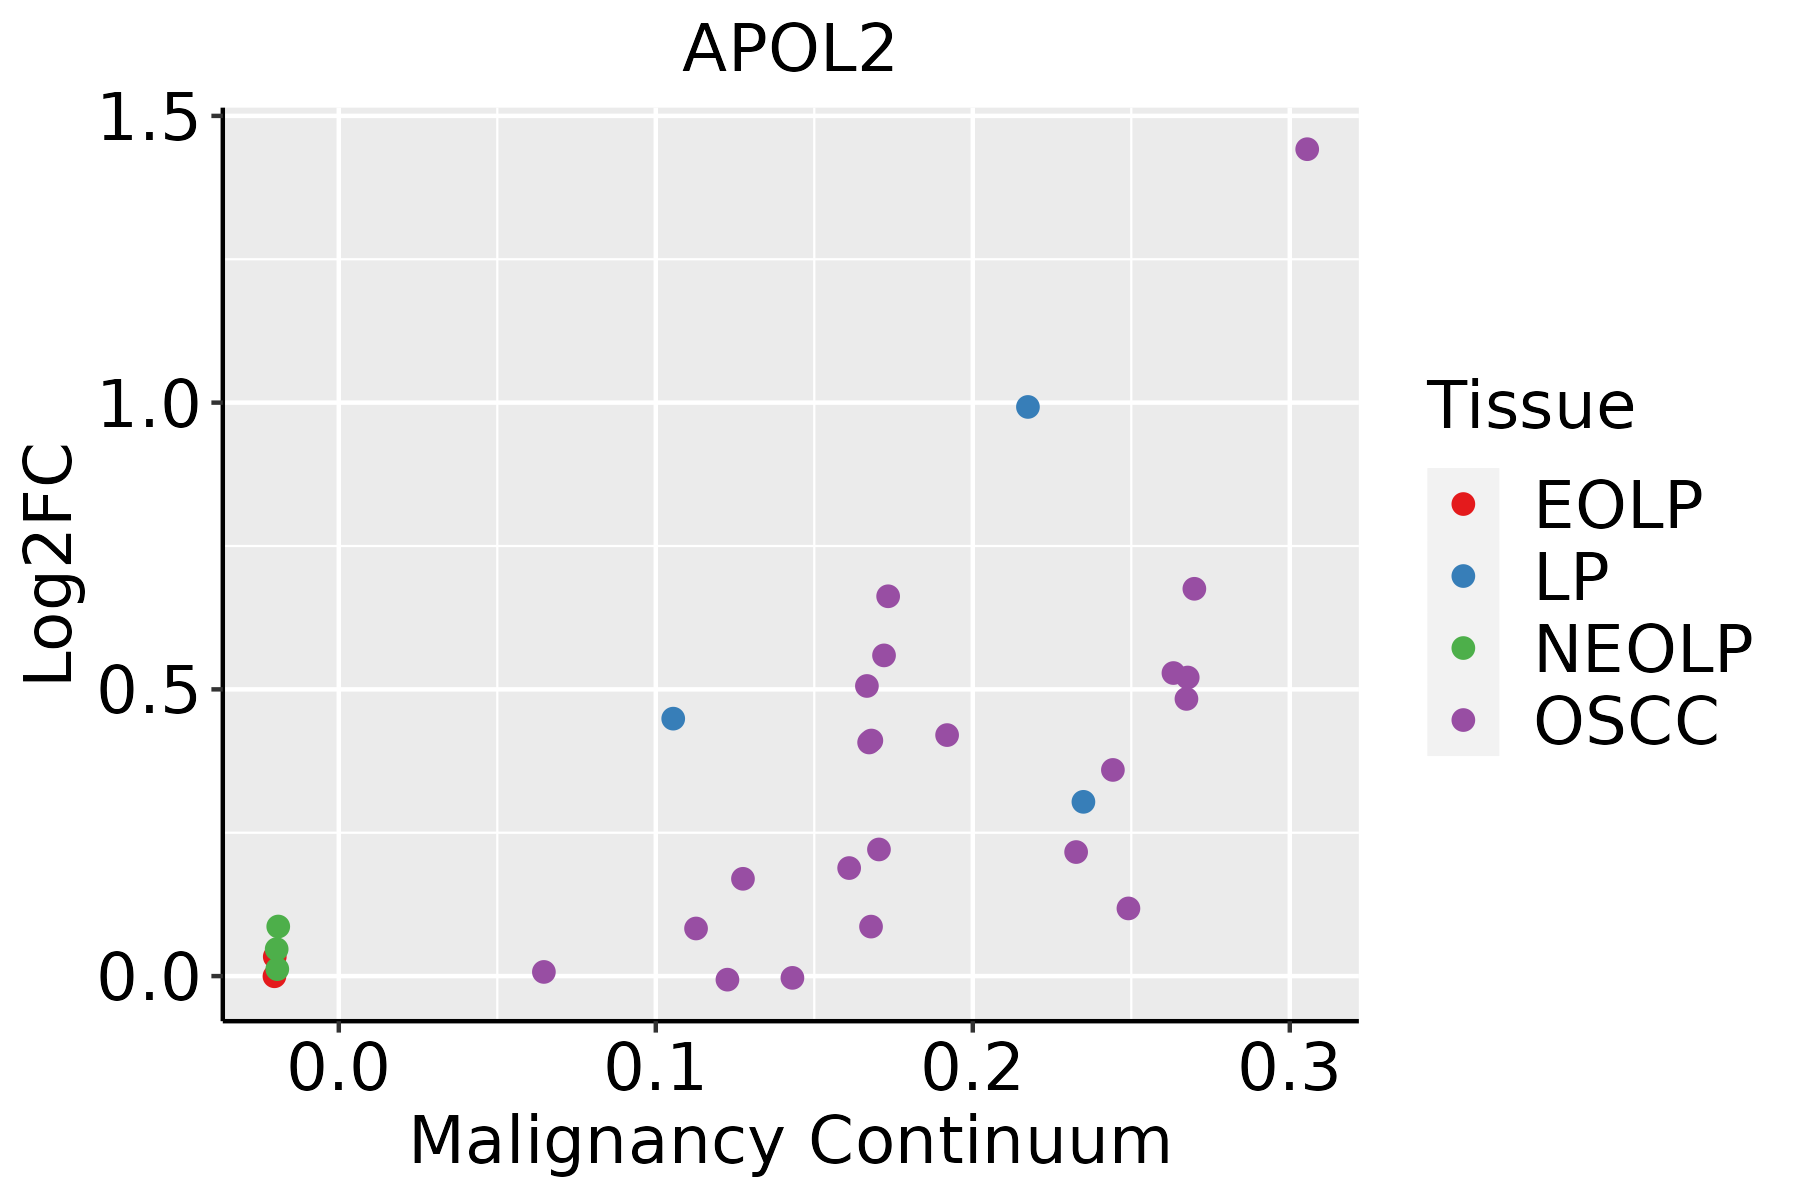 | EOLP: Erosive Oral lichen planus |
| LP: leukoplakia | ||
| NEOLP: Non-erosive oral lichen planus | ||
| OSCC: Oral squamous cell carcinoma | ||
| Skin | 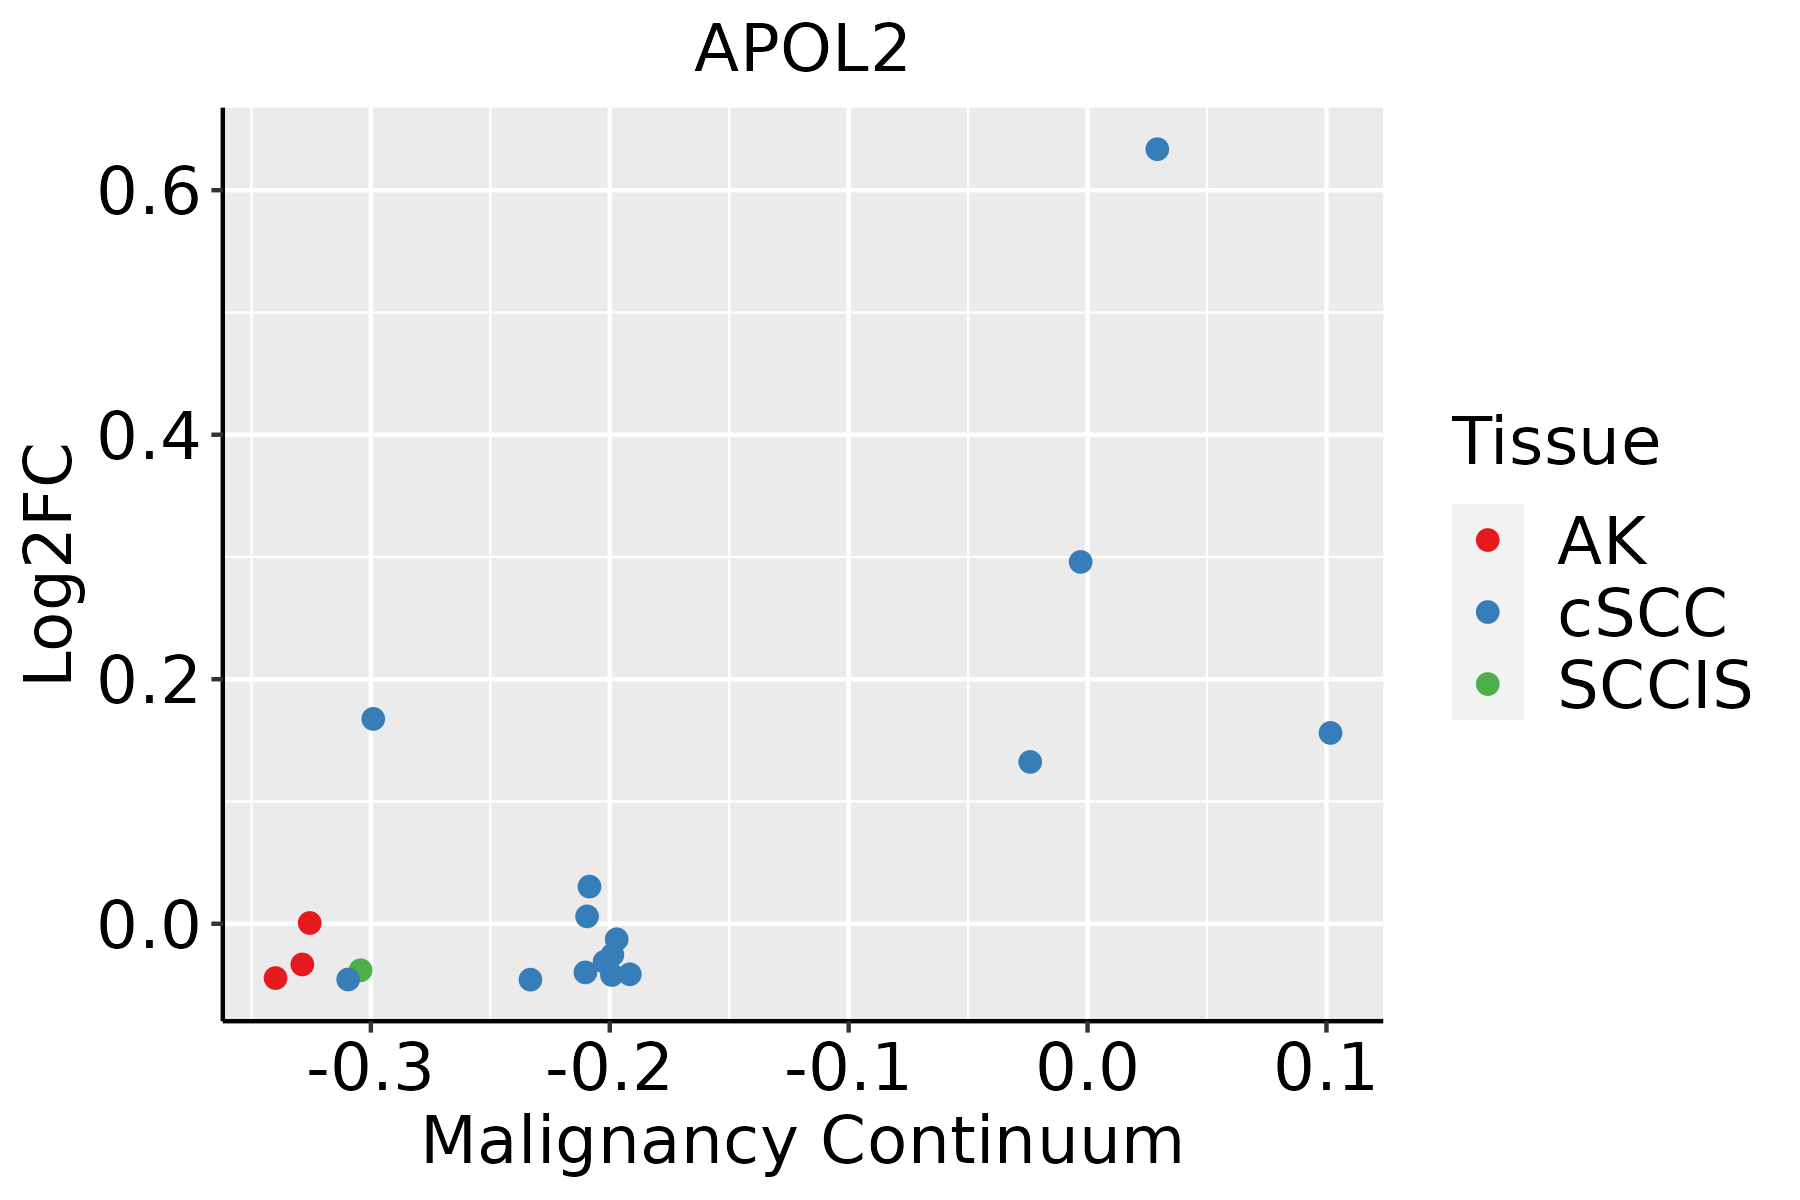 | AK: Actinic keratosis |
| cSCC: Cutaneous squamous cell carcinoma | ||
| SCCIS:squamous cell carcinoma in situ | ||
| Thyroid | 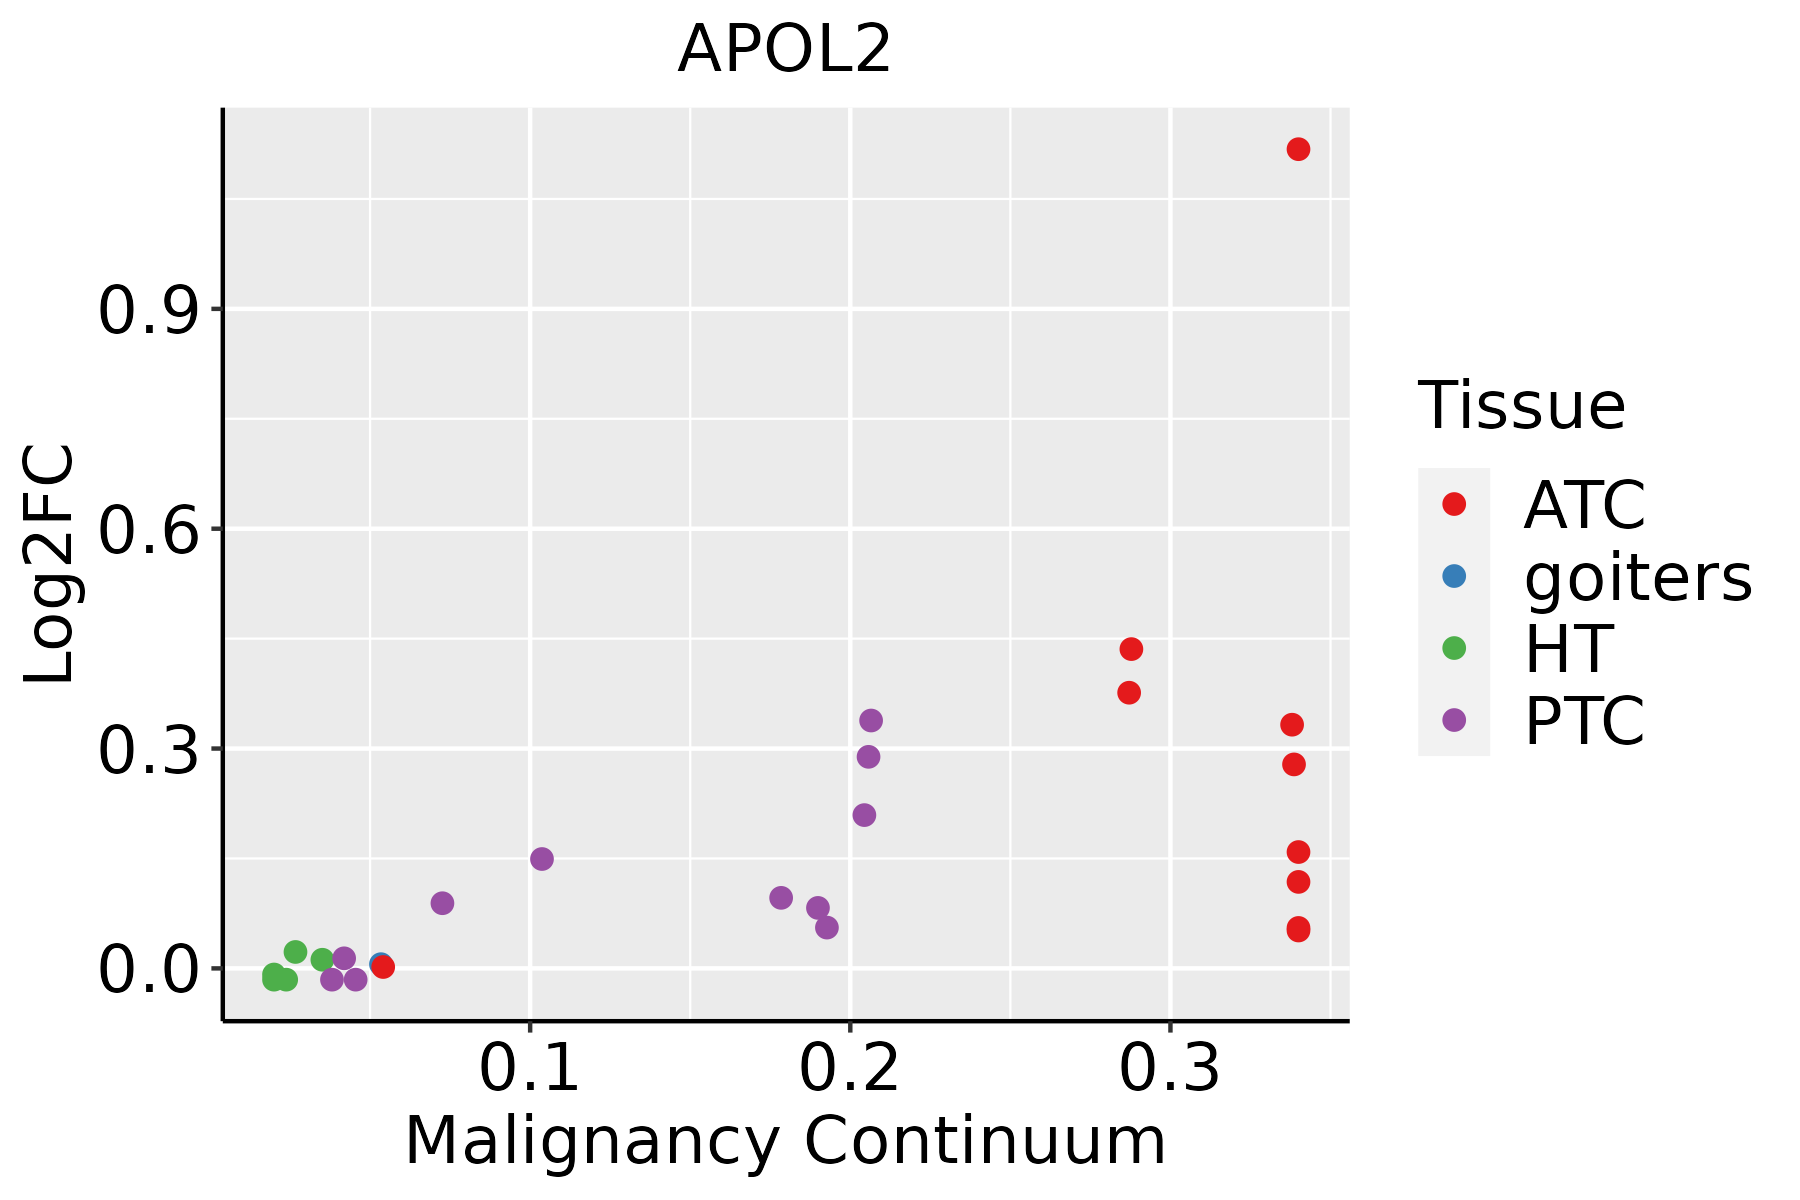 | ATC: Anaplastic thyroid cancer |
| HT: Hashimoto's thyroiditis | ||
| PTC: Papillary thyroid cancer |
| ∗log2FC in expression of this searched gene in stem-like cells from each diseased tissue sample relative to stem-like cells in normal samples in each tissue plotted against the malignancy continuum. Samples are colored based on if they are from different disease stage. |
Top |
Malignant transformation related pathway analysis |
| Find out the enriched GO biological processes and KEGG pathways involved in transition from healthy to precancer to cancer |
| Tissue | Disease Stage | Enriched GO biological Processes |
| Colorectum | AD |  |
| Colorectum | SER |  |
| Colorectum | MSS |  |
| Colorectum | MSI-H |  |
| Colorectum | FAP |  |
| ∗Top 15 enriched GO BP terms are showed in the bar plot of each disease state in each tissue. Each row represents a significant GO biological process which is colored according to the -log10(p.adjust). |
| Page: 1 2 3 4 5 6 7 8 9 |
| GO ID | Tissue | Disease Stage | Description | Gene Ratio | Bg Ratio | pvalue | p.adjust | Count |
| GO:00060668 | Esophagus | ESCC | alcohol metabolic process | 202/8552 | 353/18723 | 7.32e-06 | 7.26e-05 | 202 |
| GO:00421573 | Esophagus | ESCC | lipoprotein metabolic process | 86/8552 | 135/18723 | 1.78e-05 | 1.57e-04 | 86 |
| GO:19026524 | Esophagus | ESCC | secondary alcohol metabolic process | 87/8552 | 147/18723 | 6.58e-04 | 3.50e-03 | 87 |
| GO:00601357 | Esophagus | ESCC | maternal process involved in female pregnancy | 40/8552 | 62/18723 | 2.14e-03 | 9.54e-03 | 40 |
| GO:00082034 | Esophagus | ESCC | cholesterol metabolic process | 79/8552 | 137/18723 | 3.11e-03 | 1.29e-02 | 79 |
| GO:00161254 | Esophagus | ESCC | sterol metabolic process | 86/8552 | 152/18723 | 4.37e-03 | 1.73e-02 | 86 |
| GO:000606621 | Liver | HCC | alcohol metabolic process | 208/7958 | 353/18723 | 2.80e-10 | 9.50e-09 | 208 |
| GO:19026522 | Liver | HCC | secondary alcohol metabolic process | 100/7958 | 147/18723 | 3.26e-10 | 1.09e-08 | 100 |
| GO:00082032 | Liver | HCC | cholesterol metabolic process | 94/7958 | 137/18723 | 5.39e-10 | 1.72e-08 | 94 |
| GO:00082022 | Liver | HCC | steroid metabolic process | 188/7958 | 319/18723 | 1.96e-09 | 5.63e-08 | 188 |
| GO:00161252 | Liver | HCC | sterol metabolic process | 101/7958 | 152/18723 | 1.99e-09 | 5.63e-08 | 101 |
| GO:00421571 | Liver | HCC | lipoprotein metabolic process | 86/7958 | 135/18723 | 5.21e-07 | 8.38e-06 | 86 |
| GO:001087621 | Liver | HCC | lipid localization | 228/7958 | 448/18723 | 1.80e-04 | 1.41e-03 | 228 |
| GO:000686921 | Liver | HCC | lipid transport | 198/7958 | 398/18723 | 1.92e-03 | 9.78e-03 | 198 |
| GO:00025262 | Liver | HCC | acute inflammatory response | 62/7958 | 112/18723 | 4.06e-03 | 1.77e-02 | 62 |
| GO:00601351 | Liver | HCC | maternal process involved in female pregnancy | 37/7958 | 62/18723 | 4.73e-03 | 2.02e-02 | 37 |
| GO:00069532 | Liver | HCC | acute-phase response | 30/7958 | 49/18723 | 6.31e-03 | 2.57e-02 | 30 |
| GO:00075651 | Liver | HCC | female pregnancy | 99/7958 | 193/18723 | 8.24e-03 | 3.23e-02 | 99 |
| GO:00060667 | Oral cavity | OSCC | alcohol metabolic process | 179/7305 | 353/18723 | 4.54e-06 | 5.21e-05 | 179 |
| GO:00421572 | Oral cavity | OSCC | lipoprotein metabolic process | 77/7305 | 135/18723 | 1.61e-05 | 1.60e-04 | 77 |
| Page: 1 2 |
| Pathway ID | Tissue | Disease Stage | Description | Gene Ratio | Bg Ratio | pvalue | p.adjust | qvalue | Count |
| Page: 1 |
Top |
Cell-cell communication analysis |
| Identification of potential cell-cell interactions between two cell types and their ligand-receptor pairs for different disease states |
| Ligand | Receptor | LRpair | Pathway | Tissue | Disease Stage |
| Page: 1 |
Top |
Single-cell gene regulatory network inference analysis |
| Find out the significant the regulons (TFs) and the target genes of each regulon across cell types for different disease states |
| TF | Cell Type | Tissue | Disease Stage | Target Gene | RSS | Regulon Activity |
| ∗The dot plots of a searched regulon are shown for all cell subpopulations in each disease state of each tissue based on the regulon specific score inferred using pySCENIC and by calculating the average expression. |
| Page: 1 |
Top |
Somatic mutation of malignant transformation related genes |
| Annotation of somatic variants for genes involved in malignant transformation |
| Hugo Symbol | Variant Class | Variant Classification | dbSNP RS | HGVSc | HGVSp | HGVSp Short | SWISSPROT | BIOTYPE | SIFT | PolyPhen | Tumor Sample Barcode | Tissue | Histology | Sex | Age | Stage | Therapy Types | Drugs | Outcome |
| APOL2 | SNV | Missense_Mutation | c.380C>G | p.Ser127Cys | p.S127C | Q9BQE5 | protein_coding | deleterious(0) | probably_damaging(0.967) | TCGA-AN-A0XW-01 | Breast | breast invasive carcinoma | Female | <65 | III/IV | Unknown | Unknown | SD | |
| APOL2 | SNV | Missense_Mutation | c.527N>T | p.Arg176Leu | p.R176L | Q9BQE5 | protein_coding | tolerated(0.23) | benign(0.325) | TCGA-B6-A0I6-01 | Breast | breast invasive carcinoma | Female | <65 | I/II | Unknown | Unknown | PD | |
| APOL2 | SNV | Missense_Mutation | rs377641018 | c.526C>T | p.Arg176Trp | p.R176W | Q9BQE5 | protein_coding | tolerated(0.1) | benign(0.005) | TCGA-A6-6653-01 | Colorectum | colon adenocarcinoma | Male | >=65 | I/II | Unknown | Unknown | SD |
| APOL2 | SNV | Missense_Mutation | novel | c.585N>T | p.Met195Ile | p.M195I | Q9BQE5 | protein_coding | tolerated(0.58) | benign(0.009) | TCGA-AA-A00N-01 | Colorectum | colon adenocarcinoma | Male | >=65 | I/II | Unknown | Unknown | PD |
| APOL2 | SNV | Missense_Mutation | c.458N>C | p.Met153Thr | p.M153T | Q9BQE5 | protein_coding | tolerated(0.11) | benign(0.022) | TCGA-CM-6674-01 | Colorectum | colon adenocarcinoma | Male | <65 | I/II | Unknown | Unknown | SD | |
| APOL2 | SNV | Missense_Mutation | c.469N>T | p.Ala157Ser | p.A157S | Q9BQE5 | protein_coding | tolerated(0.07) | benign(0.205) | TCGA-D5-6535-01 | Colorectum | colon adenocarcinoma | Female | >=65 | III/IV | Unknown | Unknown | SD | |
| APOL2 | SNV | Missense_Mutation | novel | c.182G>A | p.Ser61Asn | p.S61N | Q9BQE5 | protein_coding | tolerated(0.46) | benign(0.19) | TCGA-A5-A0G2-01 | Endometrium | uterine corpus endometrioid carcinoma | Female | <65 | III/IV | Unknown | Unknown | SD |
| APOL2 | SNV | Missense_Mutation | rs760928601 | c.260N>A | p.Arg87Gln | p.R87Q | Q9BQE5 | protein_coding | tolerated(0.81) | benign(0.133) | TCGA-A5-A1OF-01 | Endometrium | uterine corpus endometrioid carcinoma | Female | <65 | I/II | Unknown | Unknown | SD |
| APOL2 | SNV | Missense_Mutation | c.383N>A | p.Gly128Asp | p.G128D | Q9BQE5 | protein_coding | tolerated(0.17) | benign(0.065) | TCGA-AP-A051-01 | Endometrium | uterine corpus endometrioid carcinoma | Female | >=65 | I/II | Unknown | Unknown | SD | |
| APOL2 | SNV | Missense_Mutation | rs757083546 | c.214G>A | p.Asp72Asn | p.D72N | Q9BQE5 | protein_coding | tolerated(0.06) | possibly_damaging(0.897) | TCGA-AP-A056-01 | Endometrium | uterine corpus endometrioid carcinoma | Female | <65 | I/II | Unknown | Unknown | SD |
| Page: 1 2 3 |
Top |
Related drugs of malignant transformation related genes |
| Identification of chemicals and drugs interact with genes involved in malignant transfromation |
| (DGIdb 4.0) |
| Entrez ID | Symbol | Category | Interaction Types | Drug Claim Name | Drug Name | PMIDs |
| Page: 1 |

Copyright 2023-Present -The University of Texas Health Science Center at Houston |