
|
|||||
|
 | |
| |
| |
| |
| |
| |
|
Gene: APOL1 |
Gene summary for APOL1 |
| Gene information | Species | Human | Gene symbol | APOL1 | Gene ID | 8542 |
| Gene name | apolipoprotein L1 | |
| Gene Alias | APO-L | |
| Cytomap | 22q12.3 | |
| Gene Type | protein-coding | GO ID | GO:0001906 | UniProtAcc | O14791 |
Top |
Malignant transformation analysis |
| Identification of the aberrant gene expression in precancerous and cancerous lesions by comparing the gene expression of stem-like cells in diseased tissues with normal stem cells |
| Entrez ID | Symbol | Replicates | Species | Organ | Tissue | Adj P-value | Log2FC | Malignancy |
| 8542 | APOL1 | CA_HPV_2 | Human | Cervix | CC | 2.35e-02 | 4.07e-01 | 0.0391 |
| 8542 | APOL1 | N_HPV_1 | Human | Cervix | N_HPV | 1.73e-03 | -1.34e-01 | 0.0079 |
| 8542 | APOL1 | Tumor | Human | Cervix | CC | 8.61e-56 | 1.06e+00 | 0.1241 |
| 8542 | APOL1 | sample3 | Human | Cervix | CC | 2.47e-81 | 1.18e+00 | 0.1387 |
| 8542 | APOL1 | H2 | Human | Cervix | HSIL_HPV | 1.47e-20 | 7.19e-01 | 0.0632 |
| 8542 | APOL1 | T3 | Human | Cervix | CC | 4.26e-86 | 1.19e+00 | 0.1389 |
| 8542 | APOL1 | AEH-subject2 | Human | Endometrium | AEH | 1.93e-20 | 7.29e-01 | -0.2525 |
| 8542 | APOL1 | EEC-subject2 | Human | Endometrium | EEC | 2.38e-06 | 4.16e-01 | -0.2607 |
| 8542 | APOL1 | EEC-subject3 | Human | Endometrium | EEC | 5.84e-05 | -8.03e-02 | -0.2525 |
| 8542 | APOL1 | GSM5276935 | Human | Endometrium | EEC | 7.68e-03 | -1.68e-01 | -0.123 |
| 8542 | APOL1 | GSM5276937 | Human | Endometrium | EEC | 1.28e-03 | -1.79e-01 | -0.0897 |
| 8542 | APOL1 | GSM6177620_NYU_UCEC1_lib1_lib1 | Human | Endometrium | EEC | 8.75e-10 | 1.57e-01 | -0.1869 |
| 8542 | APOL1 | GSM6177620_NYU_UCEC1_lib2_lib2 | Human | Endometrium | EEC | 3.32e-03 | 2.39e-03 | -0.1875 |
| 8542 | APOL1 | GSM6177620_NYU_UCEC1_lib3_lib3 | Human | Endometrium | EEC | 1.92e-06 | 4.01e-02 | -0.1883 |
| 8542 | APOL1 | GSM6177621_NYU_UCEC2_lib1_lib1 | Human | Endometrium | EEC | 3.31e-02 | -7.62e-02 | -0.1934 |
| 8542 | APOL1 | GSM6177622_NYU_UCEC3_lib1_lib1 | Human | Endometrium | EEC | 7.40e-20 | 4.04e-01 | -0.1917 |
| 8542 | APOL1 | GSM6177622_NYU_UCEC3_lib2_lib2 | Human | Endometrium | EEC | 3.61e-17 | 4.20e-01 | -0.1916 |
| 8542 | APOL1 | GSM6177623_NYU_UCEC3_Vis | Human | Endometrium | EEC | 6.12e-12 | 5.49e-01 | -0.1269 |
| 8542 | APOL1 | LZE4T | Human | Esophagus | ESCC | 1.58e-03 | 5.77e-02 | 0.0811 |
| 8542 | APOL1 | LZE8T | Human | Esophagus | ESCC | 9.79e-12 | 3.80e-01 | 0.067 |
| Page: 1 2 3 4 5 6 |
| Tissue | Expression Dynamics | Abbreviation |
| Cervix | 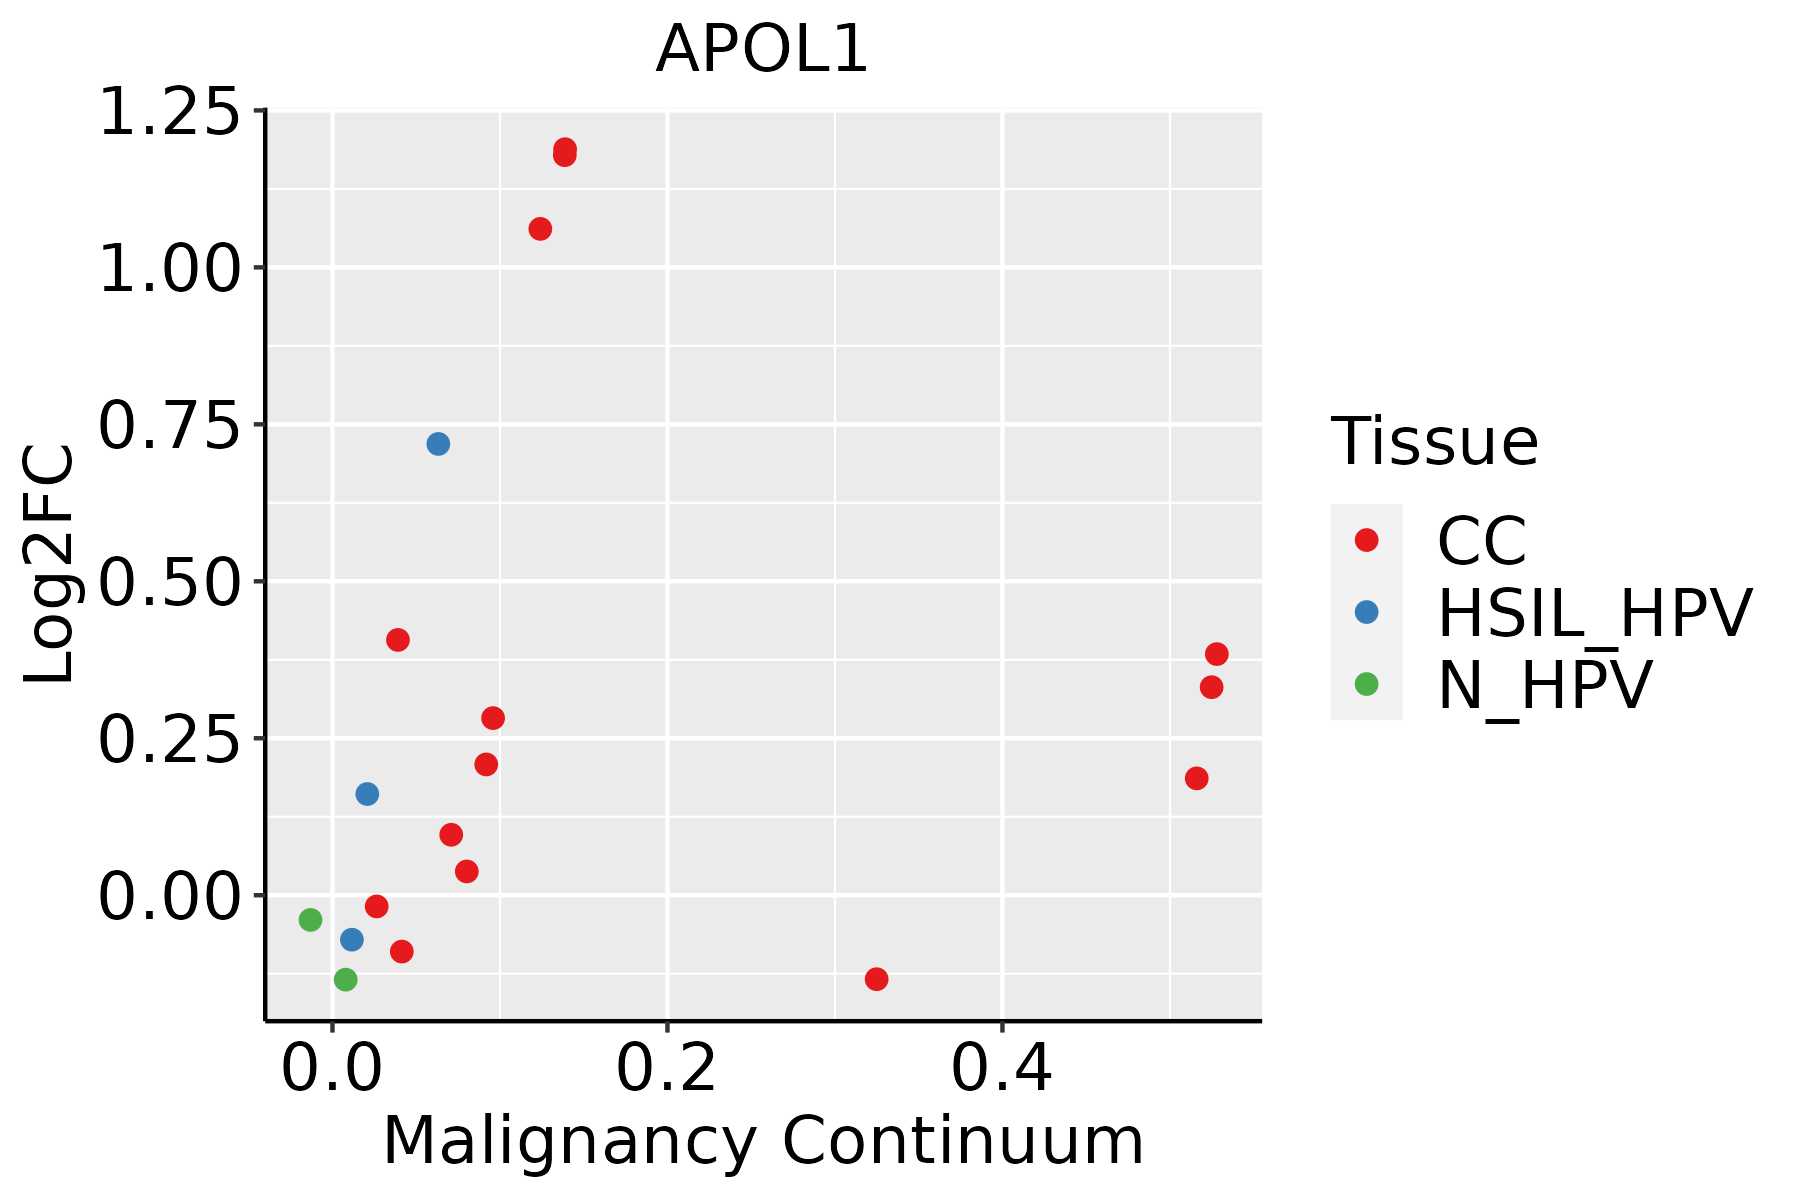 | CC: Cervix cancer |
| HSIL_HPV: HPV-infected high-grade squamous intraepithelial lesions | ||
| N_HPV: HPV-infected normal cervix | ||
| Endometrium | 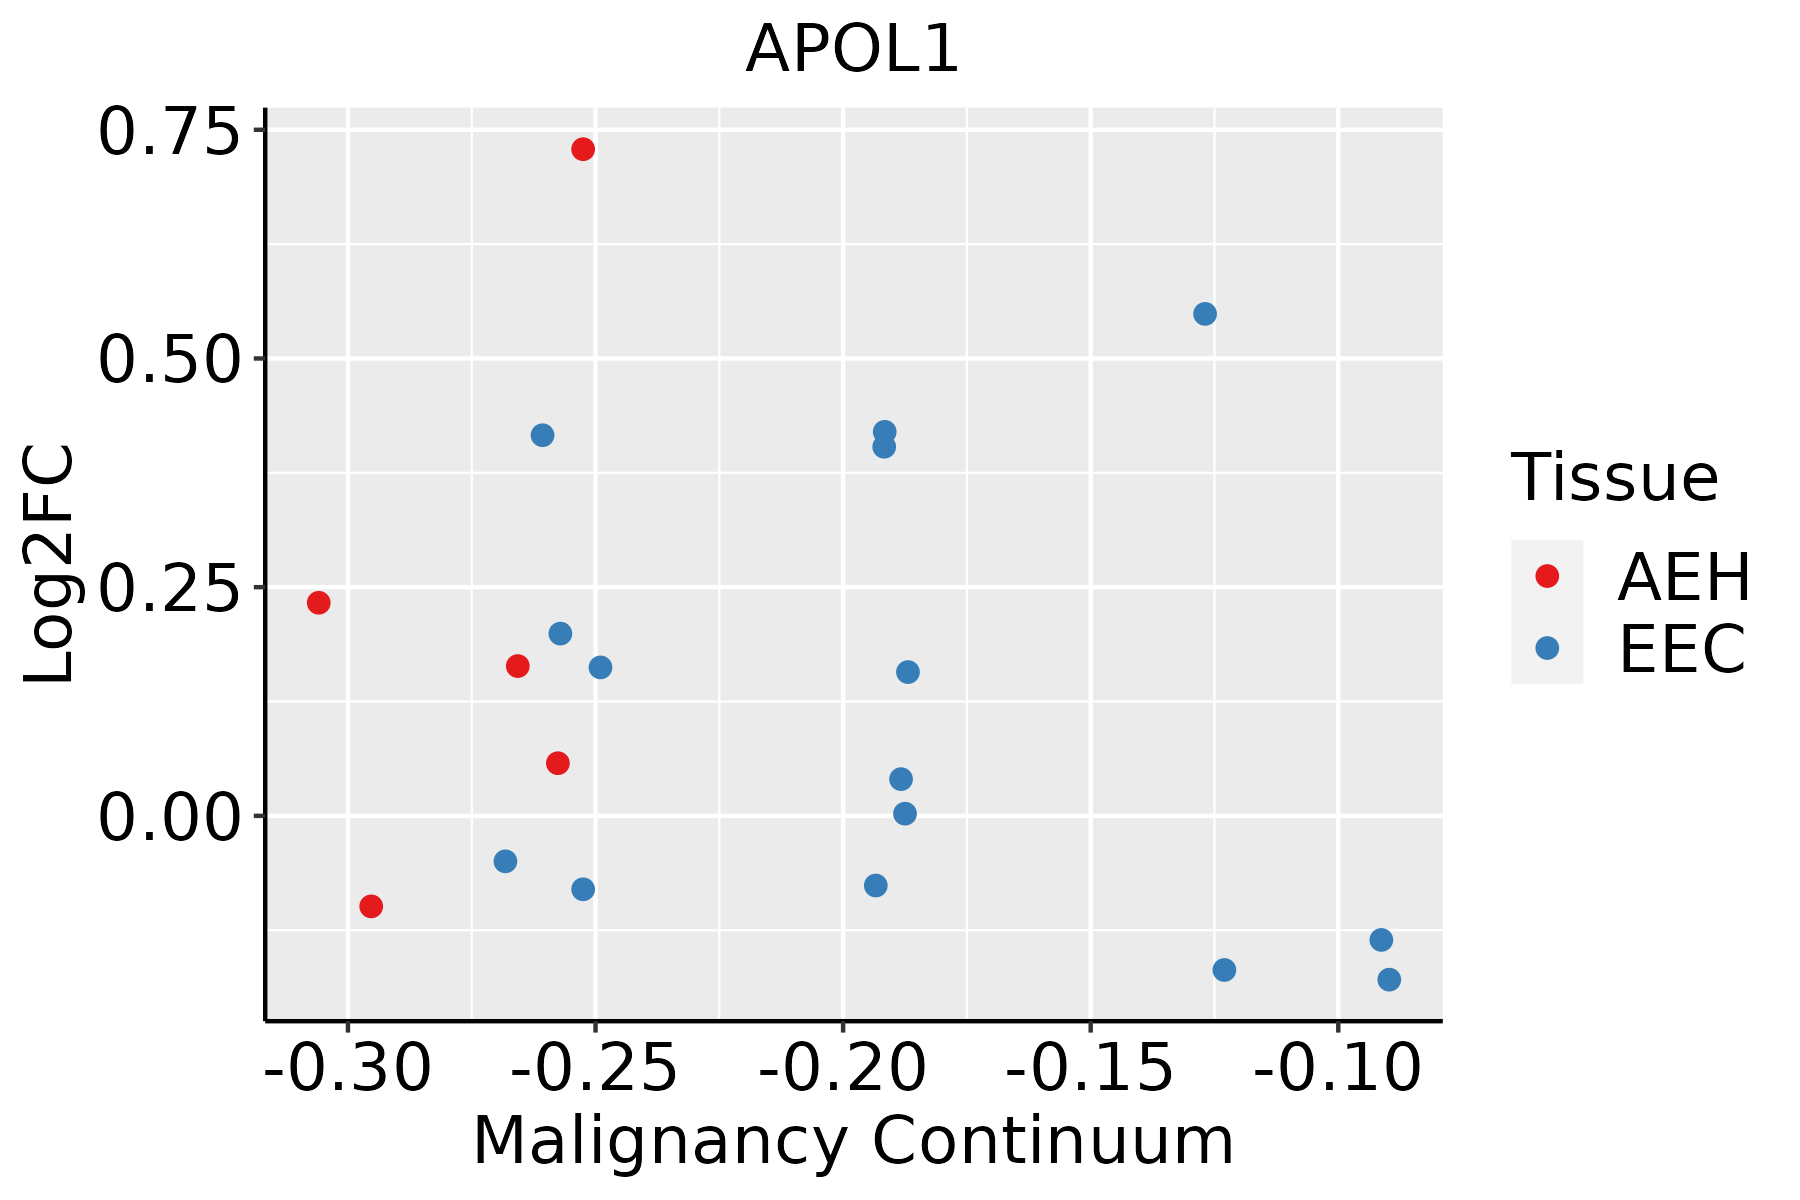 | AEH: Atypical endometrial hyperplasia |
| EEC: Endometrioid Cancer | ||
| Esophagus |  | ESCC: Esophageal squamous cell carcinoma |
| HGIN: High-grade intraepithelial neoplasias | ||
| LGIN: Low-grade intraepithelial neoplasias | ||
| Liver | 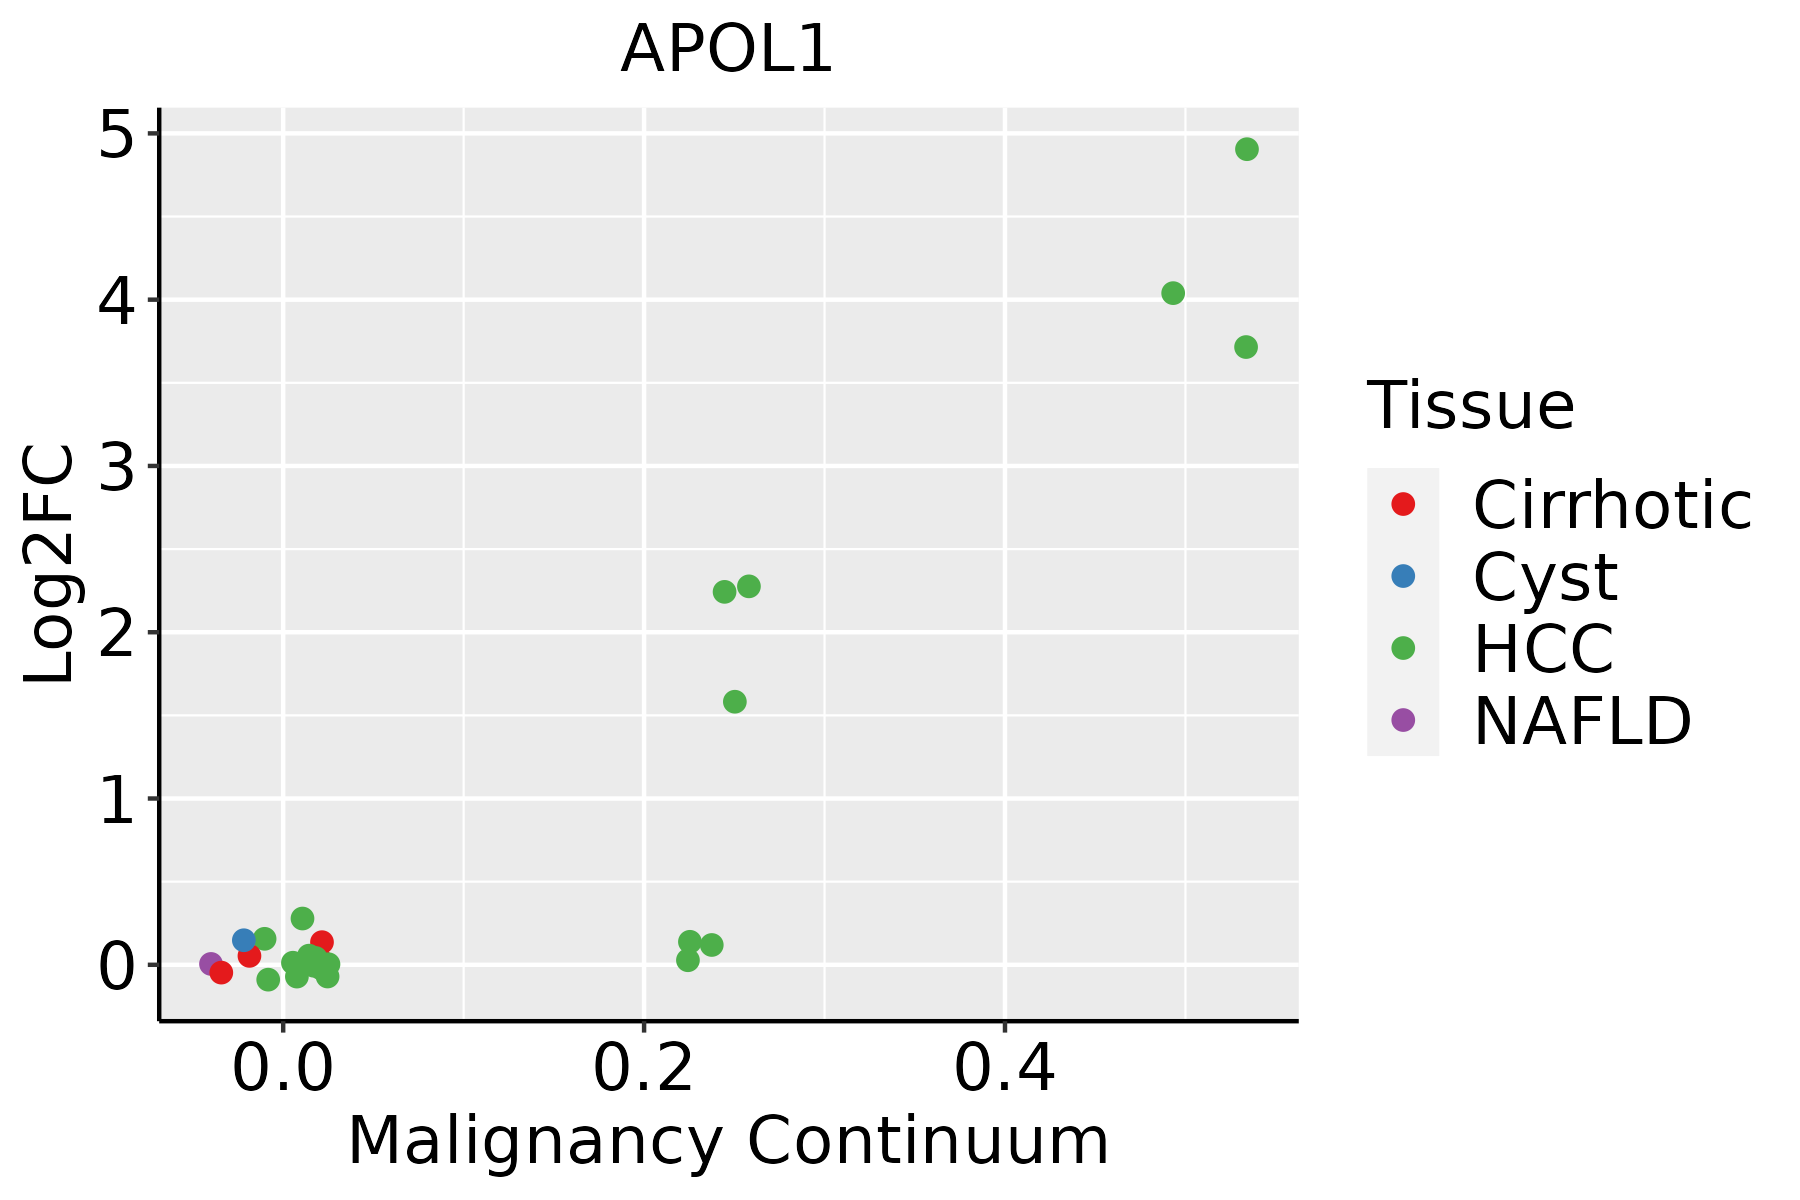 | HCC: Hepatocellular carcinoma |
| NAFLD: Non-alcoholic fatty liver disease | ||
| Oral Cavity | 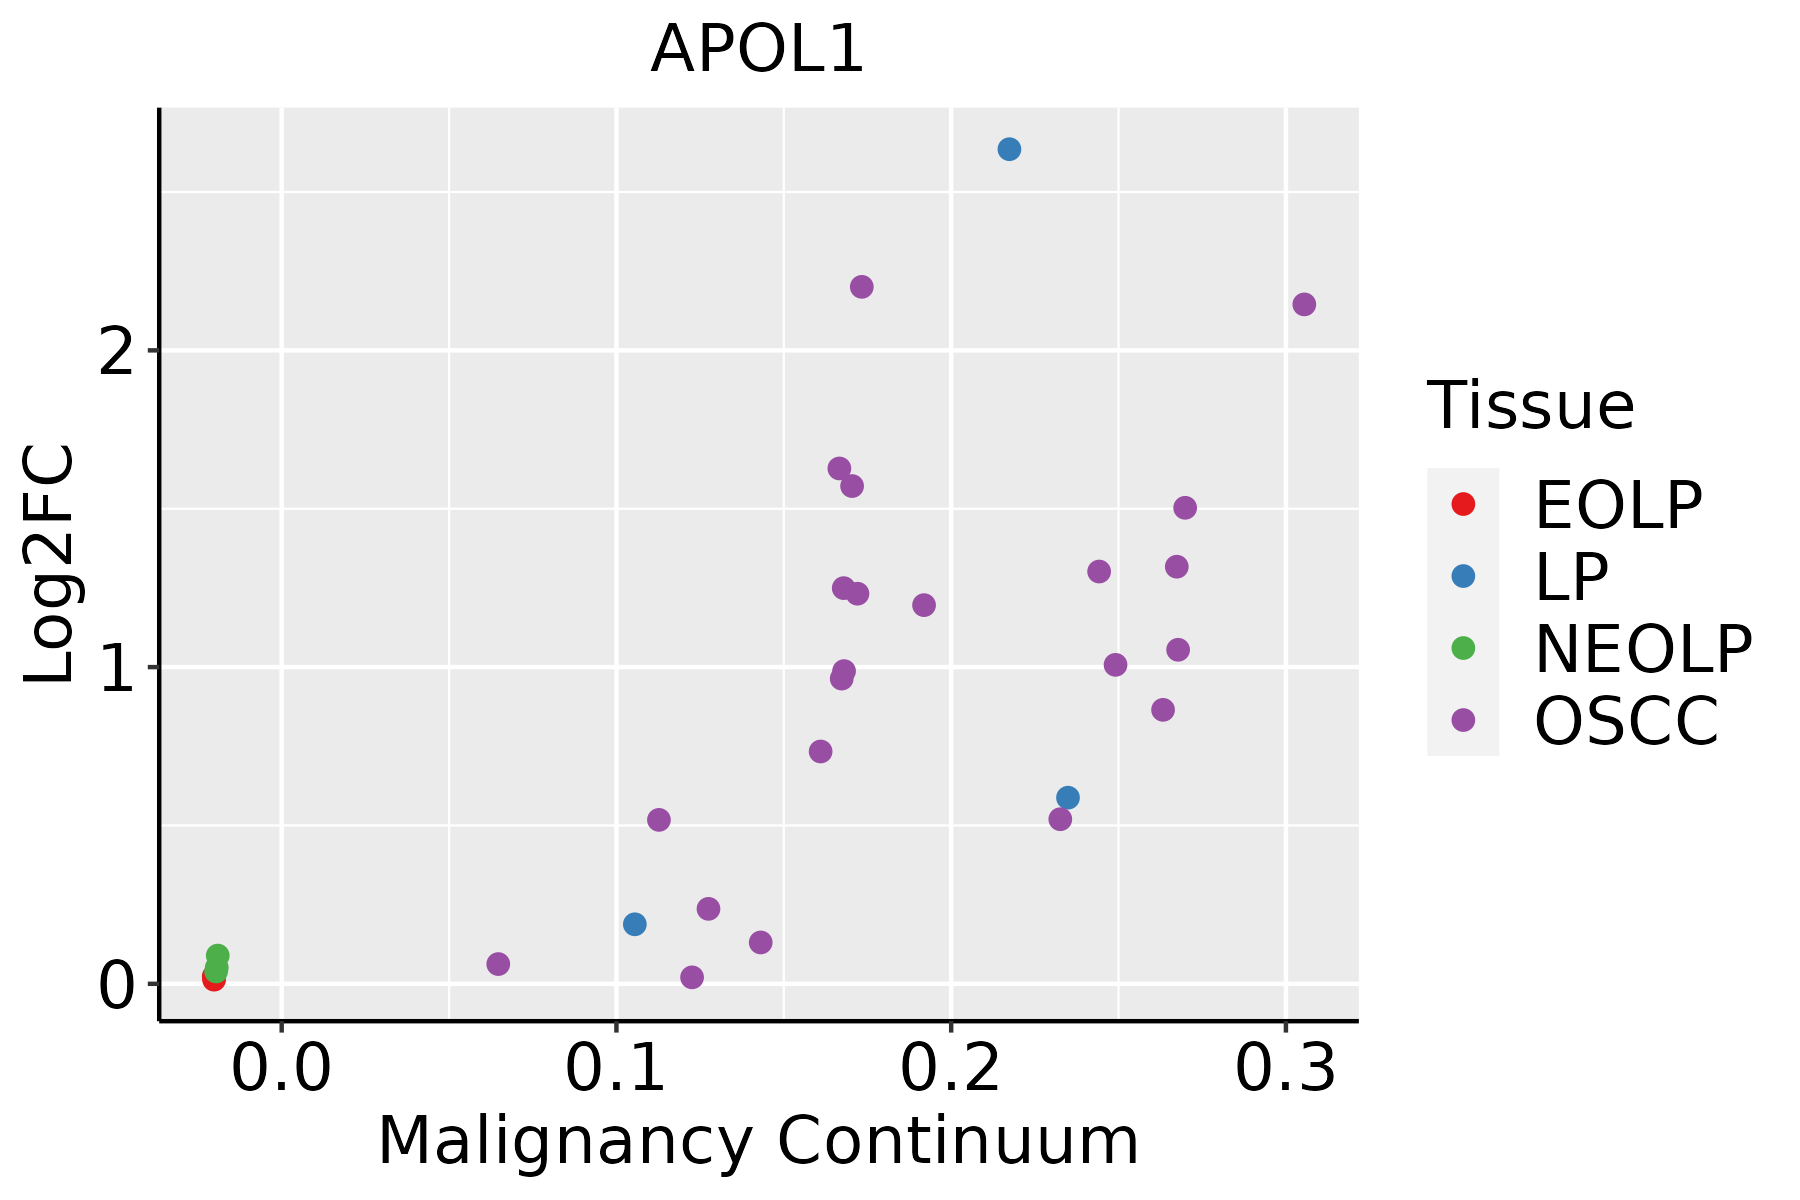 | EOLP: Erosive Oral lichen planus |
| LP: leukoplakia | ||
| NEOLP: Non-erosive oral lichen planus | ||
| OSCC: Oral squamous cell carcinoma | ||
| Skin | 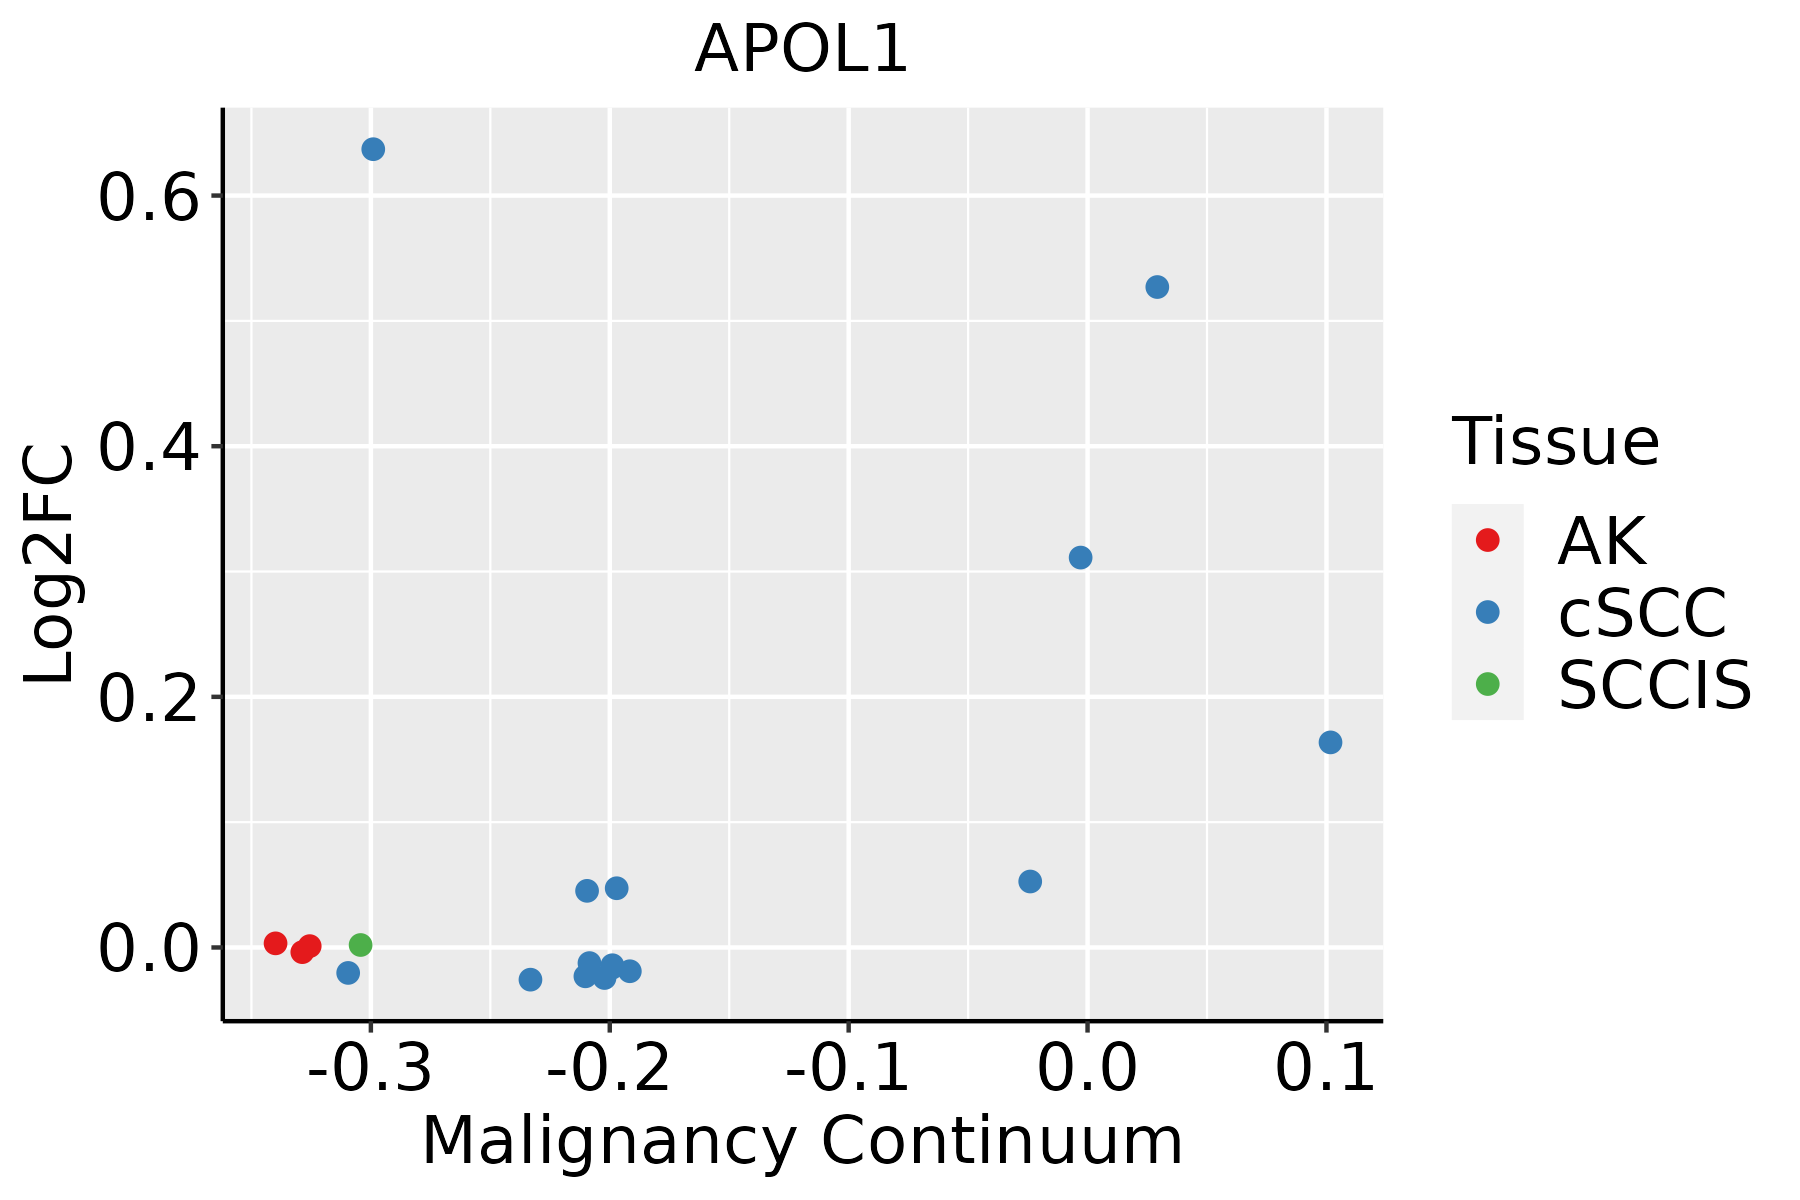 | AK: Actinic keratosis |
| cSCC: Cutaneous squamous cell carcinoma | ||
| SCCIS:squamous cell carcinoma in situ | ||
| Thyroid | 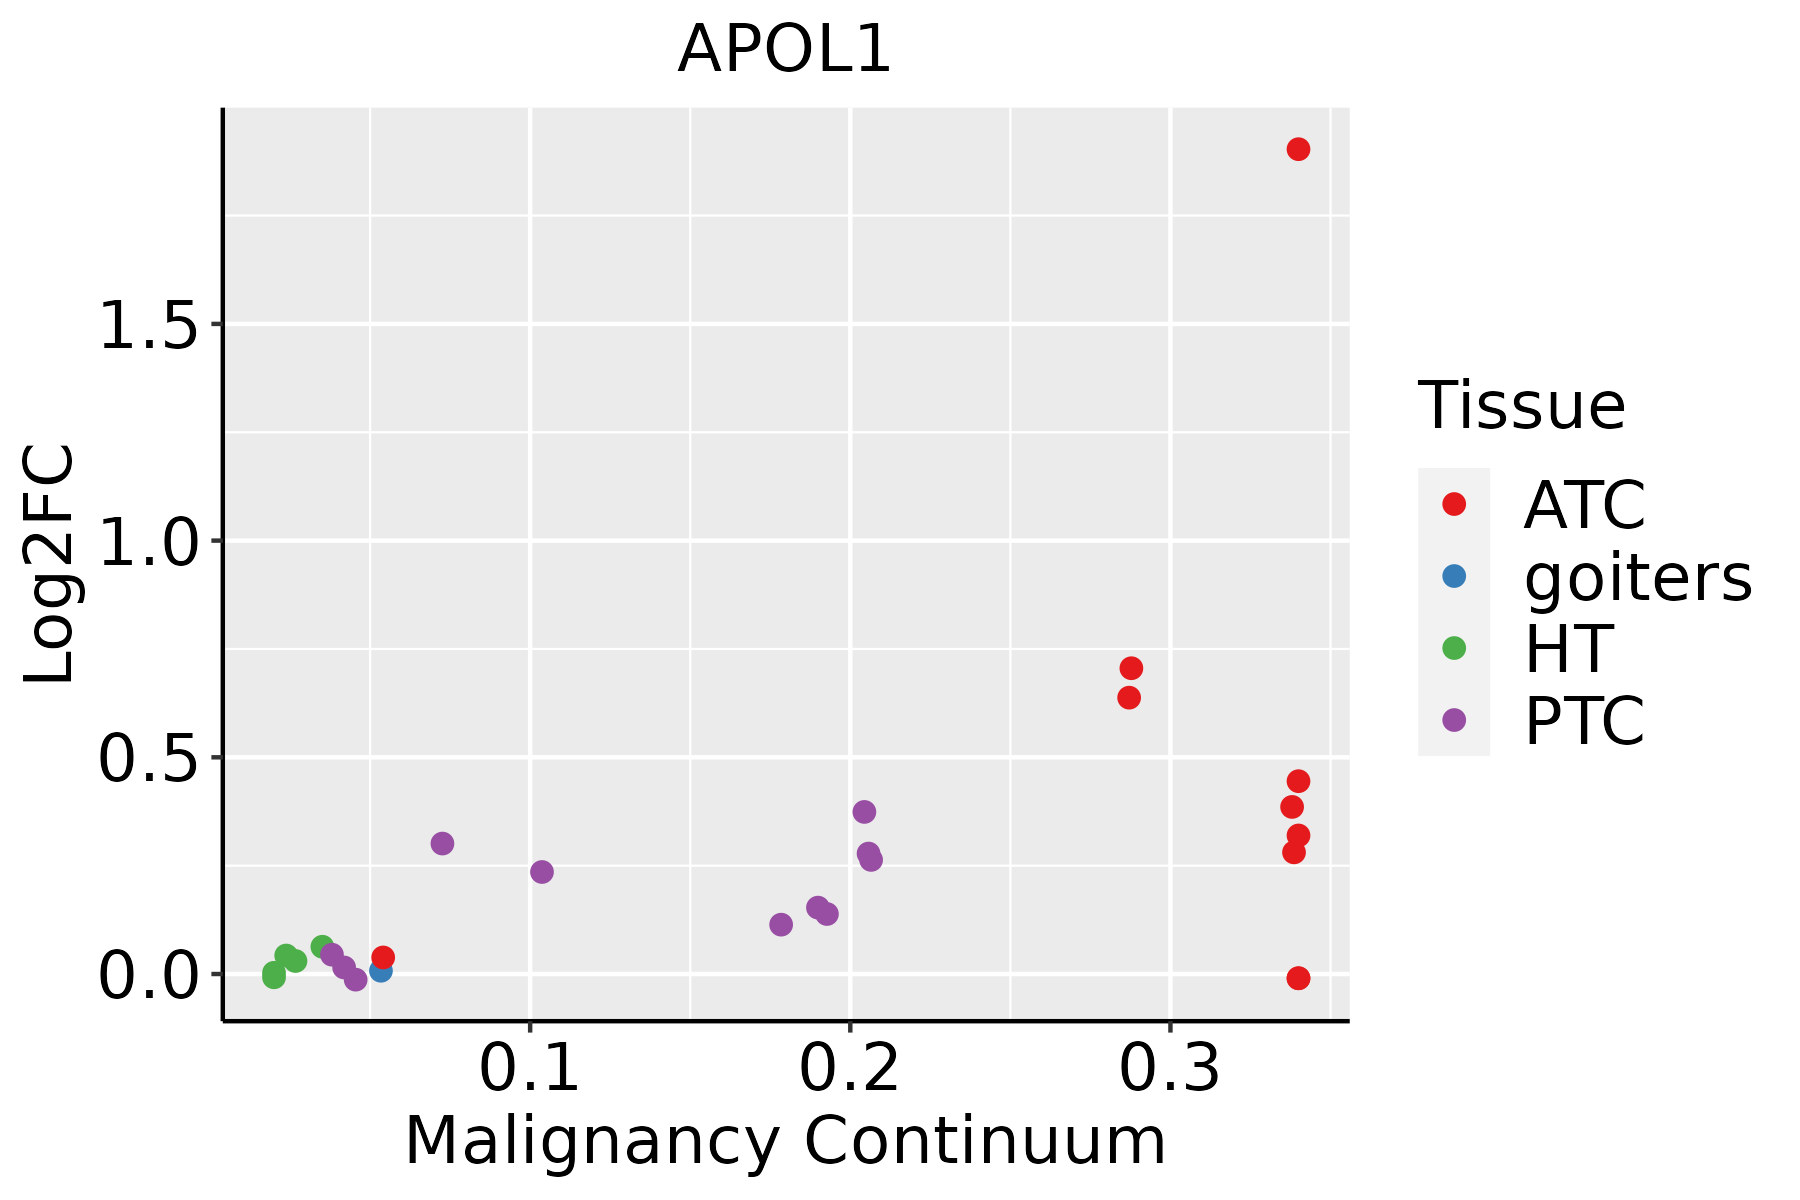 | ATC: Anaplastic thyroid cancer |
| HT: Hashimoto's thyroiditis | ||
| PTC: Papillary thyroid cancer |
| ∗log2FC in expression of this searched gene in stem-like cells from each diseased tissue sample relative to stem-like cells in normal samples in each tissue plotted against the malignancy continuum. Samples are colored based on if they are from different disease stage. |
Top |
Malignant transformation related pathway analysis |
| Find out the enriched GO biological processes and KEGG pathways involved in transition from healthy to precancer to cancer |
| Tissue | Disease Stage | Enriched GO biological Processes |
| Colorectum | AD |  |
| Colorectum | SER |  |
| Colorectum | MSS |  |
| Colorectum | MSI-H |  |
| Colorectum | FAP |  |
| ∗Top 15 enriched GO BP terms are showed in the bar plot of each disease state in each tissue. Each row represents a significant GO biological process which is colored according to the -log10(p.adjust). |
| Page: 1 2 3 4 5 6 7 8 9 |
| GO ID | Tissue | Disease Stage | Description | Gene Ratio | Bg Ratio | pvalue | p.adjust | Count |
| GO:004440310 | Cervix | CC | biological process involved in symbiotic interaction | 71/2311 | 290/18723 | 7.94e-09 | 6.98e-07 | 71 |
| GO:00019067 | Cervix | CC | cell killing | 37/2311 | 188/18723 | 2.61e-03 | 1.80e-02 | 37 |
| GO:004440315 | Cervix | HSIL_HPV | biological process involved in symbiotic interaction | 33/737 | 290/18723 | 4.67e-08 | 3.59e-06 | 33 |
| GO:000190611 | Cervix | HSIL_HPV | cell killing | 23/737 | 188/18723 | 1.45e-06 | 6.47e-05 | 23 |
| GO:000190621 | Cervix | N_HPV | cell killing | 22/534 | 188/18723 | 2.20e-08 | 3.03e-06 | 22 |
| GO:004440324 | Cervix | N_HPV | biological process involved in symbiotic interaction | 26/534 | 290/18723 | 2.79e-07 | 2.12e-05 | 26 |
| GO:00517026 | Cervix | N_HPV | biological process involved in interaction with symbiont | 12/534 | 94/18723 | 1.46e-05 | 4.55e-04 | 12 |
| GO:004440316 | Endometrium | AEH | biological process involved in symbiotic interaction | 70/2100 | 290/18723 | 3.26e-10 | 3.55e-08 | 70 |
| GO:004440317 | Endometrium | EEC | biological process involved in symbiotic interaction | 73/2168 | 290/18723 | 7.47e-11 | 9.95e-09 | 73 |
| GO:00517027 | Endometrium | EEC | biological process involved in interaction with symbiont | 20/2168 | 94/18723 | 4.94e-03 | 3.11e-02 | 20 |
| GO:0044403111 | Esophagus | ESCC | biological process involved in symbiotic interaction | 186/8552 | 290/18723 | 1.43e-10 | 4.16e-09 | 186 |
| GO:00060668 | Esophagus | ESCC | alcohol metabolic process | 202/8552 | 353/18723 | 7.32e-06 | 7.26e-05 | 202 |
| GO:00421573 | Esophagus | ESCC | lipoprotein metabolic process | 86/8552 | 135/18723 | 1.78e-05 | 1.57e-04 | 86 |
| GO:19026524 | Esophagus | ESCC | secondary alcohol metabolic process | 87/8552 | 147/18723 | 6.58e-04 | 3.50e-03 | 87 |
| GO:005170214 | Esophagus | ESCC | biological process involved in interaction with symbiont | 57/8552 | 94/18723 | 2.46e-03 | 1.07e-02 | 57 |
| GO:00082034 | Esophagus | ESCC | cholesterol metabolic process | 79/8552 | 137/18723 | 3.11e-03 | 1.29e-02 | 79 |
| GO:00161254 | Esophagus | ESCC | sterol metabolic process | 86/8552 | 152/18723 | 4.37e-03 | 1.73e-02 | 86 |
| GO:000820211 | Liver | Cirrhotic | steroid metabolic process | 143/4634 | 319/18723 | 2.79e-15 | 3.18e-13 | 143 |
| GO:004440312 | Liver | Cirrhotic | biological process involved in symbiotic interaction | 131/4634 | 290/18723 | 2.00e-14 | 1.84e-12 | 131 |
| GO:19026521 | Liver | Cirrhotic | secondary alcohol metabolic process | 75/4634 | 147/18723 | 5.62e-12 | 3.91e-10 | 75 |
| Page: 1 2 3 |
| Pathway ID | Tissue | Disease Stage | Description | Gene Ratio | Bg Ratio | pvalue | p.adjust | qvalue | Count |
| Page: 1 |
Top |
Cell-cell communication analysis |
| Identification of potential cell-cell interactions between two cell types and their ligand-receptor pairs for different disease states |
| Ligand | Receptor | LRpair | Pathway | Tissue | Disease Stage |
| Page: 1 |
Top |
Single-cell gene regulatory network inference analysis |
| Find out the significant the regulons (TFs) and the target genes of each regulon across cell types for different disease states |
| TF | Cell Type | Tissue | Disease Stage | Target Gene | RSS | Regulon Activity |
| ∗The dot plots of a searched regulon are shown for all cell subpopulations in each disease state of each tissue based on the regulon specific score inferred using pySCENIC and by calculating the average expression. |
| Page: 1 |
Top |
Somatic mutation of malignant transformation related genes |
| Annotation of somatic variants for genes involved in malignant transformation |
| Hugo Symbol | Variant Class | Variant Classification | dbSNP RS | HGVSc | HGVSp | HGVSp Short | SWISSPROT | BIOTYPE | SIFT | PolyPhen | Tumor Sample Barcode | Tissue | Histology | Sex | Age | Stage | Therapy Types | Drugs | Outcome |
| APOL1 | SNV | Missense_Mutation | c.664N>A | p.Val222Ile | p.V222I | O14791 | protein_coding | deleterious(0.04) | benign(0.085) | TCGA-BH-A0HF-01 | Breast | breast invasive carcinoma | Female | >=65 | I/II | Hormone Therapy | arimidex | SD | |
| APOL1 | SNV | Missense_Mutation | c.623N>A | p.Val208Asp | p.V208D | O14791 | protein_coding | deleterious(0) | benign(0.131) | TCGA-D8-A1XQ-01 | Breast | breast invasive carcinoma | Female | >=65 | I/II | Unknown | Unknown | SD | |
| APOL1 | insertion | Frame_Shift_Ins | novel | c.839_840insCCAAAGGCACCACCATCGCCAATGTGGTGTCTGG | p.Phe281GlnfsTer55 | p.F281Qfs*55 | O14791 | protein_coding | TCGA-A8-A07U-01 | Breast | breast invasive carcinoma | Female | >=65 | III/IV | Chemotherapy | 5-fluorouracil | SD | ||
| APOL1 | SNV | Missense_Mutation | c.43N>C | p.Ser15Arg | p.S15R | O14791 | protein_coding | deleterious_low_confidence(0.02) | benign(0.066) | TCGA-AA-3819-01 | Colorectum | colon adenocarcinoma | Female | <65 | I/II | Unknown | Unknown | SD | |
| APOL1 | SNV | Missense_Mutation | rs553515630 | c.1055N>T | p.Thr352Met | p.T352M | O14791 | protein_coding | tolerated(1) | benign(0.143) | TCGA-AY-A69D-01 | Colorectum | colon adenocarcinoma | Female | <65 | I/II | Unknown | Unknown | SD |
| APOL1 | SNV | Missense_Mutation | rs773763181 | c.419N>C | p.Met140Thr | p.M140T | O14791 | protein_coding | tolerated(0.59) | benign(0.028) | TCGA-QG-A5Z2-01 | Colorectum | colon adenocarcinoma | Male | <65 | I/II | Unknown | Unknown | SD |
| APOL1 | SNV | Missense_Mutation | c.716N>C | p.Ile239Thr | p.I239T | O14791 | protein_coding | deleterious(0.05) | benign(0.084) | TCGA-EI-6507-01 | Colorectum | rectum adenocarcinoma | Male | <65 | I/II | Unknown | Unknown | SD | |
| APOL1 | SNV | Missense_Mutation | c.459A>T | p.Arg153Ser | p.R153S | O14791 | protein_coding | tolerated(0.06) | possibly_damaging(0.723) | TCGA-EI-6513-01 | Colorectum | rectum adenocarcinoma | Male | <65 | III/IV | Unknown | Unknown | SD | |
| APOL1 | SNV | Missense_Mutation | rs187922489 | c.46N>A | p.Asp16Asn | p.D16N | O14791 | protein_coding | tolerated_low_confidence(0.2) | benign(0.146) | TCGA-A5-A0G1-01 | Endometrium | uterine corpus endometrioid carcinoma | Female | >=65 | I/II | Unknown | Unknown | SD |
| APOL1 | SNV | Missense_Mutation | novel | c.182G>A | p.Gly61Glu | p.G61E | O14791 | protein_coding | deleterious(0) | probably_damaging(0.988) | TCGA-A5-A0G2-01 | Endometrium | uterine corpus endometrioid carcinoma | Female | <65 | III/IV | Unknown | Unknown | SD |
| Page: 1 2 3 4 |
Top |
Related drugs of malignant transformation related genes |
| Identification of chemicals and drugs interact with genes involved in malignant transfromation |
| (DGIdb 4.0) |
| Entrez ID | Symbol | Category | Interaction Types | Drug Claim Name | Drug Name | PMIDs |
| Page: 1 |

Copyright 2023-Present -The University of Texas Health Science Center at Houston |