
|
|||||
|
 | |
| |
| |
| |
| |
| |
|
Gene: APOD |
Gene summary for APOD |
| Gene information | Species | Human | Gene symbol | APOD | Gene ID | 347 |
| Gene name | apolipoprotein D | |
| Gene Alias | APOD | |
| Cytomap | 3q29 | |
| Gene Type | protein-coding | GO ID | GO:0000302 | UniProtAcc | P05090 |
Top |
Malignant transformation analysis |
| Identification of the aberrant gene expression in precancerous and cancerous lesions by comparing the gene expression of stem-like cells in diseased tissues with normal stem cells |
| Entrez ID | Symbol | Replicates | Species | Organ | Tissue | Adj P-value | Log2FC | Malignancy |
| 347 | APOD | GSM4909282 | Human | Breast | IDC | 2.48e-40 | 8.81e-01 | -0.0288 |
| 347 | APOD | GSM4909285 | Human | Breast | IDC | 2.94e-02 | -1.79e-01 | 0.21 |
| 347 | APOD | GSM4909287 | Human | Breast | IDC | 1.21e-02 | -1.44e-01 | 0.2057 |
| 347 | APOD | GSM4909290 | Human | Breast | IDC | 3.98e-02 | -1.62e-01 | 0.2096 |
| 347 | APOD | GSM4909291 | Human | Breast | IDC | 1.80e-40 | 1.08e+00 | 0.1753 |
| 347 | APOD | GSM4909293 | Human | Breast | IDC | 1.65e-04 | -1.78e-01 | 0.1581 |
| 347 | APOD | GSM4909294 | Human | Breast | IDC | 2.27e-03 | 2.83e-01 | 0.2022 |
| 347 | APOD | GSM4909301 | Human | Breast | IDC | 7.79e-05 | -1.82e-01 | 0.1577 |
| 347 | APOD | GSM4909302 | Human | Breast | IDC | 3.72e-03 | -1.52e-01 | 0.1545 |
| 347 | APOD | GSM4909303 | Human | Breast | IDC | 2.45e-02 | 4.13e-01 | 0.0438 |
| 347 | APOD | GSM4909304 | Human | Breast | IDC | 1.65e-04 | -1.72e-01 | 0.1636 |
| 347 | APOD | GSM4909308 | Human | Breast | IDC | 4.06e-07 | -1.82e-01 | 0.158 |
| 347 | APOD | GSM4909311 | Human | Breast | IDC | 4.07e-03 | -1.11e-01 | 0.1534 |
| 347 | APOD | GSM4909312 | Human | Breast | IDC | 3.51e-04 | -1.82e-01 | 0.1552 |
| 347 | APOD | GSM4909313 | Human | Breast | IDC | 1.04e-12 | 6.67e-01 | 0.0391 |
| 347 | APOD | GSM4909315 | Human | Breast | IDC | 7.43e-04 | -1.82e-01 | 0.21 |
| 347 | APOD | GSM4909317 | Human | Breast | IDC | 1.04e-09 | 5.33e-01 | 0.1355 |
| 347 | APOD | GSM4909319 | Human | Breast | IDC | 7.43e-04 | -1.78e-01 | 0.1563 |
| 347 | APOD | GSM4909321 | Human | Breast | IDC | 3.51e-04 | -1.82e-01 | 0.1559 |
| 347 | APOD | NCCBC14 | Human | Breast | DCIS | 1.16e-02 | -4.21e-02 | 0.2021 |
| Page: 1 2 3 4 |
| Tissue | Expression Dynamics | Abbreviation |
| Breast | 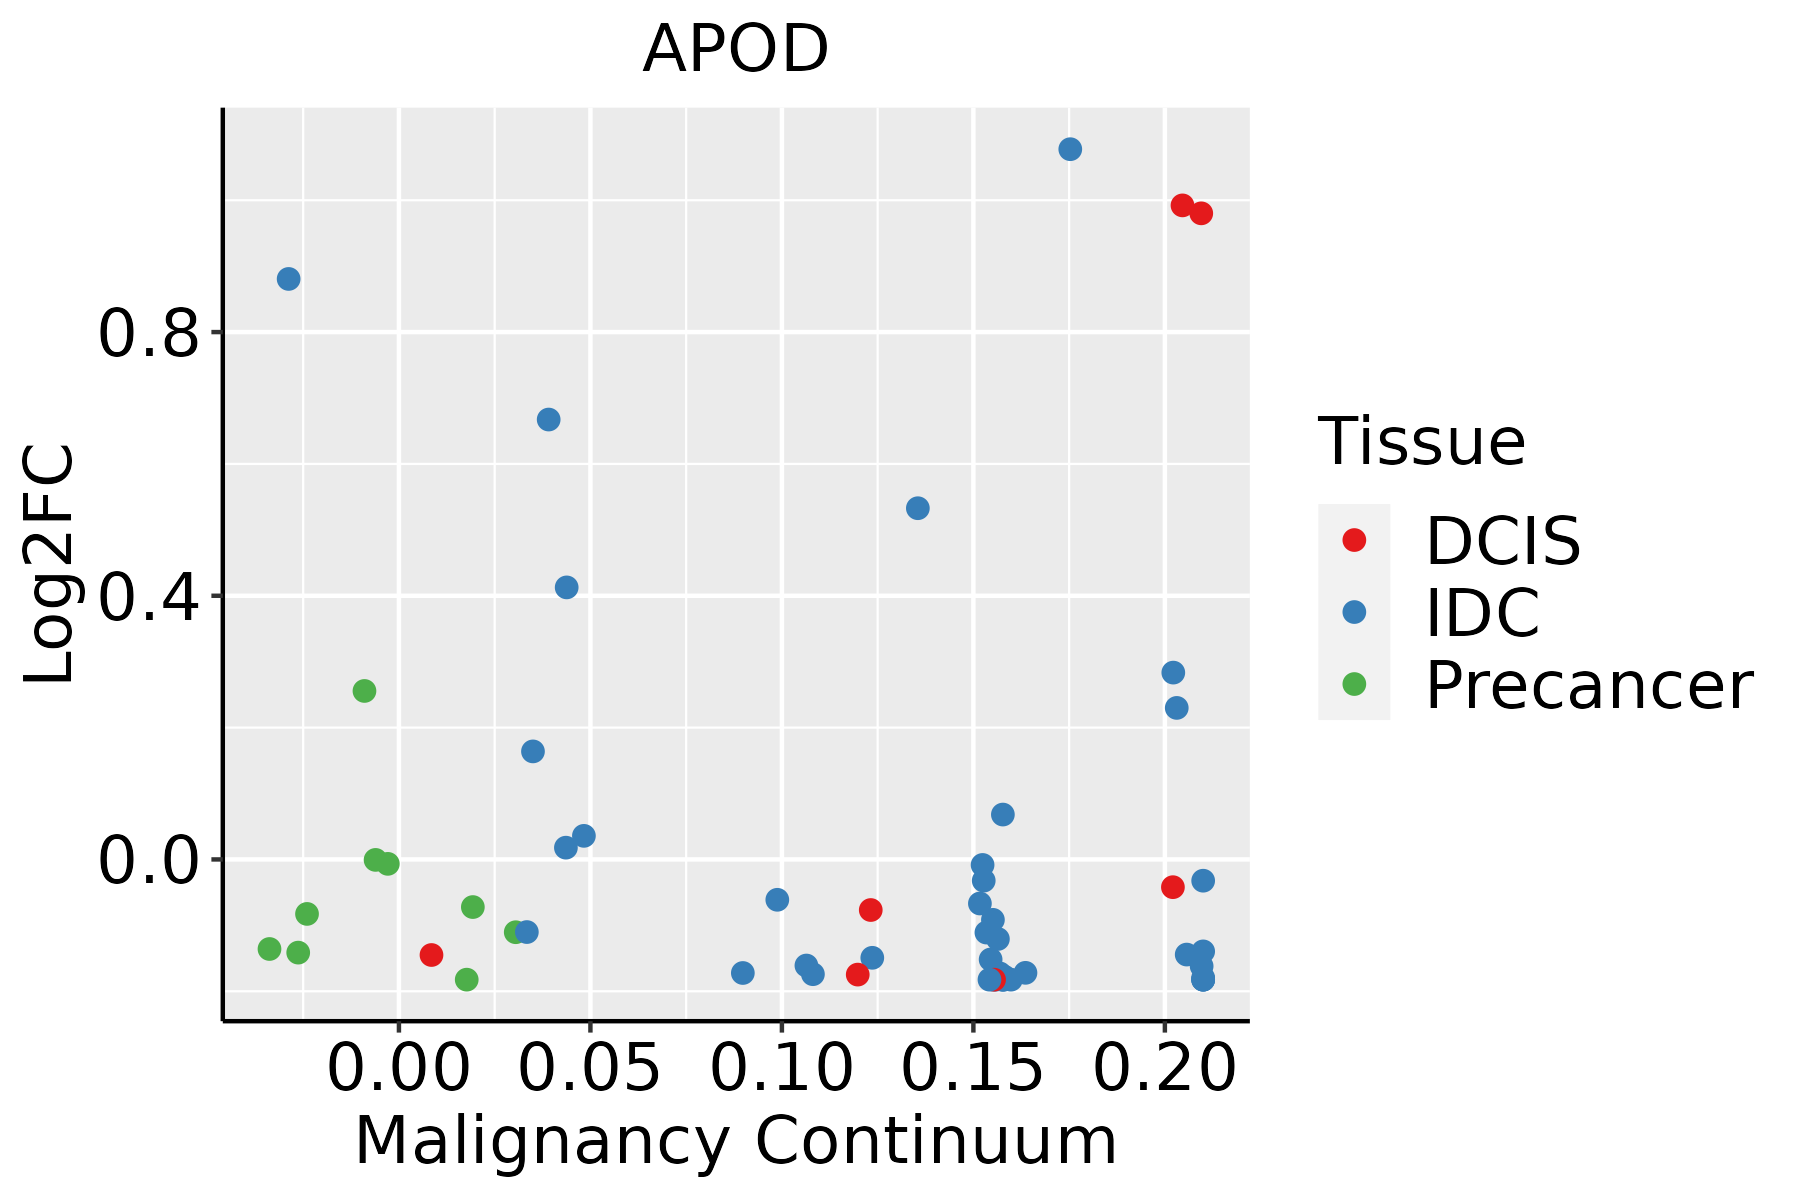 | IDC: Invasive ductal carcinoma |
| DCIS: Ductal carcinoma in situ | ||
| Precancer(BRCA1-mut): Precancerous lesion from BRCA1 mutation carriers | ||
| Esophagus | 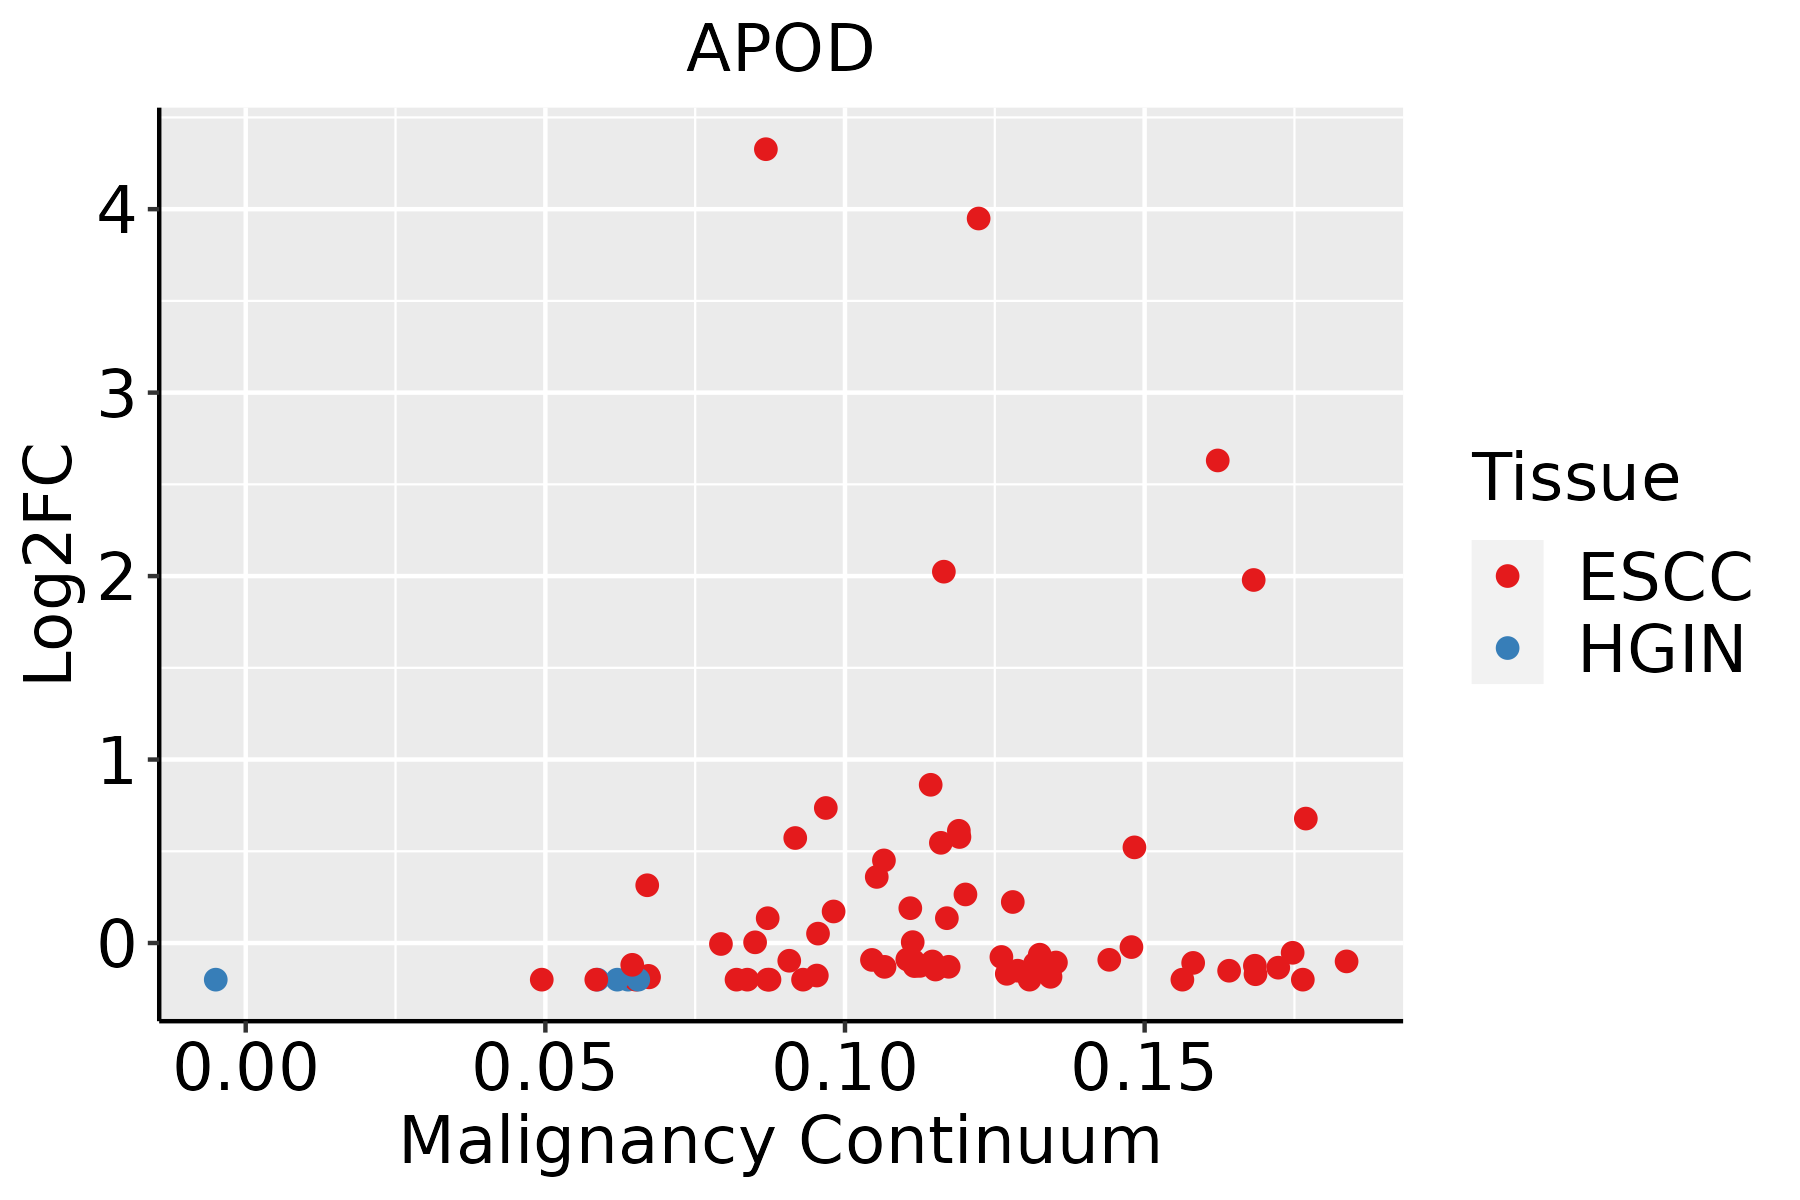 | ESCC: Esophageal squamous cell carcinoma |
| HGIN: High-grade intraepithelial neoplasias | ||
| LGIN: Low-grade intraepithelial neoplasias | ||
| Oral Cavity |  | EOLP: Erosive Oral lichen planus |
| LP: leukoplakia | ||
| NEOLP: Non-erosive oral lichen planus | ||
| OSCC: Oral squamous cell carcinoma | ||
| Skin | 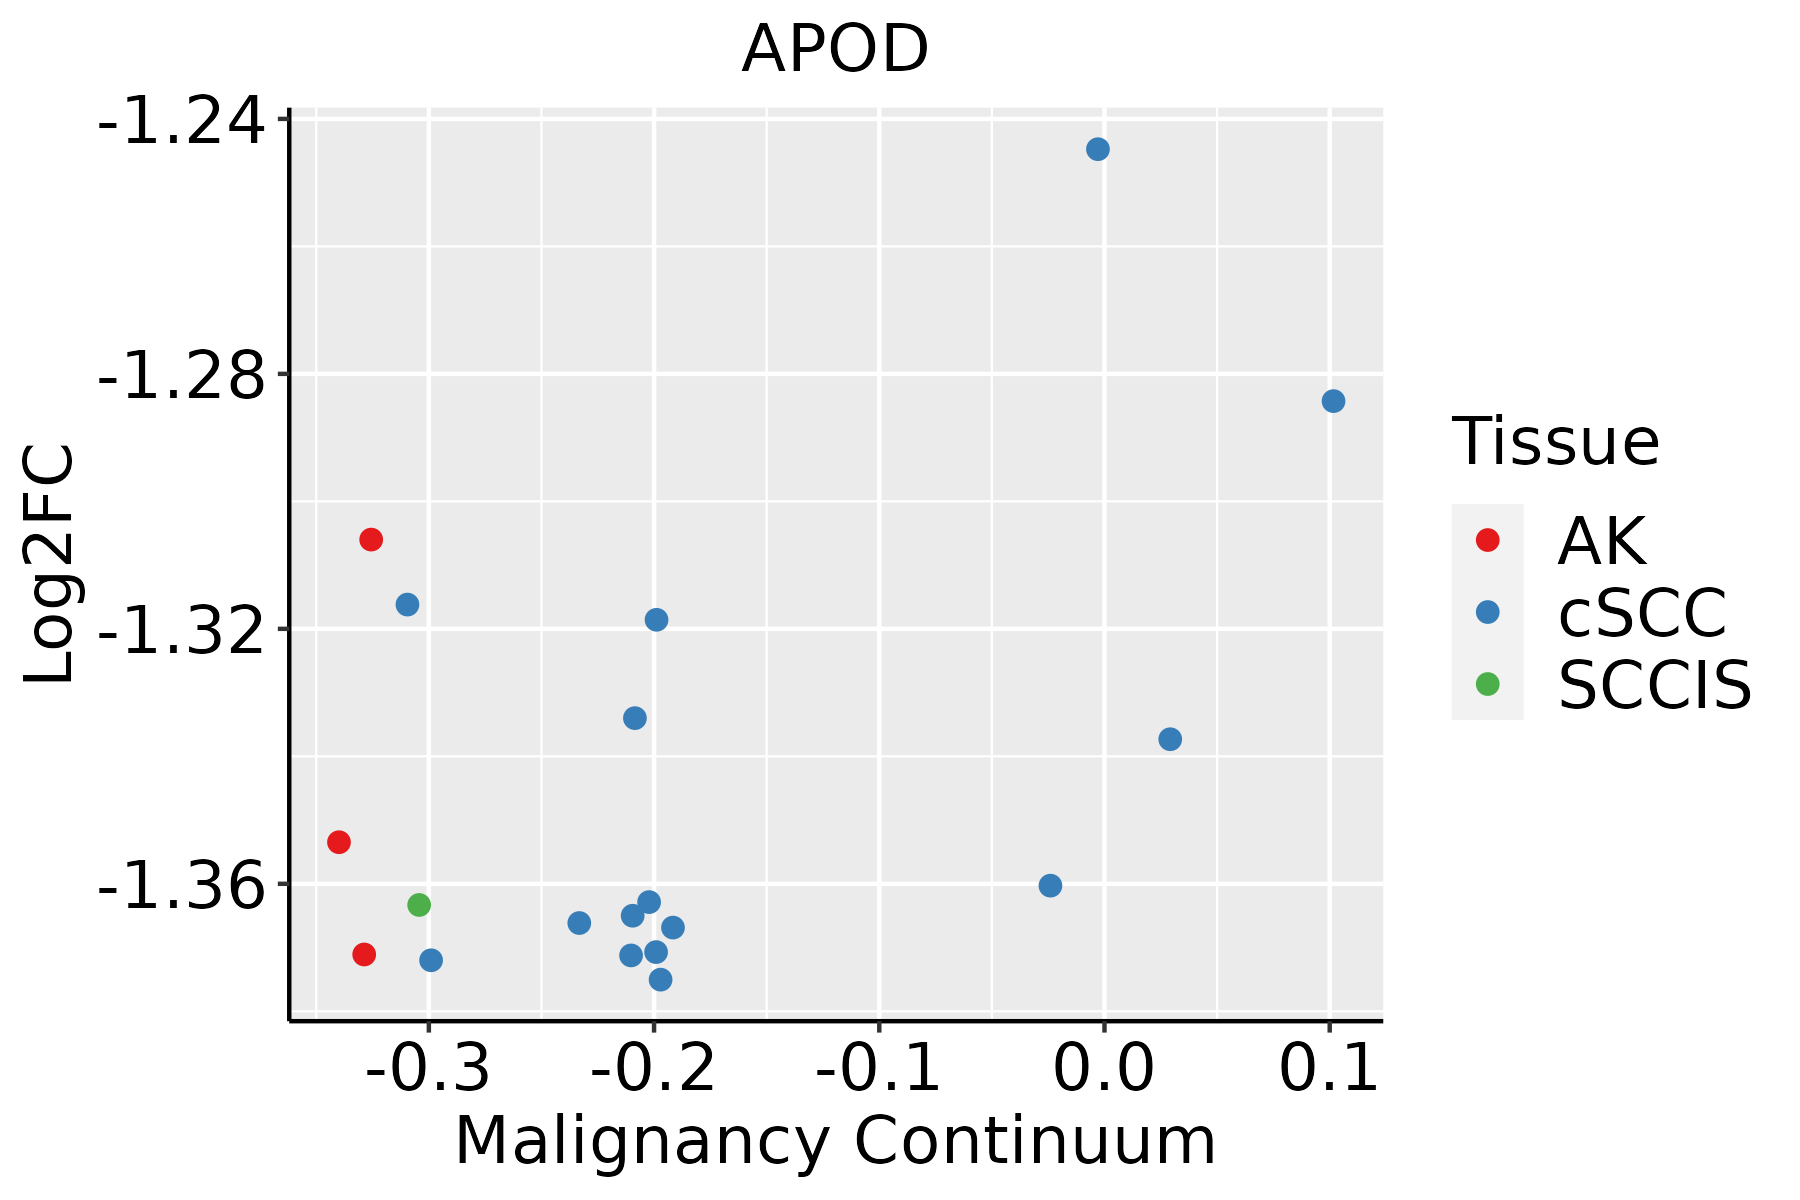 | AK: Actinic keratosis |
| cSCC: Cutaneous squamous cell carcinoma | ||
| SCCIS:squamous cell carcinoma in situ |
| ∗log2FC in expression of this searched gene in stem-like cells from each diseased tissue sample relative to stem-like cells in normal samples in each tissue plotted against the malignancy continuum. Samples are colored based on if they are from different disease stage. |
Top |
Malignant transformation related pathway analysis |
| Find out the enriched GO biological processes and KEGG pathways involved in transition from healthy to precancer to cancer |
| Tissue | Disease Stage | Enriched GO biological Processes |
| Colorectum | AD |  |
| Colorectum | SER |  |
| Colorectum | MSS |  |
| Colorectum | MSI-H |  |
| Colorectum | FAP |  |
| ∗Top 15 enriched GO BP terms are showed in the bar plot of each disease state in each tissue. Each row represents a significant GO biological process which is colored according to the -log10(p.adjust). |
| Page: 1 2 3 4 5 6 7 8 9 |
| GO ID | Tissue | Disease Stage | Description | Gene Ratio | Bg Ratio | pvalue | p.adjust | Count |
| GO:000697914 | Breast | IDC | response to oxidative stress | 83/1434 | 446/18723 | 2.36e-14 | 7.06e-12 | 83 |
| GO:000030214 | Breast | IDC | response to reactive oxygen species | 46/1434 | 222/18723 | 4.12e-10 | 4.59e-08 | 46 |
| GO:000756813 | Breast | IDC | aging | 52/1434 | 339/18723 | 1.14e-06 | 5.10e-05 | 52 |
| GO:005090011 | Breast | IDC | leukocyte migration | 54/1434 | 369/18723 | 3.10e-06 | 1.15e-04 | 54 |
| GO:000941013 | Breast | IDC | response to xenobiotic stimulus | 62/1434 | 462/18723 | 1.05e-05 | 2.88e-04 | 62 |
| GO:000268511 | Breast | IDC | regulation of leukocyte migration | 33/1434 | 210/18723 | 6.10e-05 | 1.27e-03 | 33 |
| GO:003109912 | Breast | IDC | regeneration | 31/1434 | 198/18723 | 1.08e-04 | 2.03e-03 | 31 |
| GO:001921612 | Breast | IDC | regulation of lipid metabolic process | 45/1434 | 331/18723 | 1.21e-04 | 2.24e-03 | 45 |
| GO:000268311 | Breast | IDC | negative regulation of immune system process | 55/1434 | 434/18723 | 1.53e-04 | 2.67e-03 | 55 |
| GO:00512712 | Breast | IDC | negative regulation of cellular component movement | 48/1434 | 367/18723 | 1.88e-04 | 3.12e-03 | 48 |
| GO:20001462 | Breast | IDC | negative regulation of cell motility | 46/1434 | 359/18723 | 4.01e-04 | 5.60e-03 | 46 |
| GO:007167511 | Breast | IDC | regulation of mononuclear cell migration | 20/1434 | 115/18723 | 4.35e-04 | 5.90e-03 | 20 |
| GO:007167411 | Breast | IDC | mononuclear cell migration | 29/1434 | 196/18723 | 4.68e-04 | 6.26e-03 | 29 |
| GO:007259413 | Breast | IDC | establishment of protein localization to organelle | 51/1434 | 422/18723 | 7.94e-04 | 9.55e-03 | 51 |
| GO:00303362 | Breast | IDC | negative regulation of cell migration | 43/1434 | 344/18723 | 1.01e-03 | 1.13e-02 | 43 |
| GO:00400132 | Breast | IDC | negative regulation of locomotion | 47/1434 | 391/18723 | 1.39e-03 | 1.43e-02 | 47 |
| GO:00486592 | Breast | IDC | smooth muscle cell proliferation | 26/1434 | 184/18723 | 1.77e-03 | 1.72e-02 | 26 |
| GO:00486602 | Breast | IDC | regulation of smooth muscle cell proliferation | 25/1434 | 180/18723 | 2.71e-03 | 2.41e-02 | 25 |
| GO:00071625 | Breast | IDC | negative regulation of cell adhesion | 37/1434 | 303/18723 | 3.27e-03 | 2.75e-02 | 37 |
| GO:2000404 | Breast | IDC | regulation of T cell migration | 9/1434 | 42/18723 | 3.91e-03 | 3.20e-02 | 9 |
| Page: 1 2 3 4 5 6 7 8 9 10 11 12 13 14 15 16 17 18 |
| Pathway ID | Tissue | Disease Stage | Description | Gene Ratio | Bg Ratio | pvalue | p.adjust | qvalue | Count |
| Page: 1 |
Top |
Cell-cell communication analysis |
| Identification of potential cell-cell interactions between two cell types and their ligand-receptor pairs for different disease states |
| Ligand | Receptor | LRpair | Pathway | Tissue | Disease Stage |
| Page: 1 |
Top |
Single-cell gene regulatory network inference analysis |
| Find out the significant the regulons (TFs) and the target genes of each regulon across cell types for different disease states |
| TF | Cell Type | Tissue | Disease Stage | Target Gene | RSS | Regulon Activity |
| ∗The dot plots of a searched regulon are shown for all cell subpopulations in each disease state of each tissue based on the regulon specific score inferred using pySCENIC and by calculating the average expression. |
| Page: 1 |
Top |
Somatic mutation of malignant transformation related genes |
| Annotation of somatic variants for genes involved in malignant transformation |
| Hugo Symbol | Variant Class | Variant Classification | dbSNP RS | HGVSc | HGVSp | HGVSp Short | SWISSPROT | BIOTYPE | SIFT | PolyPhen | Tumor Sample Barcode | Tissue | Histology | Sex | Age | Stage | Therapy Types | Drugs | Outcome |
| APOD | SNV | Missense_Mutation | novel | c.254N>C | p.Gly85Ala | p.G85A | P05090 | protein_coding | deleterious(0.04) | possibly_damaging(0.899) | TCGA-OL-A5RZ-01 | Breast | breast invasive carcinoma | Female | <65 | I/II | Chemotherapy | doxorubicin | CR |
| APOD | insertion | Nonsense_Mutation | novel | c.145_146insCCTAGCAAGACAGGCT | p.Ile49ThrfsTer2 | p.I49Tfs*2 | P05090 | protein_coding | TCGA-OL-A66P-01 | Breast | breast invasive carcinoma | Female | >=65 | I/II | Chemotherapy | cytoxan | CR | ||
| APOD | SNV | Missense_Mutation | rs5954 | c.344N>T | p.Ser115Leu | p.S115L | P05090 | protein_coding | tolerated(0.57) | benign(0.23) | TCGA-JW-A5VJ-01 | Cervix | cervical & endocervical cancer | Female | <65 | I/II | Unknown | Unknown | PD |
| APOD | SNV | Missense_Mutation | rs5954 | c.344C>T | p.Ser115Leu | p.S115L | P05090 | protein_coding | tolerated(0.57) | benign(0.23) | TCGA-Q1-A73O-01 | Cervix | cervical & endocervical cancer | Female | <65 | I/II | Chemotherapy | cisplatin | CR |
| APOD | SNV | Missense_Mutation | rs5954 | c.344C>T | p.Ser115Leu | p.S115L | P05090 | protein_coding | tolerated(0.57) | benign(0.23) | TCGA-VS-A953-01 | Cervix | cervical & endocervical cancer | Female | <65 | I/II | Unknown | Unknown | PD |
| APOD | SNV | Missense_Mutation | c.53N>T | p.Ala18Val | p.A18V | P05090 | protein_coding | tolerated(0.21) | benign(0.254) | TCGA-AA-A02R-01 | Colorectum | colon adenocarcinoma | Female | >=65 | I/II | Unknown | Unknown | PD | |
| APOD | SNV | Missense_Mutation | novel | c.153N>T | p.Lys51Asn | p.K51N | P05090 | protein_coding | deleterious(0) | probably_damaging(0.989) | TCGA-AZ-4315-01 | Colorectum | colon adenocarcinoma | Male | <65 | I/II | Unknown | Unknown | SD |
| APOD | SNV | Missense_Mutation | c.277G>C | p.Glu93Gln | p.E93Q | P05090 | protein_coding | tolerated(0.29) | benign(0.026) | TCGA-CK-4951-01 | Colorectum | colon adenocarcinoma | Female | >=65 | I/II | Unknown | Unknown | PD | |
| APOD | SNV | Missense_Mutation | rs201787147 | c.370N>A | p.Asp124Asn | p.D124N | P05090 | protein_coding | deleterious(0.03) | probably_damaging(0.986) | TCGA-CM-6162-01 | Colorectum | colon adenocarcinoma | Female | <65 | III/IV | Chemotherapy | oxaliplatin | SD |
| APOD | SNV | Missense_Mutation | rs5954 | c.344N>T | p.Ser115Leu | p.S115L | P05090 | protein_coding | tolerated(0.57) | benign(0.23) | TCGA-NH-A50U-01 | Colorectum | colon adenocarcinoma | Male | <65 | I/II | Ancillary | leucovorin | PD |
| Page: 1 2 3 |
Top |
Related drugs of malignant transformation related genes |
| Identification of chemicals and drugs interact with genes involved in malignant transfromation |
| (DGIdb 4.0) |
| Entrez ID | Symbol | Category | Interaction Types | Drug Claim Name | Drug Name | PMIDs |
| 347 | APOD | DRUGGABLE GENOME, ENZYME | RETINOIDS | 8943263 |
| Page: 1 |

Copyright 2023-Present -The University of Texas Health Science Center at Houston |