
|
|||||
|
 | |
| |
| |
| |
| |
| |
|
Gene: APOC3 |
Gene summary for APOC3 |
| Gene information | Species | Human | Gene symbol | APOC3 | Gene ID | 345 |
| Gene name | apolipoprotein C3 | |
| Gene Alias | APOCIII | |
| Cytomap | 11q23.3 | |
| Gene Type | protein-coding | GO ID | GO:0006082 | UniProtAcc | A3KPE2 |
Top |
Malignant transformation analysis |
| Identification of the aberrant gene expression in precancerous and cancerous lesions by comparing the gene expression of stem-like cells in diseased tissues with normal stem cells |
| Entrez ID | Symbol | Replicates | Species | Organ | Tissue | Adj P-value | Log2FC | Malignancy |
| 345 | APOC3 | NAFLD1 | Human | Liver | NAFLD | 1.15e-07 | 5.36e-01 | -0.04 |
| 345 | APOC3 | S41 | Human | Liver | Cirrhotic | 5.01e-08 | 8.25e-01 | -0.0343 |
| 345 | APOC3 | S43 | Human | Liver | Cirrhotic | 5.63e-26 | 9.70e-01 | -0.0187 |
| 345 | APOC3 | S44 | Human | Liver | HCC | 7.80e-13 | 1.45e+00 | -0.0083 |
| 345 | APOC3 | HCC1_Meng | Human | Liver | HCC | 7.36e-41 | 3.36e-01 | 0.0246 |
| 345 | APOC3 | HCC2_Meng | Human | Liver | HCC | 1.26e-26 | -7.25e-01 | 0.0107 |
| 345 | APOC3 | cirrhotic1 | Human | Liver | Cirrhotic | 5.94e-05 | -3.59e-01 | 0.0202 |
| 345 | APOC3 | cirrhotic2 | Human | Liver | Cirrhotic | 3.01e-13 | 3.69e-03 | 0.0201 |
| 345 | APOC3 | HCC1 | Human | Liver | HCC | 2.37e-07 | 3.62e+00 | 0.5336 |
| 345 | APOC3 | HCC2 | Human | Liver | HCC | 8.64e-49 | 7.28e+00 | 0.5341 |
| 345 | APOC3 | HCC5 | Human | Liver | HCC | 1.56e-03 | 4.57e+00 | 0.4932 |
| 345 | APOC3 | Pt13.a | Human | Liver | HCC | 2.90e-69 | 1.01e+00 | 0.021 |
| 345 | APOC3 | Pt13.b | Human | Liver | HCC | 8.81e-91 | 9.23e-01 | 0.0251 |
| 345 | APOC3 | Pt13.c | Human | Liver | HCC | 2.32e-28 | 9.66e-01 | 0.0076 |
| 345 | APOC3 | Pt14.a | Human | Liver | HCC | 2.47e-03 | -1.43e-01 | 0.0169 |
| 345 | APOC3 | Pt14.b | Human | Liver | HCC | 6.60e-24 | 1.08e+00 | 0.018 |
| 345 | APOC3 | Pt14.c | Human | Liver | HCC | 7.14e-11 | 9.85e-01 | 0.0054 |
| 345 | APOC3 | Pt14.d | Human | Liver | HCC | 3.70e-31 | 7.90e-01 | 0.0143 |
| 345 | APOC3 | S014 | Human | Liver | HCC | 2.46e-05 | 2.30e+00 | 0.2254 |
| 345 | APOC3 | S028 | Human | Liver | HCC | 2.06e-06 | 1.28e+00 | 0.2503 |
| Page: 1 2 |
| Tissue | Expression Dynamics | Abbreviation |
| GC | 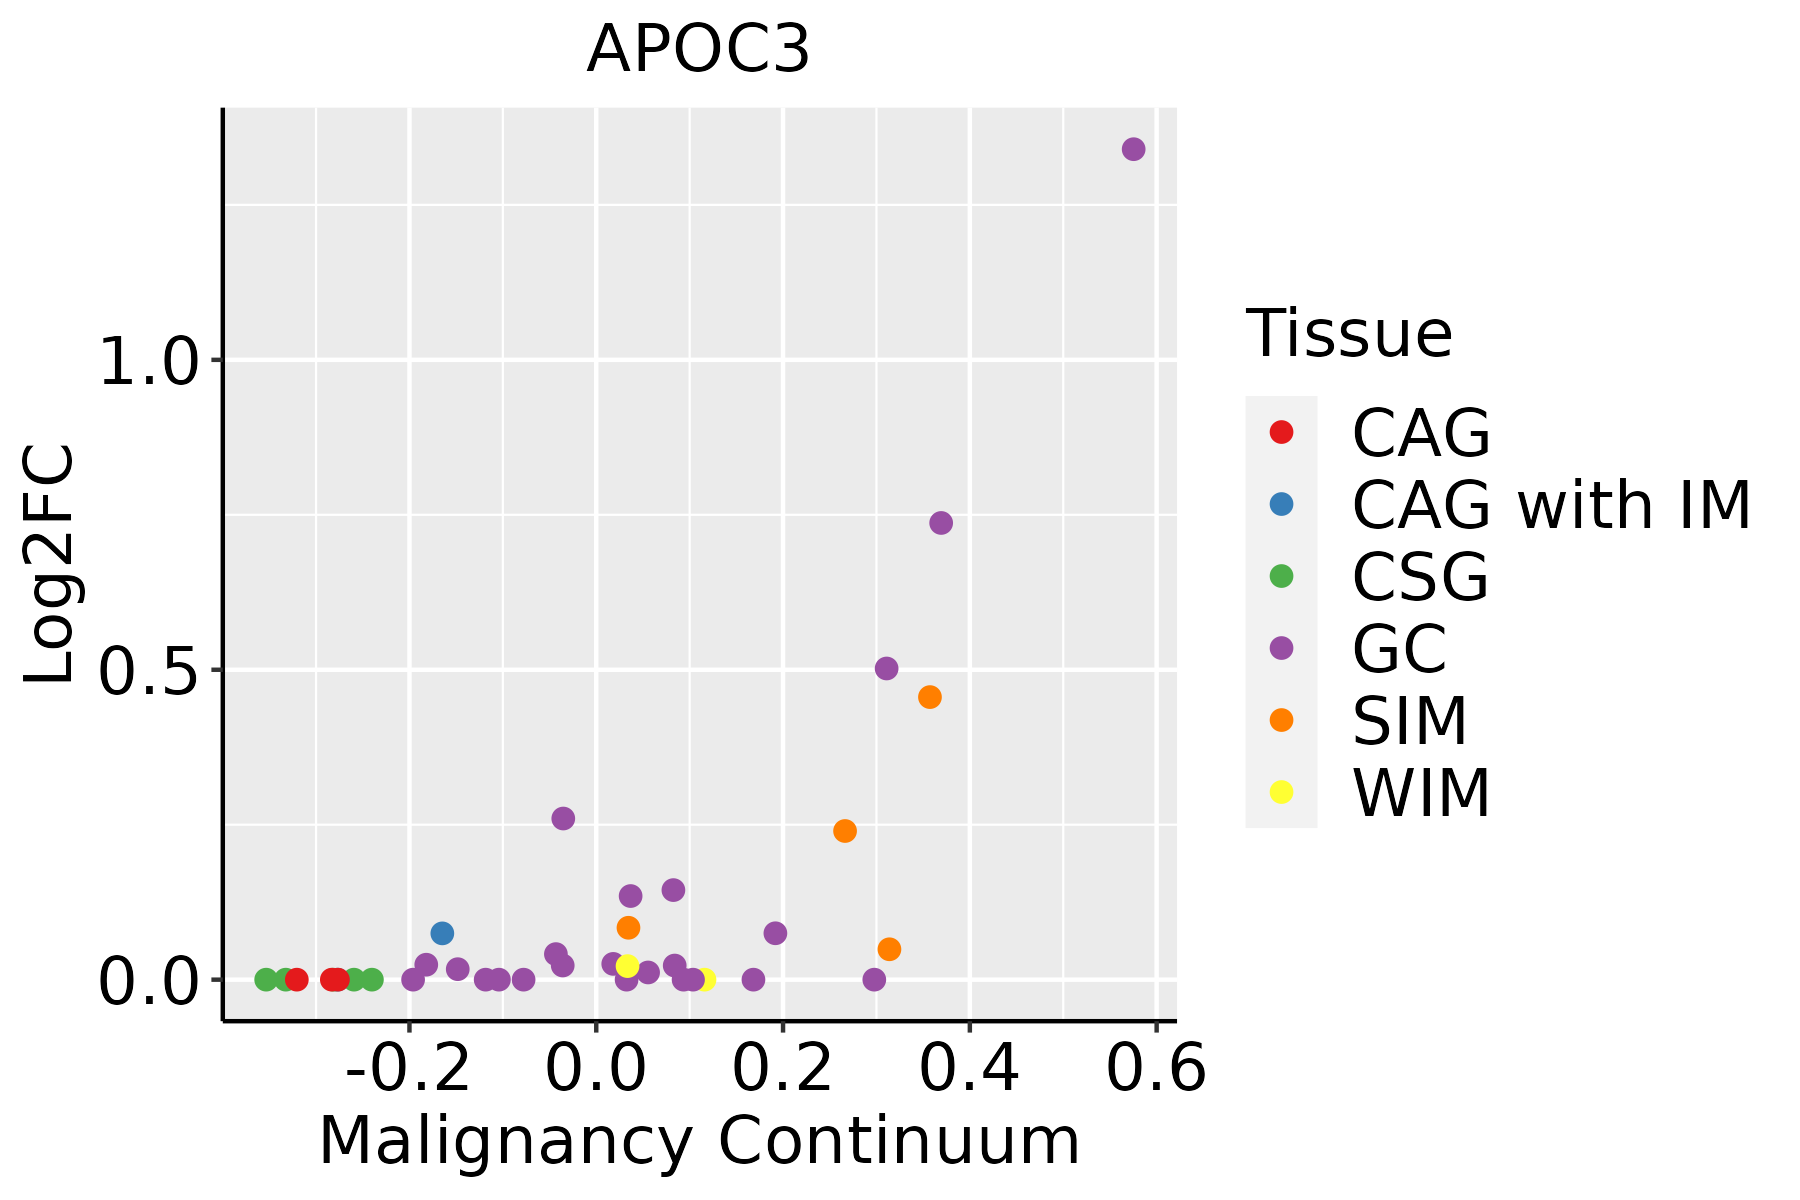 | CAG: Chronic atrophic gastritis |
| CAG with IM: Chronic atrophic gastritis with intestinal metaplasia | ||
| CSG: Chronic superficial gastritis | ||
| GC: Gastric cancer | ||
| SIM: Severe intestinal metaplasia | ||
| WIM: Wild intestinal metaplasia | ||
| Liver | 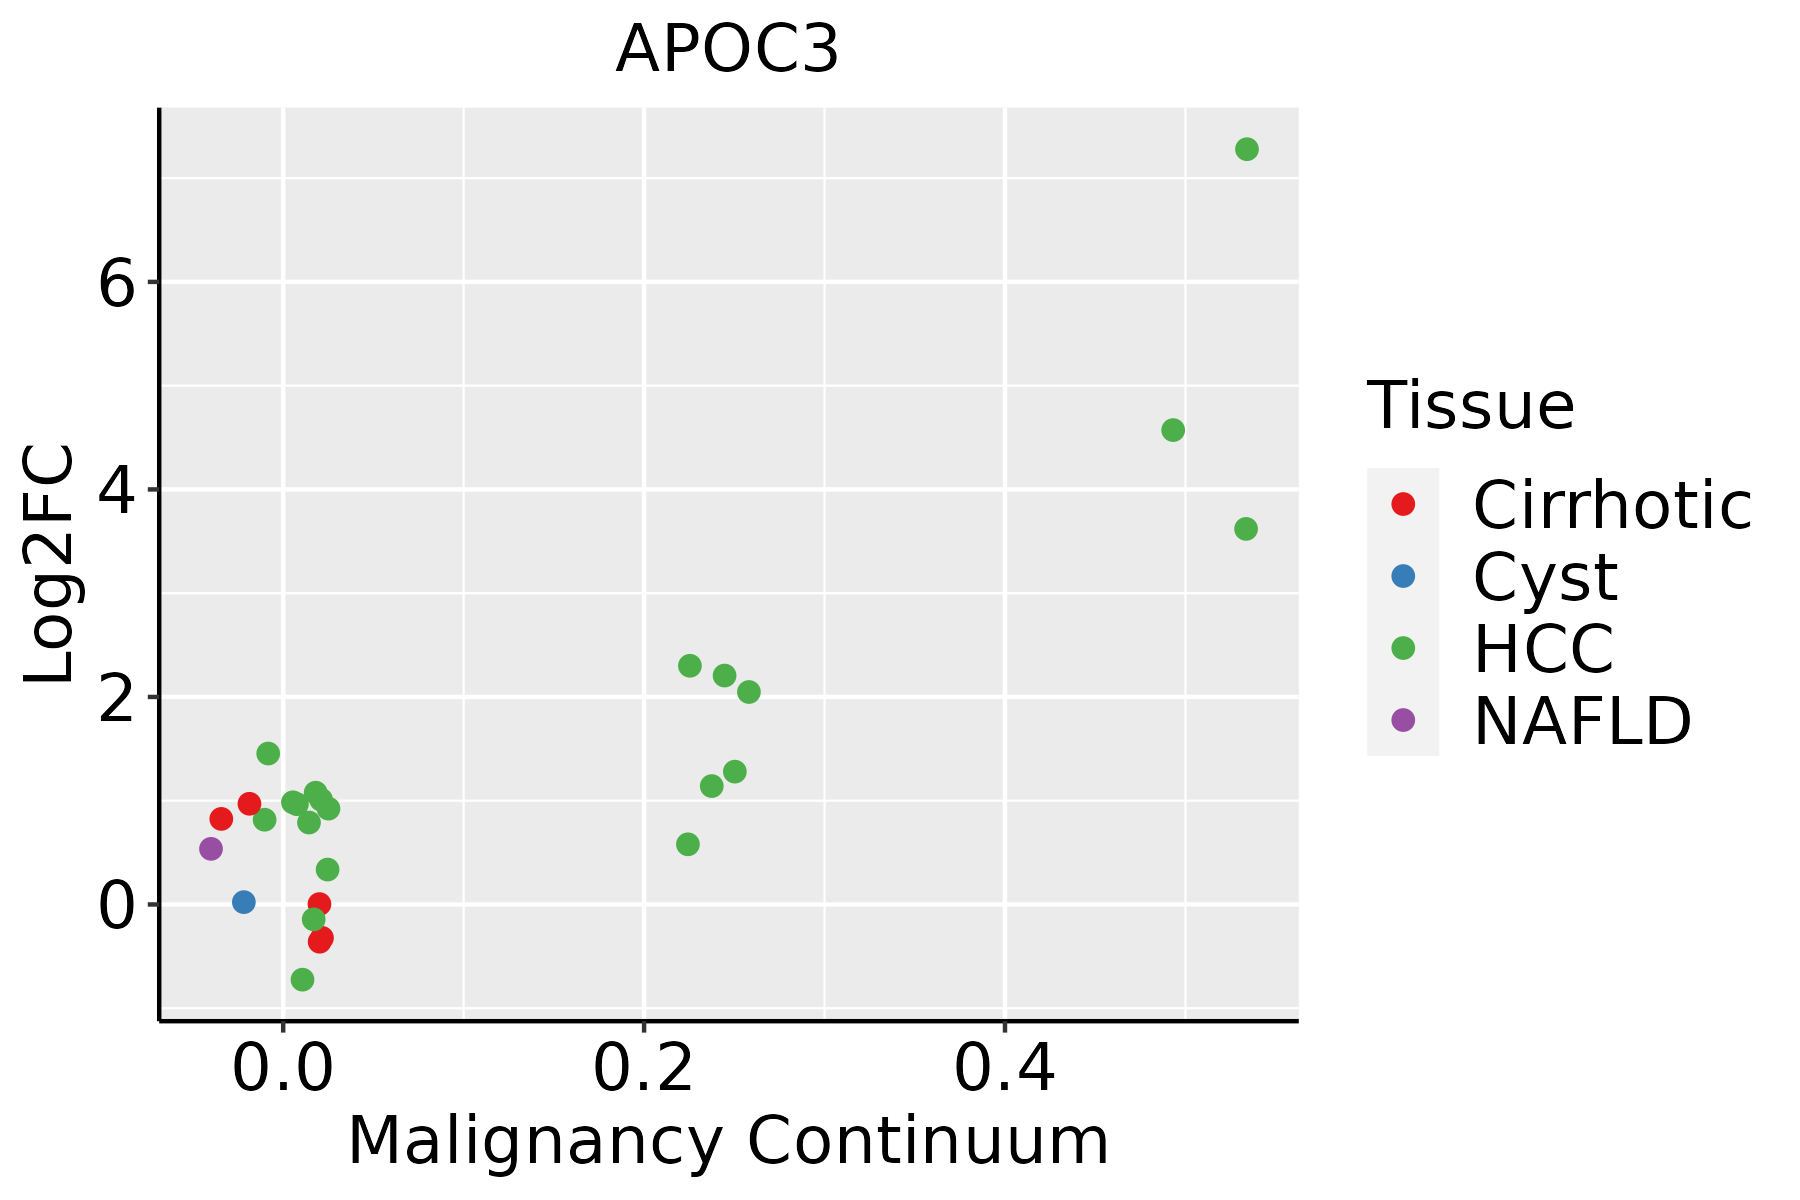 | HCC: Hepatocellular carcinoma |
| NAFLD: Non-alcoholic fatty liver disease |
| ∗log2FC in expression of this searched gene in stem-like cells from each diseased tissue sample relative to stem-like cells in normal samples in each tissue plotted against the malignancy continuum. Samples are colored based on if they are from different disease stage. |
Top |
Malignant transformation related pathway analysis |
| Find out the enriched GO biological processes and KEGG pathways involved in transition from healthy to precancer to cancer |
| Tissue | Disease Stage | Enriched GO biological Processes |
| Colorectum | AD |  |
| Colorectum | SER |  |
| Colorectum | MSS |  |
| Colorectum | MSI-H |  |
| Colorectum | FAP |  |
| ∗Top 15 enriched GO BP terms are showed in the bar plot of each disease state in each tissue. Each row represents a significant GO biological process which is colored according to the -log10(p.adjust). |
| Page: 1 2 3 4 5 6 7 8 9 |
| GO ID | Tissue | Disease Stage | Description | Gene Ratio | Bg Ratio | pvalue | p.adjust | Count |
| GO:00066316 | Liver | NAFLD | fatty acid metabolic process | 92/1882 | 390/18723 | 3.38e-15 | 3.29e-12 | 92 |
| GO:00160535 | Liver | NAFLD | organic acid biosynthetic process | 77/1882 | 316/18723 | 1.03e-13 | 6.69e-11 | 77 |
| GO:00463945 | Liver | NAFLD | carboxylic acid biosynthetic process | 75/1882 | 314/18723 | 6.37e-13 | 3.39e-10 | 75 |
| GO:00442425 | Liver | NAFLD | cellular lipid catabolic process | 52/1882 | 214/18723 | 1.15e-09 | 2.17e-07 | 52 |
| GO:00550883 | Liver | NAFLD | lipid homeostasis | 44/1882 | 167/18723 | 1.48e-09 | 2.54e-07 | 44 |
| GO:00098957 | Liver | NAFLD | negative regulation of catabolic process | 65/1882 | 320/18723 | 2.50e-08 | 2.71e-06 | 65 |
| GO:00072654 | Liver | NAFLD | Ras protein signal transduction | 66/1882 | 337/18723 | 8.43e-08 | 7.09e-06 | 66 |
| GO:00313307 | Liver | NAFLD | negative regulation of cellular catabolic process | 55/1882 | 262/18723 | 9.35e-08 | 7.59e-06 | 55 |
| GO:00066413 | Liver | NAFLD | triglyceride metabolic process | 29/1882 | 100/18723 | 9.51e-08 | 7.62e-06 | 29 |
| GO:00160426 | Liver | NAFLD | lipid catabolic process | 63/1882 | 320/18723 | 1.35e-07 | 1.02e-05 | 63 |
| GO:0055090 | Liver | NAFLD | acylglycerol homeostasis | 17/1882 | 42/18723 | 2.22e-07 | 1.53e-05 | 17 |
| GO:0070328 | Liver | NAFLD | triglyceride homeostasis | 17/1882 | 42/18723 | 2.22e-07 | 1.53e-05 | 17 |
| GO:00108765 | Liver | NAFLD | lipid localization | 79/1882 | 448/18723 | 4.75e-07 | 2.92e-05 | 79 |
| GO:00723303 | Liver | NAFLD | monocarboxylic acid biosynthetic process | 46/1882 | 214/18723 | 5.06e-07 | 3.07e-05 | 46 |
| GO:00620125 | Liver | NAFLD | regulation of small molecule metabolic process | 63/1882 | 334/18723 | 6.55e-07 | 3.79e-05 | 63 |
| GO:00066392 | Liver | NAFLD | acylglycerol metabolic process | 32/1882 | 128/18723 | 8.82e-07 | 4.60e-05 | 32 |
| GO:00066382 | Liver | NAFLD | neutral lipid metabolic process | 32/1882 | 129/18723 | 1.06e-06 | 5.35e-05 | 32 |
| GO:00303013 | Liver | NAFLD | cholesterol transport | 30/1882 | 117/18723 | 1.08e-06 | 5.40e-05 | 30 |
| GO:00068694 | Liver | NAFLD | lipid transport | 71/1882 | 398/18723 | 1.16e-06 | 5.59e-05 | 71 |
| GO:00159183 | Liver | NAFLD | sterol transport | 32/1882 | 130/18723 | 1.27e-06 | 6.01e-05 | 32 |
| Page: 1 2 3 4 5 6 7 8 9 10 11 12 13 |
| Pathway ID | Tissue | Disease Stage | Description | Gene Ratio | Bg Ratio | pvalue | p.adjust | qvalue | Count |
| hsa049796 | Liver | NAFLD | Cholesterol metabolism | 20/1043 | 51/8465 | 9.73e-07 | 4.56e-05 | 3.67e-05 | 20 |
| hsa033206 | Liver | NAFLD | PPAR signaling pathway | 25/1043 | 75/8465 | 1.61e-06 | 6.62e-05 | 5.33e-05 | 25 |
| hsa0497911 | Liver | NAFLD | Cholesterol metabolism | 20/1043 | 51/8465 | 9.73e-07 | 4.56e-05 | 3.67e-05 | 20 |
| hsa0332011 | Liver | NAFLD | PPAR signaling pathway | 25/1043 | 75/8465 | 1.61e-06 | 6.62e-05 | 5.33e-05 | 25 |
| hsa049792 | Liver | Cirrhotic | Cholesterol metabolism | 30/2530 | 51/8465 | 1.59e-05 | 1.39e-04 | 8.60e-05 | 30 |
| hsa0332021 | Liver | Cirrhotic | PPAR signaling pathway | 32/2530 | 75/8465 | 1.24e-02 | 3.92e-02 | 2.42e-02 | 32 |
| hsa049793 | Liver | Cirrhotic | Cholesterol metabolism | 30/2530 | 51/8465 | 1.59e-05 | 1.39e-04 | 8.60e-05 | 30 |
| hsa0332031 | Liver | Cirrhotic | PPAR signaling pathway | 32/2530 | 75/8465 | 1.24e-02 | 3.92e-02 | 2.42e-02 | 32 |
| hsa049794 | Liver | HCC | Cholesterol metabolism | 41/4020 | 51/8465 | 1.33e-06 | 1.35e-05 | 7.49e-06 | 41 |
| hsa033204 | Liver | HCC | PPAR signaling pathway | 48/4020 | 75/8465 | 2.83e-03 | 9.37e-03 | 5.21e-03 | 48 |
| hsa049795 | Liver | HCC | Cholesterol metabolism | 41/4020 | 51/8465 | 1.33e-06 | 1.35e-05 | 7.49e-06 | 41 |
| hsa033205 | Liver | HCC | PPAR signaling pathway | 48/4020 | 75/8465 | 2.83e-03 | 9.37e-03 | 5.21e-03 | 48 |
| hsa03320 | Stomach | GC | PPAR signaling pathway | 18/708 | 75/8465 | 3.26e-05 | 4.01e-04 | 2.82e-04 | 18 |
| hsa033201 | Stomach | GC | PPAR signaling pathway | 18/708 | 75/8465 | 3.26e-05 | 4.01e-04 | 2.82e-04 | 18 |
| hsa033202 | Stomach | SIM | PPAR signaling pathway | 15/465 | 75/8465 | 1.08e-05 | 1.42e-04 | 1.14e-04 | 15 |
| hsa04979 | Stomach | SIM | Cholesterol metabolism | 8/465 | 51/8465 | 6.17e-03 | 3.83e-02 | 3.08e-02 | 8 |
| hsa033203 | Stomach | SIM | PPAR signaling pathway | 15/465 | 75/8465 | 1.08e-05 | 1.42e-04 | 1.14e-04 | 15 |
| hsa049791 | Stomach | SIM | Cholesterol metabolism | 8/465 | 51/8465 | 6.17e-03 | 3.83e-02 | 3.08e-02 | 8 |
| Page: 1 |
Top |
Cell-cell communication analysis |
| Identification of potential cell-cell interactions between two cell types and their ligand-receptor pairs for different disease states |
| Ligand | Receptor | LRpair | Pathway | Tissue | Disease Stage |
| Page: 1 |
Top |
Single-cell gene regulatory network inference analysis |
| Find out the significant the regulons (TFs) and the target genes of each regulon across cell types for different disease states |
| TF | Cell Type | Tissue | Disease Stage | Target Gene | RSS | Regulon Activity |
| ∗The dot plots of a searched regulon are shown for all cell subpopulations in each disease state of each tissue based on the regulon specific score inferred using pySCENIC and by calculating the average expression. |
| Page: 1 |
Top |
Somatic mutation of malignant transformation related genes |
| Annotation of somatic variants for genes involved in malignant transformation |
| Hugo Symbol | Variant Class | Variant Classification | dbSNP RS | HGVSc | HGVSp | HGVSp Short | SWISSPROT | BIOTYPE | SIFT | PolyPhen | Tumor Sample Barcode | Tissue | Histology | Sex | Age | Stage | Therapy Types | Drugs | Outcome |
| APOC3 | SNV | Missense_Mutation | rs201803883 | c.148N>A | p.Val50Met | p.V50M | P02656 | protein_coding | tolerated(0.17) | benign(0.283) | TCGA-AX-A05Y-01 | Endometrium | uterine corpus endometrioid carcinoma | Female | <65 | I/II | Unknown | Unknown | PD |
| APOC3 | SNV | Missense_Mutation | novel | c.140T>C | p.Leu47Pro | p.L47P | P02656 | protein_coding | deleterious(0) | probably_damaging(0.999) | TCGA-D1-A175-01 | Endometrium | uterine corpus endometrioid carcinoma | Female | <65 | I/II | Chemotherapy | paclitaxel | SD |
| APOC3 | SNV | Missense_Mutation | novel | c.214N>T | p.Asp72Tyr | p.D72Y | P02656 | protein_coding | deleterious(0.01) | probably_damaging(0.947) | TCGA-EO-A22X-01 | Endometrium | uterine corpus endometrioid carcinoma | Female | <65 | III/IV | Unspecific | Carboplatin | Complete Response |
| APOC3 | SNV | Missense_Mutation | novel | c.281C>T | p.Thr94Ile | p.T94I | P02656 | protein_coding | deleterious(0.02) | benign(0.151) | TCGA-EO-A3KX-01 | Endometrium | uterine corpus endometrioid carcinoma | Female | >=65 | I/II | Unknown | Unknown | SD |
| APOC3 | SNV | Missense_Mutation | c.252N>G | p.Phe84Leu | p.F84L | P02656 | protein_coding | tolerated(0.83) | benign(0.075) | TCGA-DD-A4NI-01 | Liver | liver hepatocellular carcinoma | Male | >=65 | I/II | Unknown | Unknown | SD | |
| APOC3 | SNV | Missense_Mutation | c.100G>T | p.Gly34Cys | p.G34C | P02656 | protein_coding | deleterious(0.01) | possibly_damaging(0.866) | TCGA-05-4410-01 | Lung | lung adenocarcinoma | Male | <65 | I/II | Unknown | Unknown | SD | |
| APOC3 | SNV | Missense_Mutation | c.148N>C | p.Val50Leu | p.V50L | P02656 | protein_coding | deleterious(0.01) | possibly_damaging(0.53) | TCGA-49-4487-01 | Lung | lung adenocarcinoma | Female | >=65 | I/II | Unknown | Unknown | PD | |
| APOC3 | SNV | Missense_Mutation | c.19C>G | p.Leu7Val | p.L7V | P02656 | protein_coding | deleterious(0.02) | possibly_damaging(0.607) | TCGA-66-2786-01 | Lung | lung squamous cell carcinoma | Female | >=65 | I/II | Unknown | Unknown | SD | |
| APOC3 | SNV | Missense_Mutation | c.278N>A | p.Pro93Gln | p.P93Q | P02656 | protein_coding | deleterious(0) | benign(0.06) | TCGA-66-2787-01 | Lung | lung squamous cell carcinoma | Male | <65 | I/II | Unknown | Unknown | SD | |
| APOC3 | SNV | Missense_Mutation | novel | c.101G>T | p.Gly34Val | p.G34V | P02656 | protein_coding | deleterious(0.01) | possibly_damaging(0.683) | TCGA-77-8136-01 | Lung | lung squamous cell carcinoma | Female | >=65 | I/II | Unknown | Unknown | PD |
| Page: 1 2 |
Top |
Related drugs of malignant transformation related genes |
| Identification of chemicals and drugs interact with genes involved in malignant transfromation |
| (DGIdb 4.0) |
| Entrez ID | Symbol | Category | Interaction Types | Drug Claim Name | Drug Name | PMIDs |
| 345 | APOC3 | ENZYME, DRUGGABLE GENOME | ISIS-APOCIIIRx | |||
| 345 | APOC3 | ENZYME, DRUGGABLE GENOME | ritonavir | RITONAVIR | 15809899 |
| Page: 1 |

Copyright 2023-Present -The University of Texas Health Science Center at Houston |